I will post my analysis for this pair along with another one on Monday Feb. 11 2013 during London session.
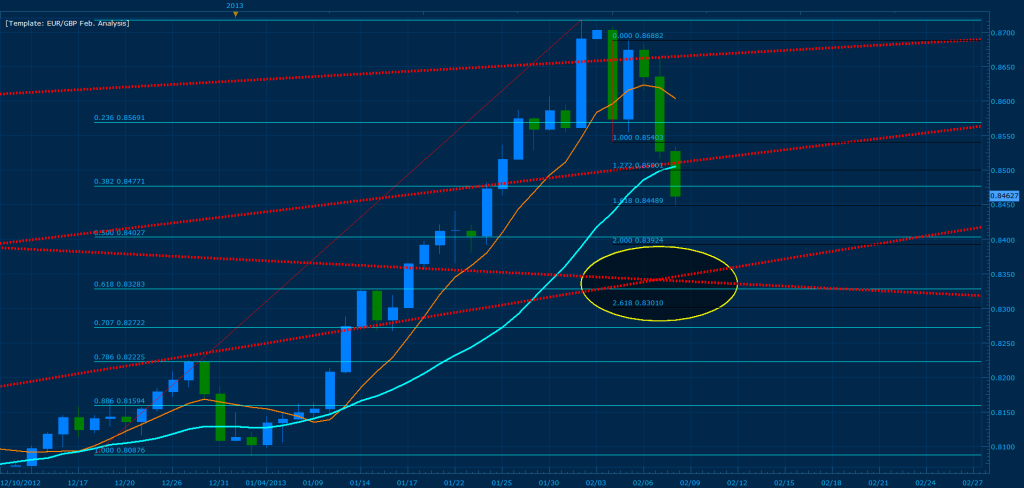
In the mean time I would like you all to study over the weekend the EUR/GBP and give me your opinion on the pairs current development. In addition, I would like YOU to “pinpoint” each one of these MSRT’s and post the coordinates (ending and starting points of the lines). By now you should know how to find these zones… but here is a hint: I’m using the daily chart from May 5th 2011 - November 2nd 2012 to draw these lines (4 trendlines). If any of you are able to show me these coordinates before I post them on Feb. 11 2013 4am EST, I will post all of my entries/exits and reasoning behind each trade next week. Why do I ask for such a task before sharing such information??? Well to put it simple… KNOWLEDGE must be earned, it is never given to those that do not seek it.
Whee, fun. Ok I believe I have the coordinates for the bottom two ascending lines.
Bottom one: (8/03/12;.78525) to (10/31/2012;.808). This are the two points of intersection between the 8 and 20 MVA of the latest ascending trend.
2nd one from bottom: (5/15/12; .7964) to (7/02/12;.8068). This one is less clear, since it attempts to trace the bottom of a slight reversal uptrend in the decline during that time period. The price respects it even after it breaks a couple of times, but quickly drops away from it.
The last and uppermost ascending line comes from a similar upturn during the slow descent of the price, from about 1/12 to the end of 3/12, but I can’t seem to get it right if I place it at the bottom as before. It’s somewhere in the middle of the price range.
The descending line passes through the one intersection between 8,20 and 200 MVAs on (9/30/12; .8716) but I don’t know where the other point comes from.
I am still trying to piece together what these MSRTs mean and why you picked them as significant instead of the others. I hope these numbers are worthy enough to merit a further lesson on their meaning.
EDIT: I can understand the meaning behind the two that crisscross but I’m not quite sure what the other two indicate.
Little segway (weeeeeee… oops I mean segue - Something I’ve just been thinking about, would I be correct to say that Harmonic Price Patterns are developed from the abc correction pattern of Elliot Wave Theory? I have an interest in both because they are quite similar in that da-dum-da-dum-da-dum heartbeat movement that we all know love.
It seems to be that with Harmonic Price Patterns, especially the types looked at here, the XA is usually a summary of the impulse pattern, and the AB,BC and CD are the correction pattern. What makes Harmonics unique is that they break up that correction pattern using Fibonacci Levels to give stronger analysis, but essentially we are looking at the same thing, just closer up.
Does anybody here trade the impulse wave of Elliot Waves as well? Another trader I know trades the impulse waves but not the corrective waves, I can only imagine what could be possible if what is taught here was combined with what he teaches! We would be looking at the complete picture. However, there would probably be too many opportunities to trade though, which is why I think pattern traders tend to only look at one half of the cycle, either those trending waves or the harmonic patterns at the end of it. Thoughts?
Would love to do the homework and have tried. But neither my charts (candlesticks) nor all the lines i’ve drawn come close to the ones you have. And i have drawn lines between all crossings to try and match them up. What worries me most is that the candlesticks on my charts differ in length a lot compared to your chart, and yes i have chosen the right pair and time frame.
I think this has to do with me using a MT4 platform. Even when i did the same analysis you did on the EURAUD daily you posted earlier i did not get any convergence for the butterfly pattern 2.0 of XA. Price on my chart didn’t even touch the 1.618 level of the XA fib and i really used the same points as you did.
Does anyone have any idea why my charts are so far off compared with the ones TMB has? Does anyone else experience the same problem using any other platform than marketscope?
I need to try this on marketscope myself and see what is going on. I hope to be able to do it until monday so i can see if i’m doing things right or not.
Until then i wish you all a great weekend!
Edit: Just to give you an example of what i mean. Look at the lines i drew from some of the crossings and compare them to your charts. I don’t think my MA’s curves aren’t identical to yours. I’m using simple moving averages 8, 20, 200 (type: close).
Hope you are able to see the details in the attachment. I can’t find the error.
I also have a FXCM and Oanda demo account which i use with MT4. They show exactly the same charts with nearly no divergence at all so it can’t be that. I get the same results no matter which feed (broker) i use.
To get back to the EURAUD i found out what was wrong. I drew the fib from X and not from the MVA. When i draw it from the MVA price hits the 2.0 of XA.
Regarding your question i’m not so familiar with the Elliot Wave theory so i do not have any opinion to share at the moment. I have looked at some elliot wave analysis though like the one provided by elliottwaveforex.com and they are very accurate many times. So yeah, a combination of systems used of course raises the probability of successful trades. But for now i want to keep it as simple as possible for me and learn one thing at a time until i really can follow one system with “my eyes closed”. Then of course it is individual if you want to combine many systems into one master system but thats up to everyone to decide themselves. What all systems have in common is that they are based on the market moving in harmonic patterns/swing
If i look at the results TMB has with this trading system i do not think there is any need to make it any more complex as it is. It looks pretty profitable to me already.
Allright, let’s see. Now i did it on MT4 anyways and this is what i come up with. I guess the price levels of the crossings will differ a lot since my chart looks a bit different then yours.
Line number / Date (from- to) / Price (from-to)
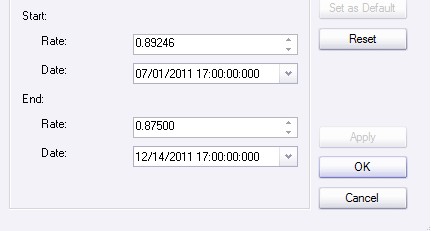
1: 2011-11-22 - 2011-12-04, 0.85737 - 0.85762 (This is the one i’m most unsure about, can’t find anything else to draw from)
2: 2011-05-10 - 2011-10-31, 0.88467 - 0.87184
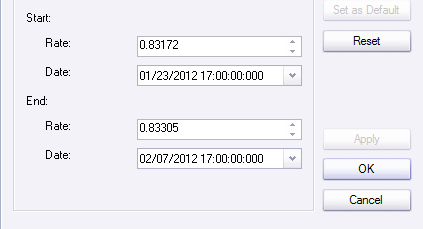
3: 2012-01-19 - 2012-04-02, 0.83046 - 0.83425
4: 2012-08-02 - 2012-10-29, 0.78337 - 0.80820
In addition where line 3 & 4 cross each other we have a 0.500 fib level when drawn from 0.80837 to latest swing high. The level at which these three come together has earlier been a major resistance level which price has tested 6 times and only broken twice since then (2011-12-29, 2012-01-27, 2012-02-09, 2012-03-12, 2012-03-28 & 2013-01-20). That should provide good support if price hits. And not to forget 0.84000 is a good institutional level at which the big players buy/sell which has a big impact on the market.
This looks quite similar to NickB’s method at forex4noobs. Speaking of combining patterns, his reversal price action trading semms like it would combine well with Fibs. Anyone tried?
Also what about the three drive system for trending markets in Trade What You See? It seems much more feasible to stick with just a handful of pairs when they are tradable with multiple systems.
This concept is curious to me. If the bank’s control like 70% of the market share, is what we are doing here kind of looking at a small picture when we really should be asking what the bank’s are doing to the market? There are those that claim that the bank’s manipulate the market so we should be watching them and trading with them… hmmm… sows some seeds of confliction within me
I haven’t read the book yet, finishing pips school. But it sounds as thought the 3 drive system is the first part of the elliot waves. If the book covers that then that is quite good, with the combination of that and what we see here, there isn’t too much need to trade too many pairs, although as we do here it is best to occasionally move to find symmetrical pairs to work with.
I really like to learn, but I do not even know what MVA is? Is it moving average? If yes, is it simple, weighted, exponential or what?
Can anybody point me where in this thread TMB taught us how to calculate MSRT and explained about MVA? All that I can find so far is 301 Moved Permanently" (I am not allowed to post a link yet), but even there I could not find any explanation about how to calculate those MSRT lines.
Somebody, please help me. Where can I find the post where TMB taught about how to calculate MSRT lines? Please point me to the right direction. I really want to learn.
The following Quote explains how I found the MSRT zones on the Eur/Jpy for my January Analysis. Please note that these MSRT zones are still valid for February and the concept can be applied to any pair and time frame:
[B]The to calculate MSRT zones you must have the following Simple Moving Averages (MVA’s):
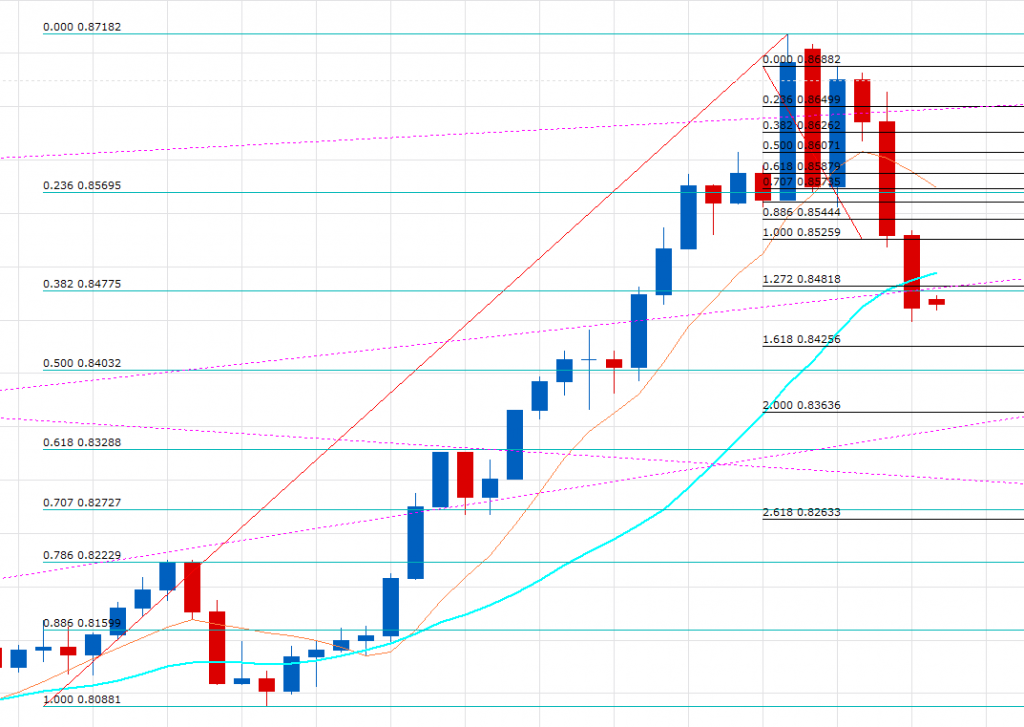
Here is what you asked us to do
Looking at the picture. You can see that, it is very similar to yours. The reasons behind this is, my chart is missing 1 or more candlesticks.
As I asked you before, but I have not gotten a response from you if you are using FXCM data. If you look at the top you have an extra candlestick for the holiday.
Ok, according to my chart here is the coordinate of those lines.