haha. the same as yours. but i took 15 pips.
Damn guys, i was just about to post a oportunity for you that i spotted on the hourly EJ.
A bearish gartley and a clear bearish RSI divergence (price making higher highs but RSI making lower highs). I just couldn’t resist the opportunity to enter short (going against what i said earlier). Entered the trade and was just about to start taking screenshots and price just took off before i even had placed a TP. So i’m ending the day with +100 pips after all and an account increase of 6% even though i don’t deserve it cause i broke the rule i set up for myself earlier (not to trade any more this week). This shows me what i have to work with since i seem to have problems with following my own rules. writing note to myself
Next time i’ll be faster in sharing something i find. 

I saw this one, but I dont like those fib level, so I ignore it  . But it respect high lower, and low higher trendline after it moved
Strange, i had a really good convergence there when drawing X from the hourly MVA. And the fibs were close to an earlier resistance which price was struggling breaching. The RSI divergence was just another strong indication a downward move was about to come. The times i have made trades based on an RSI/price divergence as confirmation it has proven to work out in at least 7 out of 10 trades (70% of the times). Anyone of you using that method as indicator/confirmation?
i dont use any indicator. All I use is fib level. I understand all the trend that TMoneyBags used. But I only use normal trendlines. I dont use MVA trendline. The systems is too over analysis the martket in my opinion, unless I got too similar to use it and dont take much time to use it.
Just hit my 30 pips profit for this trade in less than 15 minutes. And after my 30 pips. it looks like it retrace back down. so my target place at the right place
Congrats!!
I ment using theme as confirmation to the patterns. I would’t use them primarily to enter a trade either. I am looking for everything that can confirm a trade i am about to enter only.
I just missed this beautiful one while watching the GBPAUD. if it ever retest the convergence level. it will hit my sell limit that I just place.This is NZDUSD
it looks like struggle at the stronger resistant level right now and may pull back. but base on TMoneyBags rules, using visual stoploss. I close my trade now at around half of my stoploss point
You’re welcome. Glad to hear that.
Ok, I’m not 100% sure how I pulled this off, and I am certain I still don’t have the slightest idea how to place my own MSRT, but I was messing around with trendlines and the 3 MVAs that TMB was talking about using and I unknowingly used them as a trade indicator to pull in some pips this morning.
I saw a bullish butterfly just as it was converging, drew a few fibs to see that there was respect at earlier levels and dove into the trade. It bounced almost exactly off my initial entry and rose steadily. I was up 40 pips at one point but then it dropped down and tagged my stop at a still respectable 24 before continuing back up. Later, I go back to my long term chart and find that the 200 MVA is now acting as support, and converged exactly on the fib I was entering at.

I still don’t think I will be using all these other indicators in every trade yet, but I think I am starting to pierce the veil into the mind of the mad genius that is TMB and see that there are certainly other things in play. Whether it is worth the extra effort to increase the win percentage, I dunno, but it is worth exploring.
EDIT: I use ATR with D1 periods to figure out where to set my stops for a given pair. In this pick the ATR is set for the default period of H1. True ADR is around 300 pips for this pair!
EUR/JPY entered Long at the bottom of 125.115-124.843 a 4 hour close on/bellow this zone or a close past 124.747-124.677 convergence = exit. Conservative target = 125.5 target 1 = 126 target 2 = 126.5 and a break of the zone will push price towards 124-123.5.
In addition, entered long on USD/JPY at 92.897 where 261% cd converges with the .886 of XA on the hourly. Convergence range = 92.844-92.790. A break of this convergence is a excellent signal to exit all jpy shorts until further confirmation.
I shorted USDCHF, just wondering when I should look to exit. Is this still in a downtrend?? Using a fib it seems to have hit 50% retracement.

take profit!
Re-entering the EJ and now entering the EU long… for 30-60 additional pips
[B][I]
Posting analysis shortly…[/I][/B]
Don’t like current price action on the lower time frame closed out the buys with 10 additional pips and will wait for the 4 hour close and news to release before further continuation; If price retest the broken zones though I’ll re-enter the longs before the 4 hour close
close is good for the euro long, building positions slowly.
Hi TMB, are you targeting 126.5 on EJ now?
Current Closed Hydra Trades for EJ:
Current Closed Trade for UJ:
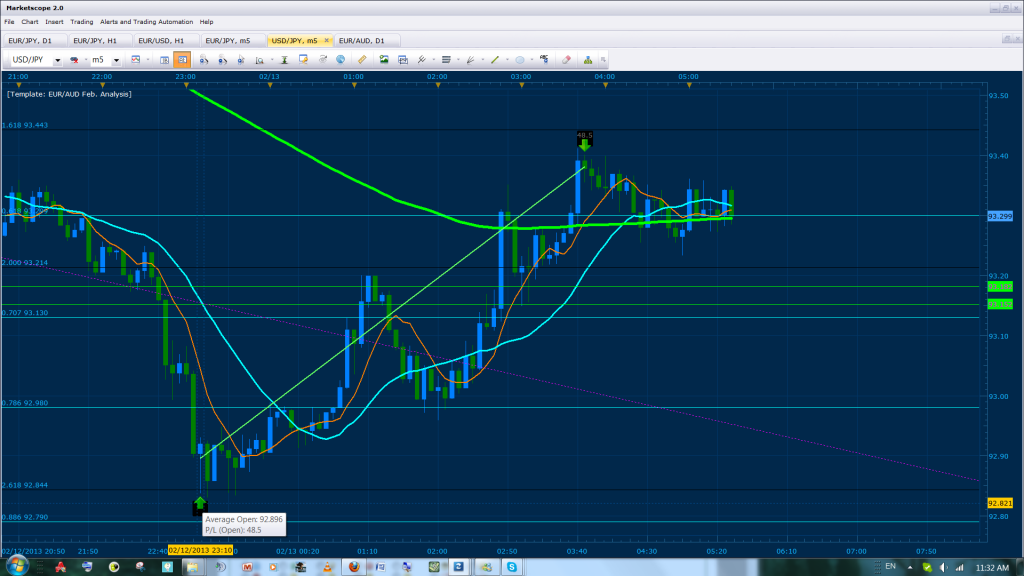
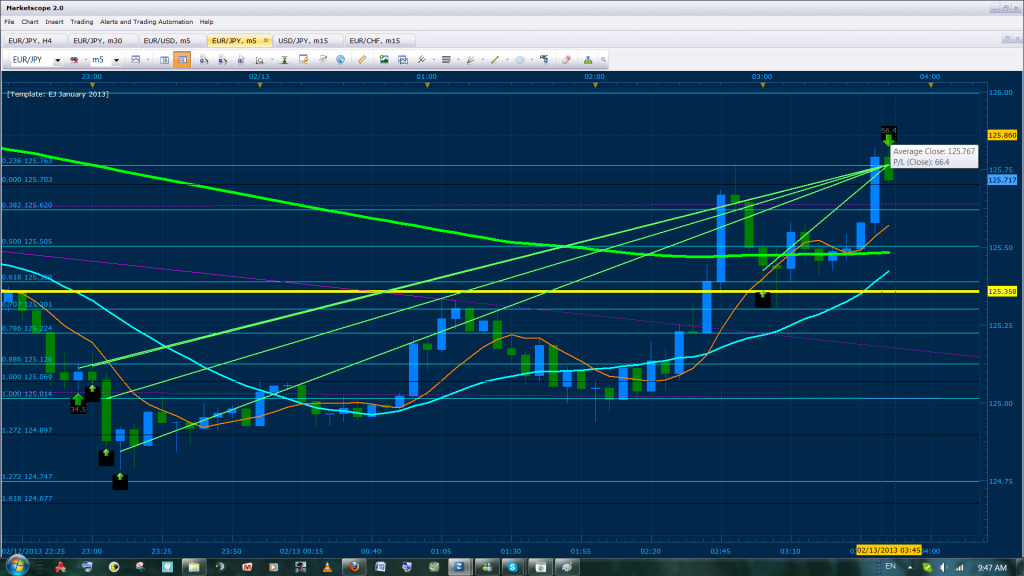
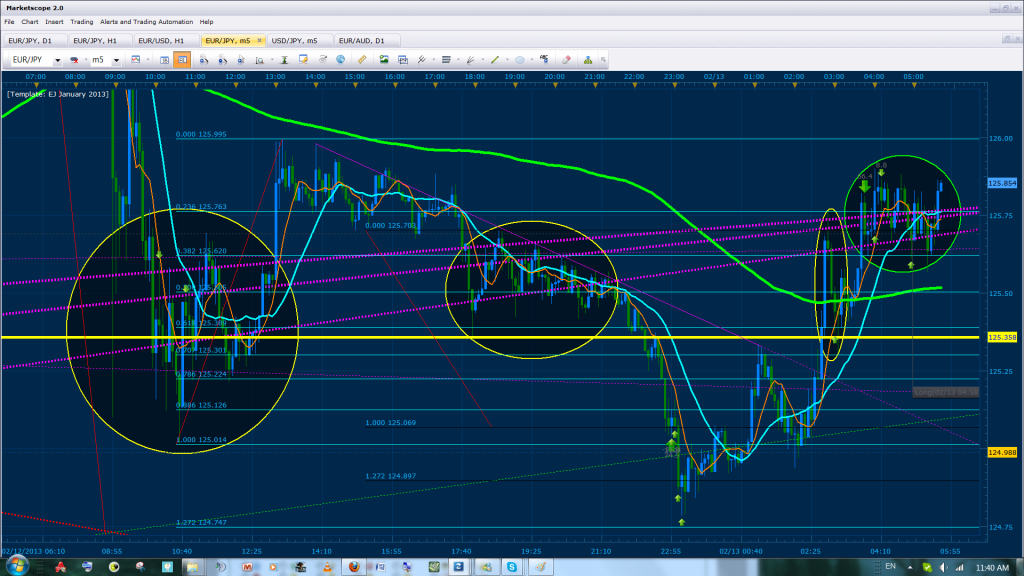
The chart bellow is of the 5 min EUR/JPY where we are re-entering positions based on previous analysis of the pair (see refer to the first quote on this post). The pink lines you see here are MSRT zones and the 4 hour has currently closed back above it. As you can see, I highlighted price action off these MSRT zones with the yellow ellipses to demonstrate how strong these points work in the lower timeframes and how price tends to flag at the touch of these points (Note the huge wick which was stoped by the MSRT during the first few bars of the chart… this was a 150 pip 1 minute bar!). In addition, the current MSRT zone is the bottom of the uptrend channel and when you combine this with current price action along with the EUR/USD analysis… well… expect major Euro strength! Anyways, price tends to push 175 pip average off this zone before slowing down and can even push price 250 pips further then that towards the top of the channel. In other words, expect price to reach previous highs.
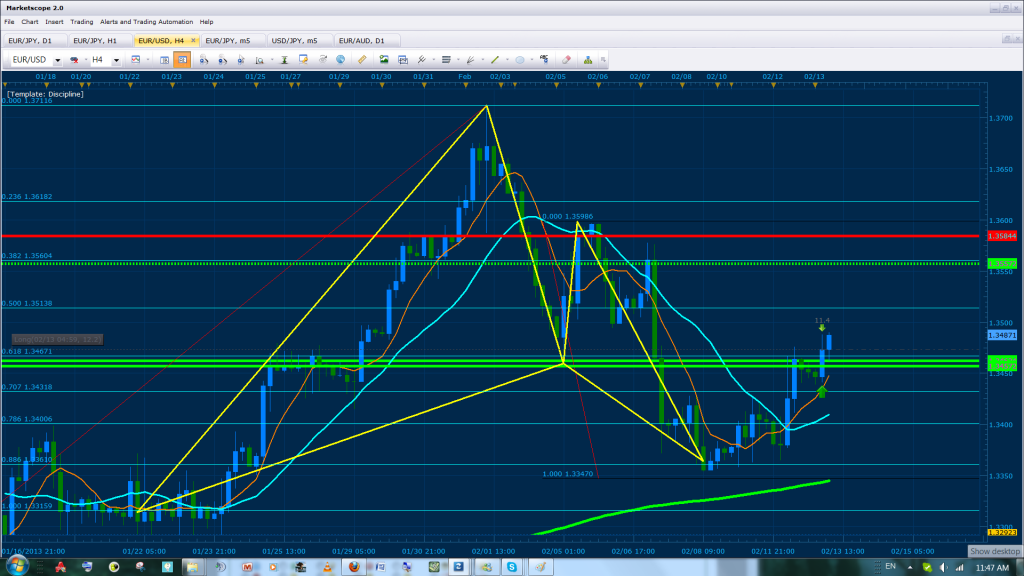
Bellow we have a bullish gartley which formed on the 4 and 8 hour charts of the EUR/USD where the .886 of XA when using the MVA average at 1.33159 of the 4 hour chart converged with 100% CD. The convergence lead to the halt of the first major pullback on the apir and caused a flag to break. The green horizontal lines are major support/resistance zones that are based of price movements (halts, wicks, base price, etc…); the break of these green lines can push price towards previous highs of the pair but we will be looking to take profit before hitting the first major resistance (Red Line). TP for the EU is represented by the dotted green horizontal line at 1.35572.