Well, the current area looks like a good entry for continuation which is why I added additional lots in the chart bellow… but I’ve decided to close for the day; 126.5 is a D point and major news is coming out shortly, it would be best to wait for the 8 hour close after the news comes out before entering into any trades; if you have profit take it! Anyways, I was very stressed the beginning of this week because I did not follow my analysis for the pair and put my account at risk (hence drop in equity illustrated by the graph bellow). But thankfully I was able to to recover and start the day fresh for my trades today :). Hope you all made good use of my signals today and I promise to keep you all informed of any further trades I happen to take. I’m done for the day, I do not want to overtrade the account and I really need to go out and chill lol.
I did take profit a while before I read your reply. Settled for forty pips. I work so was monitoring off my mobile. Still glad I scraped 40 pips though. Thanks TMB. Hope you recover your losses, am sure you will.
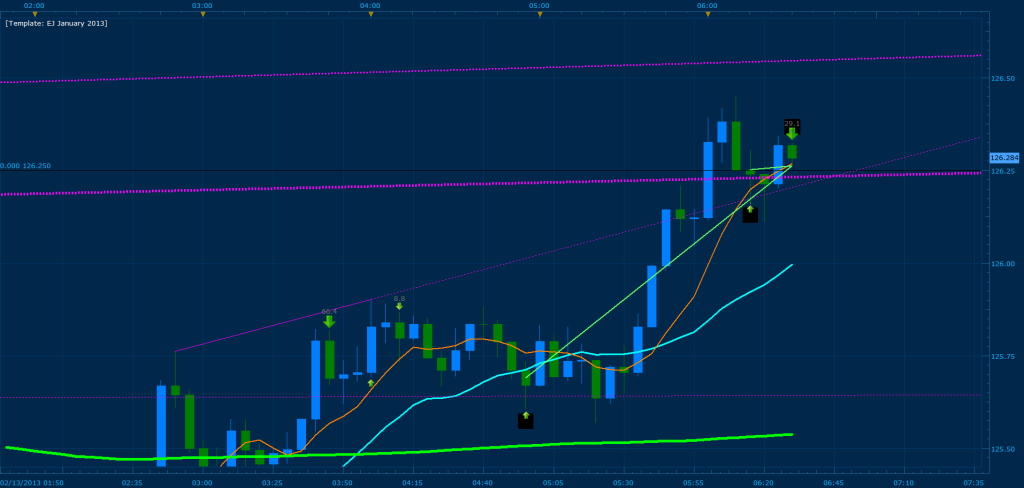
I like the close and retest the EUR/USD and EUR/JPY has done and I’m re-entering positions here at 125.653 for the EJ 1.34493 for the EU; TP will be for an additional 30-60 pip bonus (Even though I see the pair pushing further) the retests includes patterns that have developed as well (feel free to post them if you see them )
Incredible and unbelievable results TMB. I’m very impressed. Really well done!
I wish i would have been able to follow your posts today in real time but my work took every single minute of the day and the rest of the week won’t look much different so expect very little participation from my side this week.
Thank you for putting so much effort and time into making those posts for us, they’re great learning material!
I had 10 minutes to take a look at the market, found 2 bearish gartleys on the eurusd and on the usdjpy. I liked the setups, placed 2 limit orders and the result is +32,5 pips so after all a positive trading day.
Ooops, caught my self over trading I have no reason to be in these markets after such a good day anyways lol… scalped 15 on the ej broke even on the eu. Have a great day!!!
Haha, yeah i noticed some extra activity on your part here today.
On the longer time frame we are closing in on a nice support area on the weekly GBPUSD. Do you agree that it could be a good idea to monitor this one?
The pair has shown many good patterns over the last 10 months. I thought it could be interesting for us who not are able to day trade as much and a good opportunity to catch a bigger trade on the higher time frame. Even in a day trading perspective good patterns could form at that support level.
Hey Diablo, I’m watching GBP on the 8 hour charts. That’s a good catch there, but it looks like a hit may be some time away. In the short term I’m hoping for a bounce off the black line you have there and will try to catch 30 pips off that.
Been away for a few days and its great to see how much activity there’s been in the thread these past few days!
As always TMB thanks a million for your time and effort!
I really enjoy studying your MSRT technique and hope to master it at some point =)
Diablo, I know you are using Meta trader as well, have you figured out why there is such a significant difference between its candles and Marketscope?
I’ve been trying to draw up my MSRTs like TMB but they just never get to the same point in MT4. I do have an fxcm demo account to compare with but honestly I’d rather analyze and trade in the same platform. Feels like a big gamble since in many cases I don’t even have candles present at some places where TMB’s graphs do.
Anyway, hope you are all scraping home heaps of pips!
The black line on my chart is simply the actual price line and nothing i added myself. Just had a quick look at the pair and no time for further analyzis. But i think we are approaching a very interesting area and if price continues its movement at the same pace we can expect it to hit that area in 1-2 weeks. Deffinitly a case for more detailed analyzing i think.
No i havn’t figuered it out yet. I still see difference in price movement on the charts posted in here compared to mine. But if have had a few good trades in a row now showing me that analyzing and trading only on MT4 works good as well. But i think i will be switching broker soon and FXCM is high on my list for a new broker.
I drew the MSRT on my chart and posted the coordinates in here. TMB used them in marketscope to draw lines. Well there is a difference as you can see in the resulting charts TMB posted. And i think only small differences when drawing the lines have a huge impact the longer the lines are. BUT i think it works in conjunction with the difference in price we see when comparing the output from different platforms with each other. You only see a difference when using input from one platform and putting it into another, if you understand what i mean?
I’m a bit to tired for writing now. It has been an awful long and stressy day at work. C ya all tomorrow!
Hmm, I have it as a minor support line. Like I said, it’s mostly for scalping 20-30 pips, not large movements. I have a buy target at 1.5645, will see if it rebounds to that level.
TMB, thank you for posting your trading system and daily analysis here. They are very useful, especially to somebody new like me. I am still not trading with real money, but by studying yours, surely I can learn much.
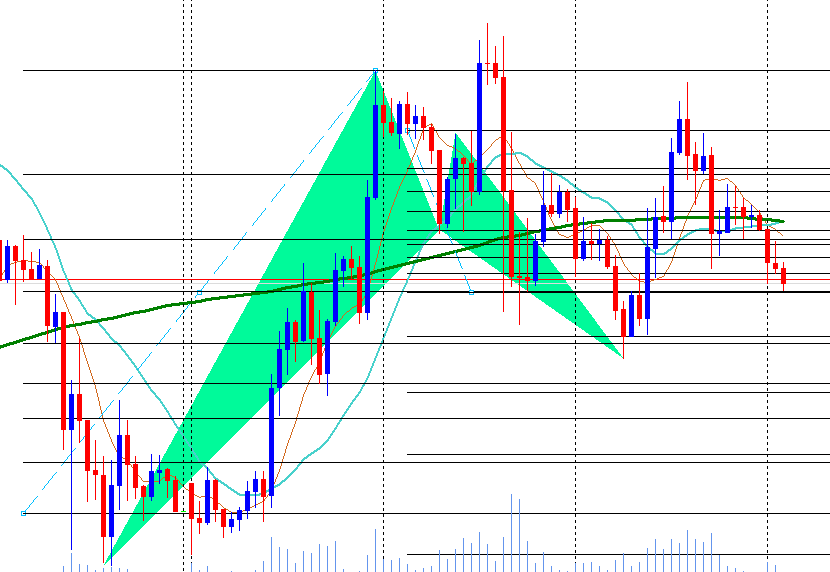
I saw this post, but I didn’t enter the trade since I didn’t produce the pattern before it move up. But when I try produce the pattern here is what I got
Is this the pattern that you trade for EUR/JPY? So, it is still a valid pattern even though the following peak is higher than A and C?
I don’t think so. According to TMB in his post here, the 126.5 is the D point. So, if I understood it correctly, the ridden rise from 125.15 to the targeted 126.5 was from C to D.
Sold the EUR/GBP at .86461 and .86484, Purchased GBP/JPY at 145.234.
The Pound has reached the extremes of price and on the EUR/GBP has retested one of the MSRT zones that I analyzed with you guys. I expect the pair to push a minimum of 100 pips and am building hydras towards each respective targets.


 )
)
 I have no reason to be in these markets after such a good day anyways lol… scalped 15 on the ej broke even on the eu. Have a great day!!!