You’re more than welcome merper. Tell me if there is anything i can do to help you see the patterns more easily. Just continue searching for them and all of a sudden you will see them everywhere you look. 
Oh, I see them all over the place, in my dreams sometimes.  The only problem is they don’t complete where I expect them to. :17:
I need some other confirmation indicator, a move to 4H timeframes, or perhaps just knowledge on how to read price action better.
Thats great!! After starring at the charts for a long time on the weekend i find myself drawing them in my dreams as well, haha! 
Yeah, try to find som filters and confirmation methods and backtest them to see if they work for the patterns you draw. Definitly a good idea.
Thank bro.
Just got time to look at it. It is great help here.
I’m struggling on where to draw the second lot of fib levels from, can anyone help me
If you go to page 778, diablo outlined the basics of the Gartley, with X A B C & D points. The first set of fibs comes from drawing the fib line from X to A. The second lot comes from drawing the fib line from B to A. Then you take this line and move it so that the 0 level is at C. The closest intersection between the two sets of fib lines - after the price has reached 1.00 of the fib you drew from B to A - should be the D.
Ok, I’ll try to post more of the charts I’m tracking here to see if they match up with the rest of y’all. I’ve ruled out every chart with an ADR less than 100 pips, and I see no patterns on the 1H yet. Here’s a 4H bullish gartley I’m tracking on the EU-USD.
Interesting. Would you be able to expand on how you get familiar with the movements of the pairs you described? Is it just behavior at certain S + R levels, reactions to fundamentals news or something else?
If I were to go back in a pair and start manually searching for historical patterns, which pair should I work with do you recommend?
I would definitly recommend one of the JPY pairs. EUR/JPY is a pair that has been respecting fib levels pretty much, developed one gartley after another and is the pair included in most of TMB’s posts in this thread.
Try to go back on a 1 hour time frame and search for patterns. 
EJ Flag at 125.358 is breaking my shorts are at 125.410, close above 125.5 should be exit… current development can push for 130+ pips. See any similar setups?
Hey everyone!
I haven’t had much time on my hands this morning. Just looked through some of the pairs real quick.
Found a possible gartley forming on the EURUSD 1 hour chart.
The reasen i say possible is because we have no clear C point yet. There is a potential CD leg starting to form. If price does not go below the point i’ve used as C below then we have 2 good convergences, 1.272/0.5 & 1.618/0.618. I would prefer the 1.618 and 0.618 sind that is a “golden” fib ratio which is respected more often than others. In combination to that both levels on which we have a convergence show signs of beeing a support/resistance level if you look to the left. So in this case the earlier price structure gives us clues which should be a good confirmation.
I think both convergences are tradeable but i will go for the 1.618/0.618.
If price goes below 1.33244 just ignore this post/possible trade. 
Have a great trading day everyone and good luck. I’ll be back in the evening (+10 hours). 
What do you mean? I took long position at 125.441 and currently at around 7 pips profit. Do you mean it will go higher up to 130 pips?
Short EUR/JPY, Short Euro pairs… posting analysis in a few minutes.
Oh, okay. I have closed the trade any way, losing 5 pips, demo account 
Hey man,
Well you will notice that the more time you spend with a pair, the more you start to learn it’s character, movements, fibs it respects etc etc… For example, the EURUSD and GBPUSD trades drastically different from each other and I’ve learned that where EURUSD likes the 50% pullback, the GBPUSD likes the area between 61.8% and 78.6% much more… these little things come up the more you spend time looking at the charts of a pair.
Now, this isn’t crucial for success but it sure has helped me a lot. And again, it reduces the load on my because if you can focus with proper attention on one or two pairs, you need no more. Just take a look at what TMB has accomplished!
Hi TMB, that must have been on a very small timeframe? Looking forward to your analysis.
Ah, spotted the Gartley on 5min 
The Euro in the majority of the pairs has reached exhaustion levels, broken its bullish channels and retested for the reversal. Currently on the EUR/USD, price has flagged for the past 12 days and is in the process of forming shooting stars on the higher time frames (weekly/monthly). Depending on continued development from this zone, expect two of the following scenarios: Full Reversal towards 1.29-1.28 of price or Break back above 1.34 and Bullish push towards 1.38-1.44 of price. All in all, we have reached a critical point in price for the euro and because of its exhaustion across the pairs and current bearish development, we will focus on the bearish setup ahead (trade what you see).
Bellow is the daily EUR/USD where price has been hugging the .382 of XA (x = bottom of 8 hour MVA curve at 1.27086) converging with 100% CD. Note that price initially respected this bullish convergence but then reversed to form a shooting star. The fact that price almost reached the .500 of AD and then closed bellow the .382 of the daily indicates that the top of a bearish channel has been defined (Inverted Hammer, gravestone doji). In addition, this development signals that because price closed bellow the .382 that it will push towards the extention levels of CD (meaning we have an 80 % chance of reaching the 127%-261%CD levels); this information is coming from the first swing illustrated by the highest yellow rectangle. The red lines are daily MSRT zones and price has currently closed on the daily bellow 2 of the 4 that I have drawn. The orange horizontal line is also considered an MSRT where price has closed bellow the point. The yellow line that you see on this chart represents the neck of a head and shoulders that has formed and broke towards its target, illustrated by the green horizontal line that lands on top of .707 XA at 1.30025 of price. The green rectangle that you see here is where I expect price to reach if the final MSRT is broken (lowest red trendline).
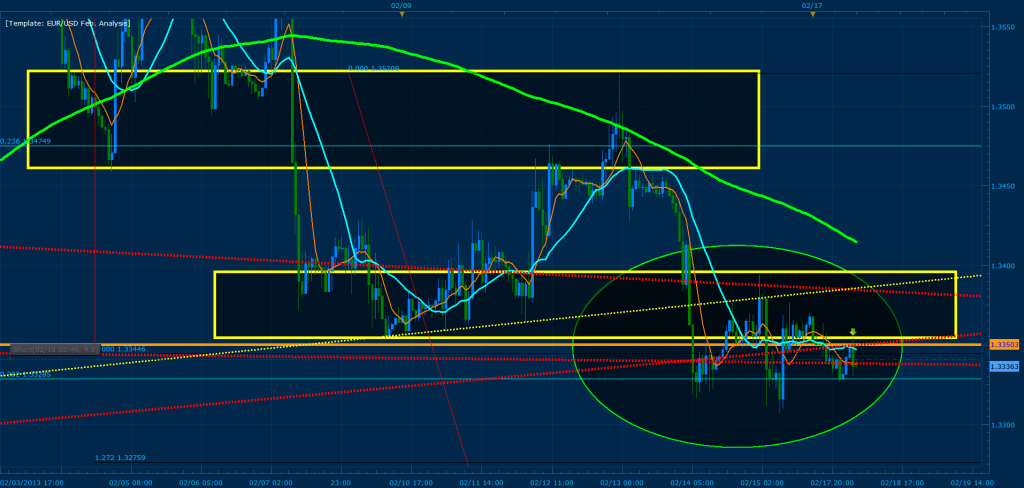
Now, lets zoom into the 1 hour of the previous daily chart analysis. The two rectangles illustrate the first two swings of the daily; I have drawn them so you can see that price has already confirmed both BC points by breaking bellow them. In addition, the green ellipse here illustrates current price action in relation to the breaks of the MSRT zones, retest of the the second BC swing and break of the head and shoulders with a 400+ pip apex (yellow trendline).
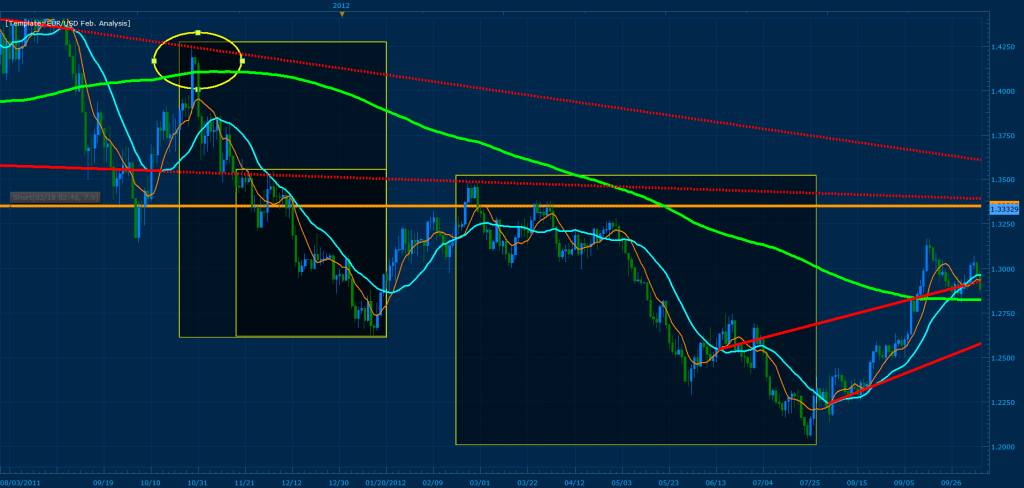
How powerful are these MSRT points we are breaking??? Well if you take a look at the chart bellow, you will notice that one of the MSRT points was responsible for stopping a sharp euro bullish trend that reversed price from the 1.42 zone (illustrated by the yellow ellipse at the top left). In addition, the reversal was strong enough to push price towards the extremes of 1.20. The second MSRT illustrated by the smallest box worked as a continuation and retest point for the bearish movement.
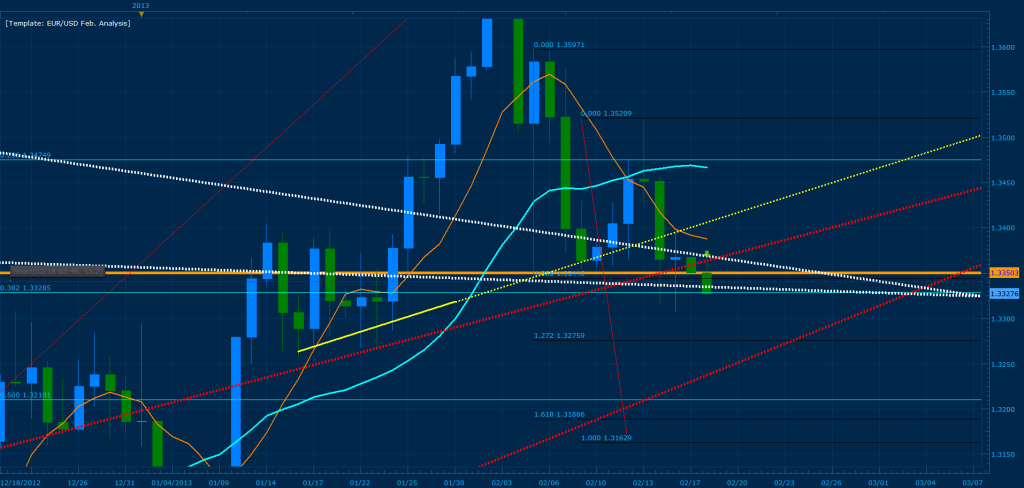
Where are these powerful MSRT points currently??? I’ve changed the color from red to white on the daily chart and zoomed in so you can see current price action at work:
Have comments on my analysis? Want to share more? Be my guest and post with a reply towards this analysis.
Added final lots for EJ bearish setup at 125.660, Exit is 30m close above 125.946. Entries for the hydra are based on developments of the higher time frames for the pair in combination with breaks and tests of the 5 min chart. Target 1 for the EJ is 124.000 Target 2 is 122.777. Today Is a bank holiday, so be careful ;)…


