So let me get this straight. bats are when the B is kinda inbetween two points?
are bat setups reliable in your experience Diablo?
If we take a bat pattern as example the AB retracement has to hit the 0.500 fib level to be valid but not hit the 0.618 level.
If the retracement has hit the 0.618 level it can no longer be a bat pattern but a gartley instead.
If the retracement has hit the 0.786 level it can no longer be a gartley pattern but a butterfly may be forming.
Google all the patterns and you will find the retracement levels for each pattern.
To be honest, all of the bat patterns i’ve traded for the last weeks have worked out the way they should. I’m working on a sheet with success rate of each pattern and time frame but it will take some time before i will share it. I want at least 100 trades in it before i can come to any conclusion.
The best thing in my opinion is that bat patterns give a great risk/reward ratio. First you have your pattern that statistically should work out in your favor. Then you have the X point acting as support level if the pattern is not respected. It’s like a safety net for your trade. If your first level fails the second “support” will catch the price so to speak.
Above that, if you place your stop a bit above/below the X point, thats not many pips from the 0.886 level of the XA which means you have a much higher reward rate, of course depending on where you choose to place your TP’s. But compared to a gartley you have 1 fib level less of risk with a bat pattern when your stop loss is placed above/below the X point.
well, It can be considered a bat, but this is subjective…
In my opinion, the price reacted to the 61.8 lvl, (price reversed at less than 5 pips from 61.8). I think most of us, you included, considered the price to react from the 61.8. If you consider that price reacted from 61.8 lvl you can’t consider it a bat. This is my interpretation, but it can be a bit more complicated…
about bat:
"The pattern incorporates the powerful 0.886 XA retracement, as the defining element in the
PRZ. The B point retracement must be less than a 0.618, preferably a 0.50 or 0.382 of the XA
leg. The most ideal B point alignment is the 50% retracement of the XA leg. The B point is one
of the primary ways to differentiate a Bat from a Gartley pattern. If a pattern is forming and the
B point aligns at a 0.50 of the XA leg, it is likely to be a Bat."
About gartley:
“The exact 0.618 B point requirement was just one condition in this interpretation of the
structure.”
“It has been my experience that anything less than the ideal Fibonacci alignment for the
Gartley usually results in “deeper” corrective structures, favoring a Bat pattern completion.
Although this strict application of the Gartley alignment reduces the number of pattern
matches, it is critical in identifying valid patterns and effectively differentiating these two similar
structures.”
"As with all harmonic patterns, the specification of Fibonacci points within each structure is
extremely critical in determining valid trading opportunities. The Gartley pattern exemplifies
the necessity of such specification, as the structure frequently resembles a Bat pattern as it
completes."
from the book “harmonic trading volume 1”(this book is worth its price), by Scott Carney. For those who dont know this man, he is the creator of bat-crab patterns, and the guy who established the fixed ratios of gartleys and butterflies.
So yes, let say this is up to you and what you understand for a “precise 61.8% B point”. personally i consider a retracement at 3-4 pips from 61.8 in the eurnzd h4, a “precise B point”, so i consider it a gartley.
Of course it is subjective. In this case price did exactly what i expected a bat pattern to do, bounce of the 0.886 level of the XA fib so i am happy with the result.
I would say everyone should make their own decision about this and use backtesting to confirm their patterns and with that also their trading plan.
In my backtesting i saw a lot of patterns work out the way i describe and until other backtesting on my part says otherwise i won’t change my strategy. I’m only sharing my point of view for inspirational purposes and i’m glad your sharing yours.
Edit: Sorry for sharing my opinion in a way (phrasing used) that made it sound like a stone cold fact which it is not. It’s like the bible, everyone can read something else out of it. As long as you are happy with what you see and it works for you, why change it.
by the way guys, this pattern that i’ve posted is really starting to take form if anyone wants to go take a look. I believe the C has now formed and if nothing happens to invalidate this pattern then i expect the D to hit in about 50 minutes.
same
Rereading my post i realized I should have quoted the modo post too, as i was not referring only to your post, but to the possible discussion about if this could be considered a bat.
I’m not saying you are wrong, I don’t even disagree with you. I just quoted what S.Carney says on his book to give an other point of view about this, wich i think that confirm both interpretations of this pattern.
barley any movement in the market at all. the C has formed, the results of the bank stress tests are in …but the market is hardly moving. maybe too much people have gone home. afterall … the stress test results did come in after most people had gone home from work for the day
It seems the EURNZD has no intention to form a cypher at this point. But hey, i’ve entered the trade, my stops and take profit points are in place, so either i get stoped out or i will walk away with some profit after all. Thats the great thing about having a trading system that completely removes emotions from the ecvation.
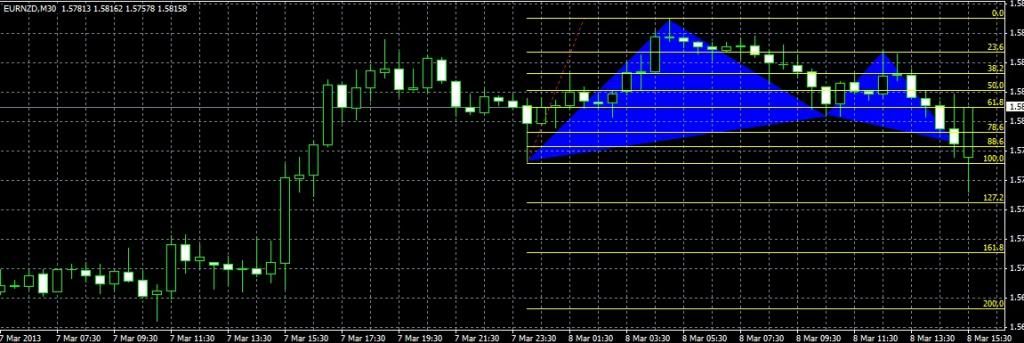
[QUOTE=Diablo1505;466503]It actually was a bat pattern since price never touched the 0.618 level. It’s a bat until it does not touch the 0.618. If it would have done that it would have been a gartley and thats why i thought it was a gartley the first time. But as you can clearly see in the pic below it never touches the 0.618 of XA and then never closes below the 0.886 of XA forming a beautiful bat pattern. Even if the bounce below the 0.5 level of XA (B) can be confusing. It got me the first time.
I see, I thought you must have been using the previous retracement. I would like to see bat retracements much closer to 0.382 or 0.50 XA, so would see this as a gartley/crab due to proximity to the 0.618XA, desptie the fact that it didn’t touch. But hey, the proof is in the pudding, you made off like a bandit, so congratulations Diablo.
We never know where the market is going. Actually no one does. We cannot predict or move the market. Else there would be traders who have a 100% success rate and don’t have one single failing trade which i do not think exist.
But what we can do is to enter trades that statistically have a high probability of success. And how do we get that? Backtesting our strategy. Without backtesting we can only guess or use other peoples opinion for our trading plan which in the long term is risky since we never do or trade exactly the same way as the trader we got the info from which lowers the success rate drastically.
So we have to create our own trading plan that fits our personality, choose a system for that plan and then backtest it to see if our plans really have a high probability of returning consistent profit. If not, tweak it or add/remove something until your backtesting shows that you statistically will be profitable.
And since we are on a bat pattern trip right now. Here’s another one on the USDCAD, 15 min.
Market is in consolidation on the higher timeframe which is good for pattern traders like us. Even though i hope that this market will continue down since i am also in another bearish trade on the USDCAD, daily (bat pattern also).
Hello all. Quick question regarding how you draw the patterns. After watching TMB’s vids and seeing everyones chart art, can I assume your trading more the convergence of fibs levels than “traditional” harmonics? One particular thing I’m confused with is the method of which some are finding point D. I was under the impression that point D was the fib extension of leg BC. But from what I saw on TMB’s vid and everyones charts, D was found by measuring AB and then extending it off of point C. I really want to understand the idea behind this. Can anyone shed some light on this? In the past I’ve only traded harmonic patterns that fit nicely into the typical harmonic framework.
I’m in the process of using harmonics more in my trading. Especially if it can bag me 30 pips a day. Hell, I’ll be quite content with 30 pips every two days.
I noticed this pattern as it was almost set to complete at D. I was thinking to myself this is gonna go down in the next 5 minutes so I had no time to post it here unfortunately, i quickly drew my fibs from B to C …then noticed it had 100% convergance with the 78% of XA so decided to jump in with a pending buy order at that price.
as i was so rushed i had only made a rough estimate of how much money to risk …and then i realised i was risking like 25% of what i usually risk …so much less potential profit. oh well, too late now. D had hit and then i took the low of B from the high of A, and the difference between them i took away from the high of C and this is another way of telling me where D was due to hit and it was NOT on the 78th fib, but almost at the 88th fib.
Now normally i wouldn’t do this, but as i was risking only 25% of what i usually risk i decided to move my stop loss in accordance with what my calculations were telling me. good thing i did too as D breached the 78th fib and ended up going just below the 88th fib but i had anticpated this so my stop was just a little lower than it.
then price bounced back up almost to the 50%. it exceeded my take profit by just one. but my platform was very slow to realise this and 40 seconds later my trade suddenly closed for about half the profit it should have as the price had gone back down by then. about 20 seconds later the price plunged right down to the 127% in one almighty move and then back up again… so i am lucky as my stop loss would have been taken out.
*to the user wanting to know how people here are calculating D, i do not mind going into more detail about how i personally do it but i’ll have to do it sometime later today…
I took the EURNZD cypher trade as well, and it hit my target after going in the negative up to 30 pips, but got 62 pips out of it. Hopefully your target got hit before it turned back up.
The idea behind this is that most ABCD patterns (gartleys, butterflys crabs, bats and them variations) have an ab=cd pattern inside them.
Measuring AB and then extending it off of point C we are looking for an ab=cd or an extended ab=cd pattern.
in resume, If the CD leg is shorter than the AB, the pattern is considered invalid. In some patterns the 127,2 extenion of cd leg (1,272AB=CD) or the 1,618AB=CD can be considered the most important levels we should
look at.
Hope this can help you understand the basic idea behind the system. I wish you good luck with harmonics
Yes, it really pays off to be patient. Even though the pattern was not respected as planned price went down after all since SL was not to tight…
Banked 69 pips since TP 1 got hit, moved my SL to break even. TP2 was missed by 3 pips and then i got stoped out on my second position. But hey, +69 pips is a nice way to enter the weekend with.
what is the difference between a Cypher and Gartley.
I traded it, but only got a small amount of profit on it due to rushing things and using only 25% of what i would normally risk, and also due to the fact that my take profit got exceeded by just 1, and it took my platform and eternity to realise this and kick in, and by then the price had gone back down a noticeable amount so i got half the profit i would have got had it took the take profit when it should have
and did you guys know the price would go right to to 127% of XA?
Thanks Senor Paw for the clarification. After playing around a bit on the charts I also realized 100 and 200 extension converging with XA fib retracement (78,88,…) seem to be quite strong.
Wow found out what all the excitement was about with the EURJPY. Scalped 45 pips off it today on the 1 min chart using harmonics. Not the timeframe of choice for me personally, but the amount this pair moves why not.
B has to be a retracement of 0.382 or 0.500 of XA (kmust not touch the 0.618 fib level)
C has to be an extension of XA by at least 1.127 but not more than 1.618 (not allowed to touch the 1.618 fib lvl)
D is always a 0.786 retracement of XA