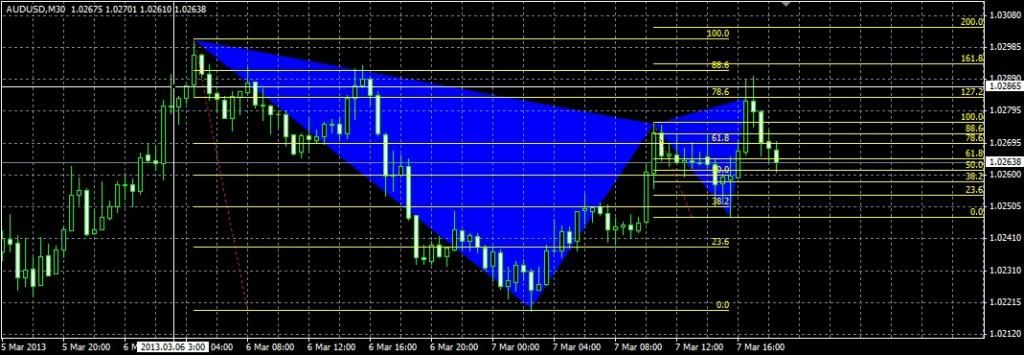
I am a bit gutted as the gartley did infact go back to the 50% line after violating the 78.6 fib line almost to the 88fib. ok, next time if i see this sort of setup i’ll be equipped to trade it hopefully.
BTW, At the time of writing I do think the price will come back up and Peirce the X line, and maybe go all the way to 127% of XA at around 9PM GMT, so if anyone is interested then do your own calculations and draw your own fibs and decide if you want to go for it
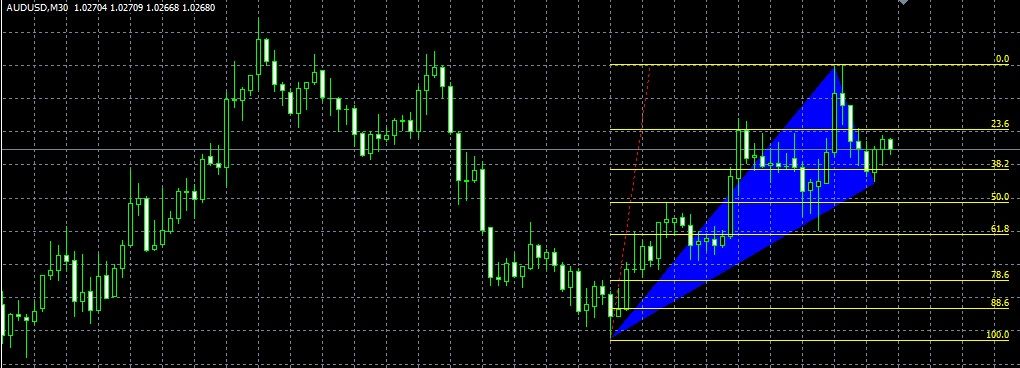
There’s a bullish AUD/USD gartley that I’m tracking. It’s still early as the D leg hasn’t gone past the B point yet, but it’s a pattern that I’ve seen a few times recently on the AUD/USD.
On another note… I had a horrible trading day yesterday, and I take 100% blame because of my lack of confidence and emotions. The truth is I perfectly picked 3 trades yesterday, but then once the trade was in place I started to doubt and started moving stops… 2 of the 3 trades resulted in losses, 1 of them big, and the other trade resulted in a much smaller win then I should have encountered. Had I just left my stops where I originally placed them all of the trades would have easily hit the 30pip targets… lesson learned (I hope).
It actually was a bat pattern since price never touched the 0.618 level. It’s a bat until it does not touch the 0.618. If it would have done that it would have been a gartley and thats why i thought it was a gartley the first time. But as you can clearly see in the pic below it never touches the 0.618 of XA and then never closes below the 0.886 of XA forming a beautiful bat pattern. Even if the bounce below the 0.5 level of XA (B) can be confusing. It got me the first time.
Price has spiked above the 0.786 but it seems like the market has reached exhaustion. RSI is overbought as well.
And above that as you can see cypher patterns tend to form after another advanced pattern has completed like in this case which raises the probability of a successful trade.
C is still forming and could be invalidated if it moves above 1.0302, but if price moves below 1.0220 then I’m going to look for my trading opportunity. Also I guess technically this is a bat, not a gartley.
Nope, you’ll have to zoom out quite a bit more to see the analysis I drew. My X is at 1.01165 on 3/4/13 at 2:00 GMT. My A is at 1.03023, B is at 1.02204, and currently I have C at 1.02906.
Ah, ok. I have plotted it out now with those points to see what you are describing.
to me it looks like the price is not respecting the 38.2 fib that much? It has closed somewhat through it several times before it eventually went back up, i’d be cautious perhaps
hmmmm … im tempted to want to go and trade it myself lol.
do you know how to calculate D on the bat patterns? one of the ways i calculate gartleys is i draw with my fibs from B to C and the 127% of that is usually where D will land and I watch for convergences with the XA fib levels before deciding I should trade it.
would I be able to work out the D’s for bats in the same fashion?
well, It can be considered a bat, but this is subjective…
In my opinion, the price reacted to the 61.8 lvl, (price reversed at less than 5 pips from 61.8). I think most of us, you included, considered the price to react from the 61.8. If you consider that price reacted from 61.8 lvl you can’t consider it a bat. This is my interpretation, but it can be a bit more complicated…
about bat:
“The pattern incorporates the powerful 0.886 XA retracement, as the defining element in the
PRZ. The B point retracement must be less than a 0.618, preferably a 0.50 or 0.382 of the XA
leg. The most ideal B point alignment is the 50% retracement of the XA leg. The B point is one
of the primary ways to differentiate a Bat from a Gartley pattern. If a pattern is forming and the
B point aligns at a 0.50 of the XA leg, it is likely to be a Bat.”
About gartley:
“The exact 0.618 B point requirement was just one condition in this interpretation of the
structure.”
“It has been my experience that anything less than the ideal Fibonacci alignment for the
Gartley usually results in “deeper” corrective structures, favoring a Bat pattern completion.
Although this strict application of the Gartley alignment reduces the number of pattern
matches, it is critical in identifying valid patterns and effectively differentiating these two similar
structures.”
“As with all harmonic patterns, the specification of Fibonacci points within each structure is
extremely critical in determining valid trading opportunities. The Gartley pattern exemplifies
the necessity of such specification, as the structure frequently resembles a Bat pattern as it
completes.”
from the book “harmonic trading volume 1”(this book is worth its price), by Scott Carney. For those who dont know this man, he is the creator of bat-crab patterns, and the guy who established the fixed ratios of gartleys and butterflies.
So yes, let say this is up to you and what you understand for a “precise 61.8% B point”. personally i consider a retracement at 3-4 pips from 61.8 in the eurnzd h4, a “precise B point”, so i consider it a gartley.