Ahh!! AUDCHF trade stopped out. I thought the overnight aussie news was going to help this pair head further south. I guess I shouldn’t try to predict the news. It’s looking like bat morphing into butterfly or crab. In this case with the shallow retracement of XA would it be right to assume price will try and reach the 1.618 (converging with 261.8) extension to form a crab or will the more tightly converging 127 (converging with 200) level be the one to watch for. Any advise we would greatly appreciated.

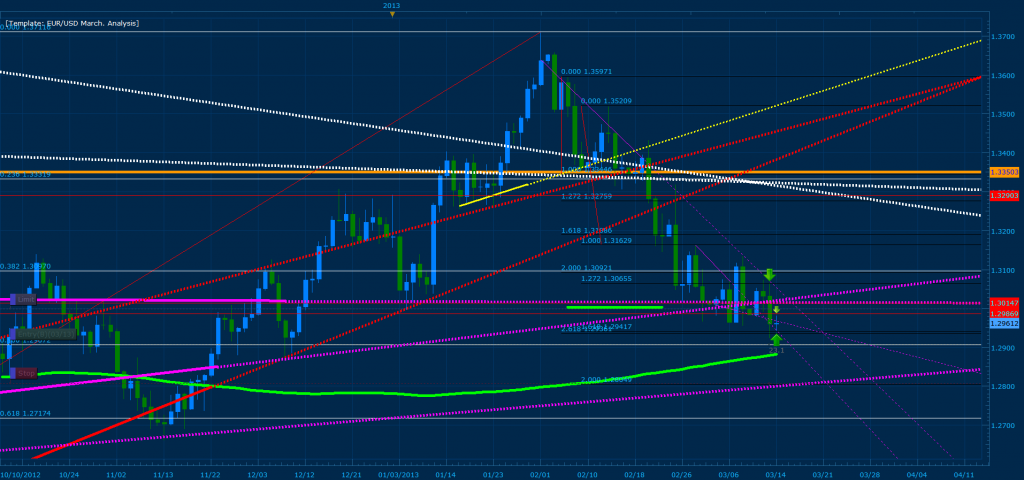
Hello all, our EUR/USD Analysis from February worked out flawlessly and now we have finally reached the projected targets from last month (Click blue arrows on quote above to review analysis). Recently, we have reached a few major D points in price where the 261% of the first swing on the daily converges with .500 of XA (X = 1.21028) and 161% CD of the second swing. On the chart bellow you will note that price has reached the convergence point and has temporarily stalled the bearish down trend to flag for a reversal and retest of the MSRT Breaks (White and Red Lines where price broke and plunged from last month). If this convergence area works, we should expect price to push back towards the 1.33 range and consolidate again within the MSRT zones. Currently though, price has broken the flag to continue the bearish down trend with the break of the pink MSRT zones you see at 1.30147 range of price. In addition, yesterdays bearish candle close indicates that the D point that was hit may be a fake out and price should continue pushing towards the next MSRT zone (Bottom pink line).
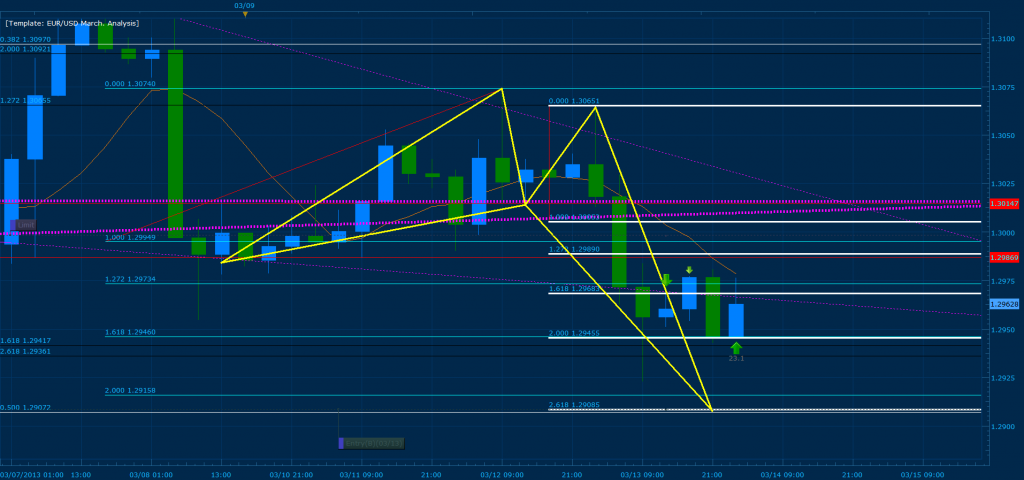
Bellow we have a butterfly pattern developing at the .500 of the daily XA from our previous daily chart (this is the 4 hour chart). here 261% CD converges with the 2.0 of XA of the 4h and looks like an excellent D point for the start of the reversal.
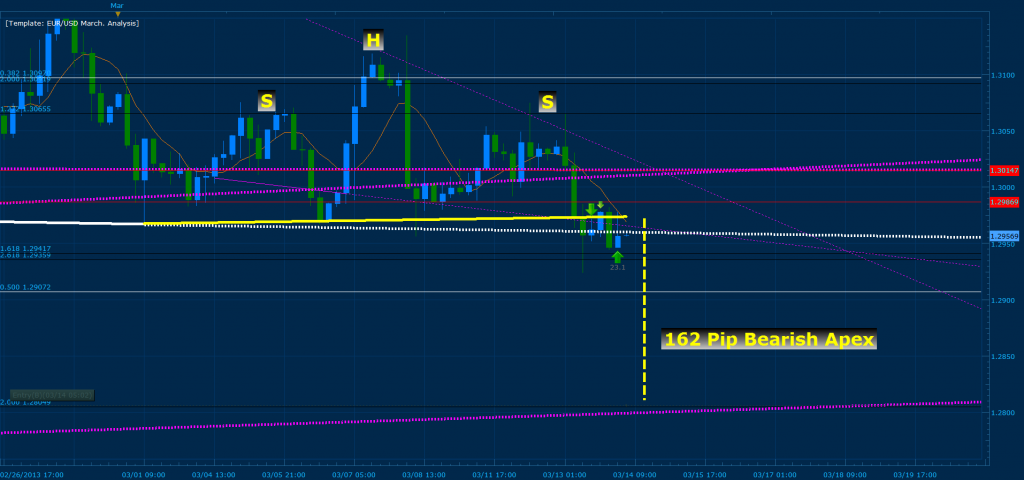
Using the same 4 hour chart from above however, we also see that price has broken a head and shoulders on the 4 hour right on top of the D convergence zone; indicating that price should drop 162 pips further before reaching resistance. “Coincidentally” though, the apex lands right on 200% CD of the second swing from the daily which also crosses with the final MSRT (Bottom Pink line). This in effect makes me re-think my previous entry at the .500 daily XA because of the fact that we broke and retested the head and shoulders along with the reality that we already broke 2 MSRT zones pushing price towards 1.28 area. As a result, I changed my entry and moved it towards the “most secure” zone at 1.28049 of price. If price reverses from the .500 XA and breaks the above MSRT zones towards the bullish side, I will consider going long Euro.
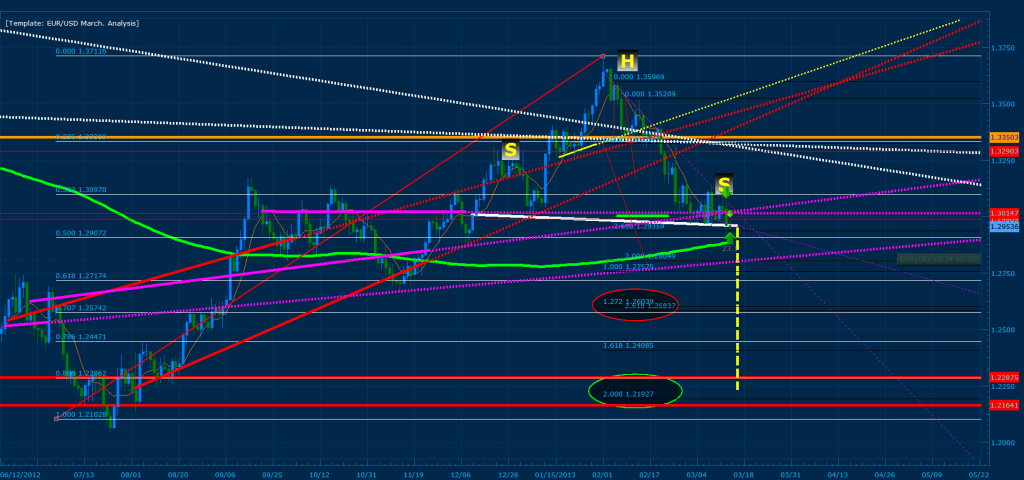
Now this is where things get even more interesting… we have a MAJOR head and shoulders that has formed and broke yesterday on the daily with a 722 pip APEX. As a result if the bearish downtrend continues, I expect the pair to reach 1.23-1.22 range of price as projected for the long term goal on the previous months analysis. Remember, the white MSRT’s that price broke around 1.33 level where previously responsible for a push of the euro towards 1.22-1.20 range… In effect, once the final pink MSRT is broken, I expect price to continue a bearish free fall towards this level; we have projected the first major stop to be around 1.25742 of price where 261% CD of the second swing on the daily and 127% CD of the third swing on the daily converge with .707 of XA and previously was the price range that sparked the uptrend (Red Elypses). Ultimately though, I see price reaching 1.21 range and consolidating inside the two red horizontal lines where a D point is waiting for the reversal of price.
As always use this analysis not for your main entries, but to know where current price is going and where it may go if certain conditions become true. I suggest that if you have not done so already, to plot the MSRT’s I have labeled on this chart and place thick horizontal lines in the key price levels I have mentioned.
(EDIT)
Note.: Use 1.29996 of price as your X and you will note that 1.272 of XA lands exactly where my buy entry for the euro is. In addition, the .500 and .786 of this XA caused the first major pull backs of this bearish trend. I expect price to reach 1.28 between today and the 24th of March. In the mean time expect a bearish bias towards this point unless the daily proves otherwise from current support level.
stopped out too, price moved 60 pips in 10 seconds this evening 
I usually would be looking for a crab, but in this case the 161.8 of XA is to far away from the 361.8 projection of BC, wich is the max lvl I look at. So I think i’m done with this pair for some time…
happy to see there is someone here who has profited from that bullish move 
Absolutely gorgeous, TMB! Thanks a lot!
I am in a long trade on EUR USD as a D point has triggered from daily or H8 chart (X=1.2703 or X = 1.2098). We had a nice triple convergence on .764(X=1.2703) .500(X=1.2098) with 2.618 -(first swing) and 1.618 (second swing).
I won’t close this position but I am really scare about that threatening huge Head and Shoulder monster… So easy to notice the H&S, still didn’t see it until you mentioned it.
thanks again.
one more question though, you mentioned the price crossing the 127% level but not the 141% level, does this mean a cypher cannot form at the 161% level
I’d atleast take partial profit now if I was in your trade and place a stop at +1 to break even on a pull back. Look for a break of 1.29869 on the daily and or 1.30147 on the 4 hour before considering taking the euro past the current highs.
I’m starting to get the hang of this. I just sipped a few pips off this pattern I found, I was able to map out the D prior to hitting. This is fun. Thanks again TMG for the simple idea.

I did so! Almost can’t wait to see what will happen next!
Danke!
I’m still in the AUDCHF trade, my stop was above the the recent highs, but it’s been a painful trade… The good news is it is coming back down so I’m much less in the red then I was last night. I think the cypher can still work out, but it has a ways to go.
I’m also in a USDCAD daily cypher that recently triggered, it was also a little painful at first, but now I’m 20+ pips in the positive, so hopefully patience will pay off in both trades.
You’re welcome. For it to be a valid cypher pattern C has to be at least a 127% extension of XA. It can hit the 141% extension but must not close past it. If you get a close past 141% its not a valid pattern. So the answer is no to your question. 
I meant USDCAD gartley, not cypher. For anyone who’s keeping track.
I just closed out the AUDCHF trade for a net 17 pip gain… I’ll probably regret not waiting for my target, but I’m out.
Also closed out of the USDCAD trade for +30 pips.
For those wanting to jump on a bullish cypher that is at D, check out EURGBP 30m. It is at D right now.
Nice one pdxkurt! My trade on that one got triggered as well. Let’s see how it goes. Good luck!
Well, the news were not in our favor on the AUDCHF. In the future i will try to be more precise in my postings regarding stop loss points, take profit points and previous structure levels (major and minor resistance levels).
The reason for not posting them is because i lack the time. Often i write in here from my cell phone from a train to or from work. I will stop posting patterns if i do not have time to be more precise.
I have worked a lot on adjusting my SL and TP levels because i had a huge drawdown on trades i got stopped out on but which in the end worked out great (just without me profiting from it).
So what i do now, like i’ve posted earlier is that i always place my SL above/below the X of the pattern, regardless which pattern it is. That has resulted in me not getting stopped out even if price didn’t retrace at the expected point. But what happens instead is that the structure of the X point many times acts as a support/resistance and price bounces of from it, still giving me some or all of the profit intended.
Like the trade on the AUDCHF i posted yesterday.
If you take a look at the screenshot below you can clearly see that it just continued north even after the 88,6% level of the bat pattern. But what has happened since then is that the previous structure has acted as resistance and stopped price from moving further north.
In this case i used 10% of the X to A leg as my stop. X->A = 520 pips, SL = 52 pips above X.
The orange area shows the resistance and the red-dotted lines are my SL and TP’s.
Of course there is no way of knowing if this trade will be profitable for me. Price might just shoot straight up. But in case a pattern fails you always have a safety net in form of previous structure which gives your trade a higher probability of succeeding.
I know many of you are scared of the thought of having such a big SL, in this case i had a SL120 pips. But what you gotta do is of course scaling your positions to fit your stop loss size and the same goes for take profit points.
No matter if i trade a 5 min chart or a daily chart i never risk more or less then 2% of my account size. If both my TP’s are hit in this trade i will make 480 pips and let’s say that equals to 48$ to make it easy. If it would have been a 5 min chart it could have been 10 pips for both TP’s but still give me 48$ due to a bigger lot size.
I think i have posted this before but for those who are interested my calculations to achieve this are as follows:
Account size 10000$.
10000$ x 0.02 (2%) = 200$
200$ / 120 pips (stop loss size for this particular trade) = 1,6 (Lot size)
Normally i place my TP 1 at the 38,2% of the A->D fib and TP2 at the 61,8% level. In this trade i chose the 78,6% level for TP2 due to how previous structure looked like acting as a resistance when price starts to move south.
So, don’t be scared of big stop losses. Just scale your trades to fit (both SL and TP’s). 

Bearish Butterfly on the EUR/USD? I see support at .382 and am targeting this as an exit, just prior that is.
Just watching how this plays.

You can see the C extends past A, that invalidates the pattern.
Hey everyone, I recently just finished reading through the babypips school and found this thread and I’m really interested in learning more about it. I’m only to about page 20 of the original information, but in browsing the more recent posts I was wondering how relevant the information posted 3 years ago still is for trading today. Is it still possible to trade just butterfly patterns and gartleys? I notice that more recent posts include different patterns like cyphers and bats and whatnot. In any case, when looking for gartleys and butterflies across different pairs, it seems hard to find these patterns to trade on a daily basis. Is it just me? Could any of you shed a little light on your process for searching for these patterns?
It seems hard to find these patterns because you are new to it, the more practice you put into looking the better your ability will become to notice the patterns. I suggest you look for new patterns as much as you can and also check back on this thread frequently and note what other patterns people are posting and the pairs and timeframes, If you see patterns here appearing on pairs and timeframes you don’t use then that is a big clue to you that perhaps you should start checking these pairs. Also when noting patterns people are posting it is probably best to try and take most notice of the people who appear to know what they are doing, as sometimes an inexperienced user might post a pattern and due to their inexperience they have made mistakes whilst drawing it or something. Or they are posting perhaps a valid pattern but are clearly trading against a strong trend (which will make it considerably more likely things wont go in your favour.
I also recommend you buy and read the book: Trade what you See that TMoneyBags has recommend as it is very useful.
and yes, the information posted 3 years ago is still valid, although I notice some people have started using these new MRST lines for finding their structures now, whilst some are still using the more traditional methods
Thanks for the feedback! I ordered the book 2 nights ago, it should be in soon and I plan on reading it. I figured the patterns might just be hard to spot until I got more practice. I’ll keep reading my way through the posts to try and learn more in the meantime.