I think there are also times during the day when there just aren’t many patterns… other times of the day you’ll see patterns everywhere.
Good practice is to back test manually, so scroll back in time and look for patterns, then do your fibs and pick your stop/limit spots and see how the trade would have played out.
I started doing that earlier today and remembered i forgot to ask in my initial post, are the times that D’s form still the same as initially posted: 2-4a EST, 6-8a EST, 10:30a-12p EST and 6-8p EST? And are the 30m-1h charts still the most concrete to look at?
Yes, those times are still good. And all of the timeframes have patterns forming, best advice is to get really comfortable with 1 or 2 pairs and timeframes before expanding.
Pretty sure this will fail, but with just a 10 pip stop the RR is good.
sell 1.5867, stop 1.5878, limit, 1.5760
Could be a little 3 push pattern on the m1 with bearish butterfly, so perhaps a temporary pullback for here. If so I would move to breakeven at first opportunity.
OK, so I would now trail the stop to 1.5872. Not quite breakeven, but only5 pip risk. Still expect it will probably fail with the previous week’s high so close.
So this is my first attempt at trying to find one of these patterns. Its the EUR/USD 30m chart. There was near perfect convergence at the .382 and .886, but I feel like I may have done this wrong. I also don’t really understand where to predict the D in reference to time, I just know D usually forms where there is convergence. Any feedback would be greatly appreciated. Also my first time posting an image so I hope it posts correctly.
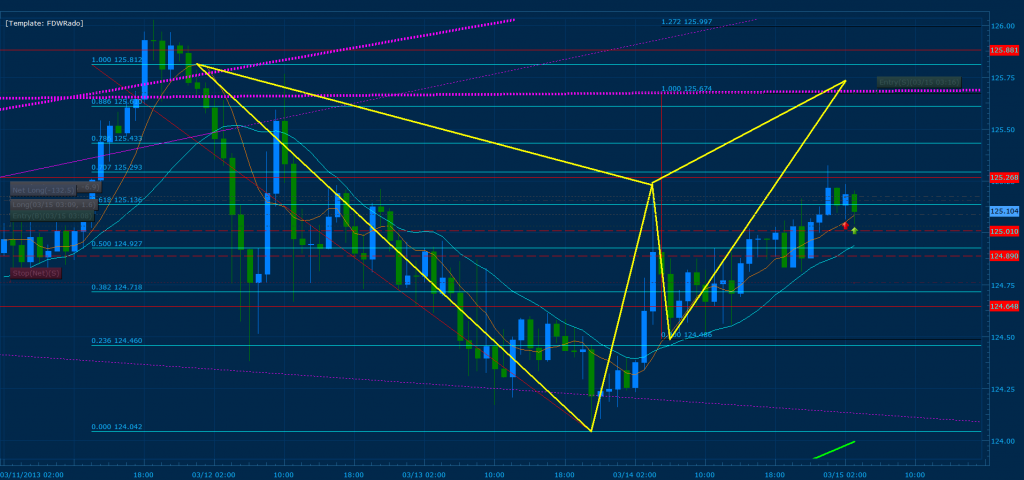
Good morning, we have a bearish Gartley developing on the EUR/JPY where 100% CD converges with the 1.0 and .886 of XA (X = 125.812). If you where to use the most extreme point as your X the convergence would be between the 100% CD and the .886 of XA. In addition, there is an MSRT running across 100% CD and a horizontal MSRT @ 125.881 of price. As a result, I have entered a C to D trade using 10% of my lots and leaving entries towards 124.890 that would increase the lot size to 13-15% of my max lots for that trade. Because of the fact that there is multiple convergence within this D point area I have placed only 40% of my lots at the entry for the 100% CD and will add towards max lots once it confirms a true D point.
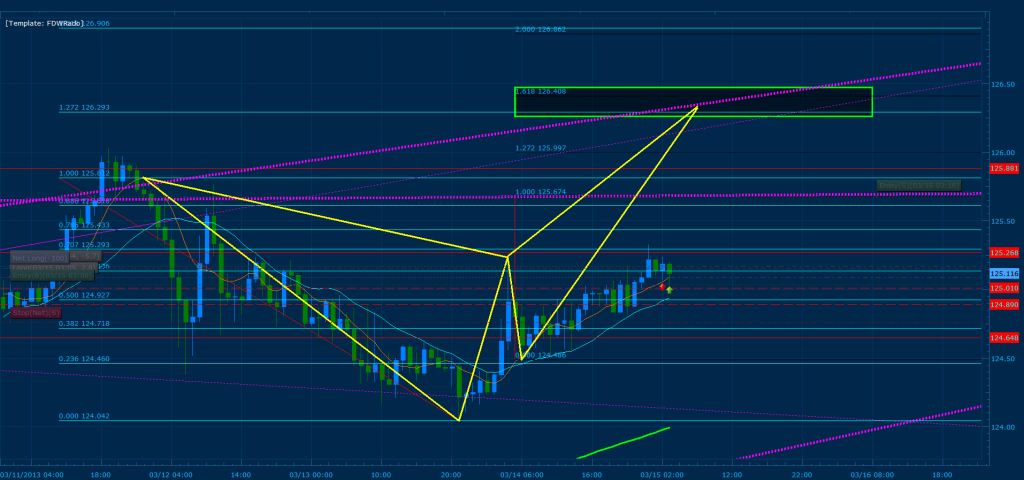
As noted above, we have multiple convergence and if the first D where to fail I will possibly buy C to D towards the next D and sell with 70-100% max lots at the higher convergence. Bellow you will note that the 1.272 of XA (X = 125.812) converges with the 161% CD (Green rectangle). In addition, we have an MSRT running from the 1h (thin pink line) and 4h chart (thick pink line) adding resistance towards the convergence point. If this final zone where to break I expect price to push towards 127.5 before reversing or continuing for a major uptrend.
Note.: I have a physical stop currently in place for the C to D trade at 124.757 of price.
Today i’ve taken a day off from work to be able to attend a 2 day forex trader workshop online since i couldn’t make it to the states this time. I hope i get something good out of it.
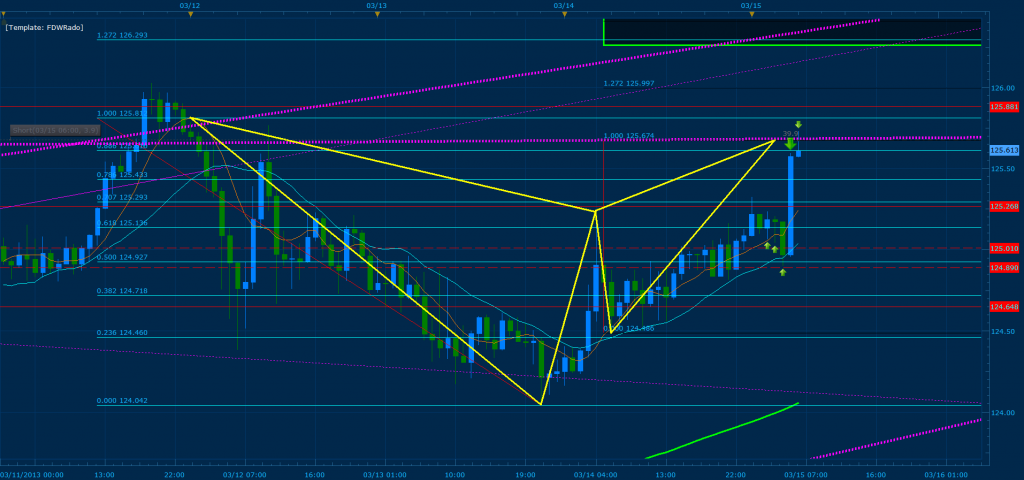
Our EJ Bearish Gartley has triggered where the 1.0 and .886 of XA convergeds with 100% CD along with an MSRT zone. We are shorting the EJ towards target 1 at 125.010 where we will be taking partial profit (50-70% of lots) and leaving the rest to run towards the bottom of the range.
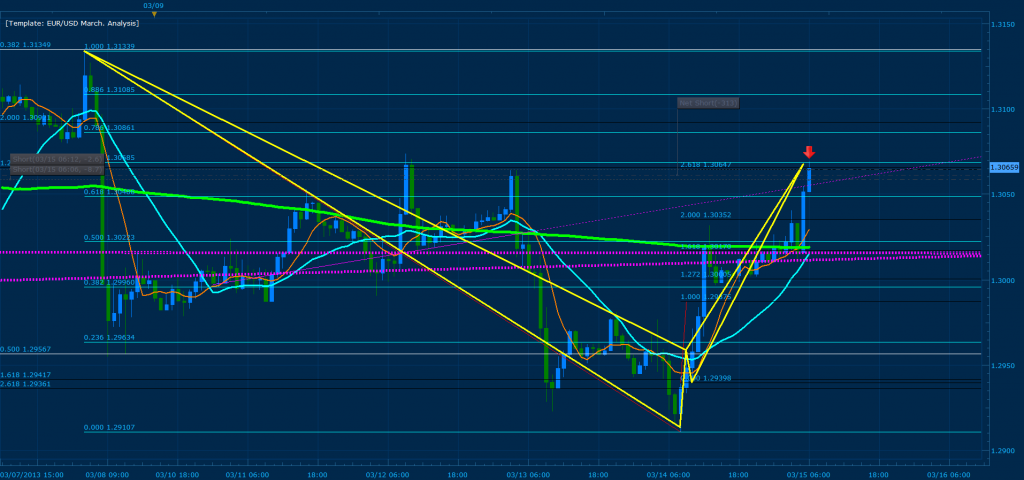
In addition to the EJ trade, the EUR/USD has reached an extreme D point where the .707 of XA (X = 1.31339 Extreme of leg) converges with 261% CD on the 1h/30min charts. We also have an MSRT zone adding resistance and major previous tops that where responsible for the EU bearish continuation. A break of this convergence zone will act as a reversal for the trend and start a major bullish movement. As a result, the stop is tight and an excellent position to enter for the test of 1.29 range. In addition, the daily yesterday did not close above both MSRT zones and the current up movement can be considered a fake out… let see what the market maker has to say today :). All in all Target 1 is the convergence of the daily MSRT at 1.30159 of price and target 2 is 1.29425.
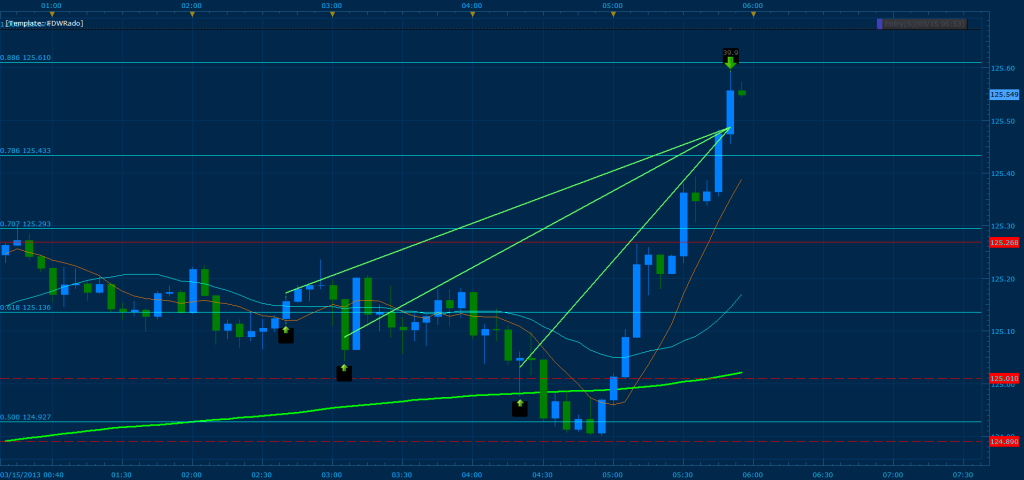
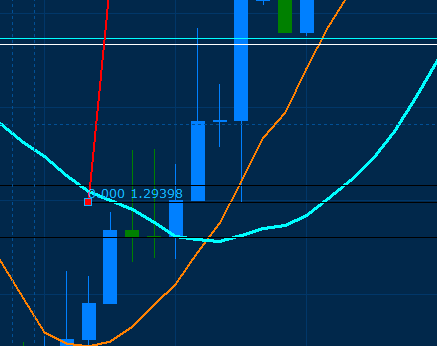
For the majority of you it may be difficult to see the BC leg that I’m seeing on the 30 min and hourly charts. As a result, I have zoomed into the 15 min chart to show you exactly where the BC forms for this extreme pattern (B = 1.29584 C = 1.29398).
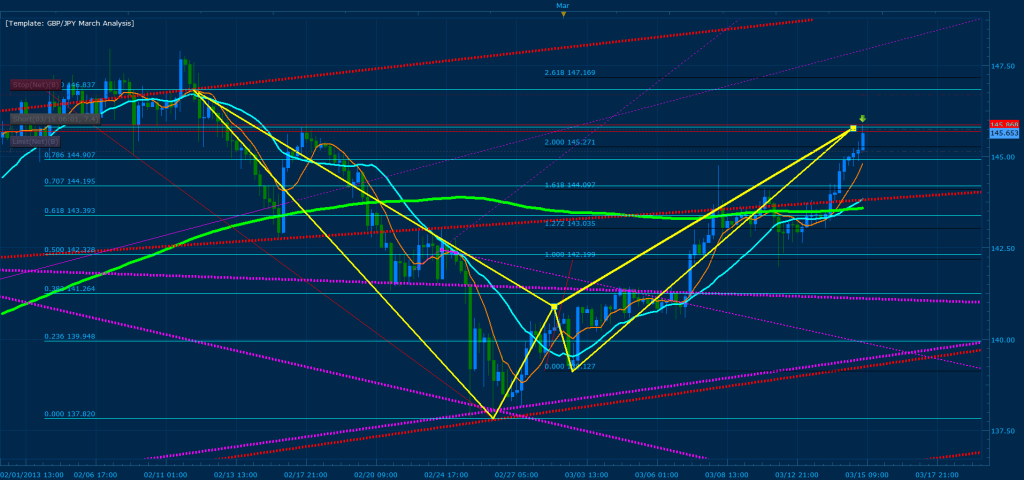
We have entered two major trade setups on the 4h/8h charts for the GBP/JPY and GBP/USD. Lets start by first analyzing the YEN pair:
Bellow we have a bearish Gartley on the GBP/JPY where 200% CD converges with the .886 of XA (X = 146.779) on the 4 hour. If we use the most extreme top as our X the .786 of XA converges perfectly with .886 adding convergence to the current trade. In addition we have two horizontal MSRT running through 145.898 and 145.707 adding weight to a bearish turn around (see how price reacts to these levels on the 1 min) Using 12% of max lots we are working our way towards a 60 pip target at 145.134 and depending if price breaks the 145 range, we continue selling towards 143.5 price range where a daily MSRT and previous price consolidation awaits a retest (this would constitute a 190 pip avg drop from D). As you may note this is a very conservative target for the pair and we will most continue selling towards the following targets: Target 1 = 144.021 Target 2 = 142.851 Target 3 = 140.246.
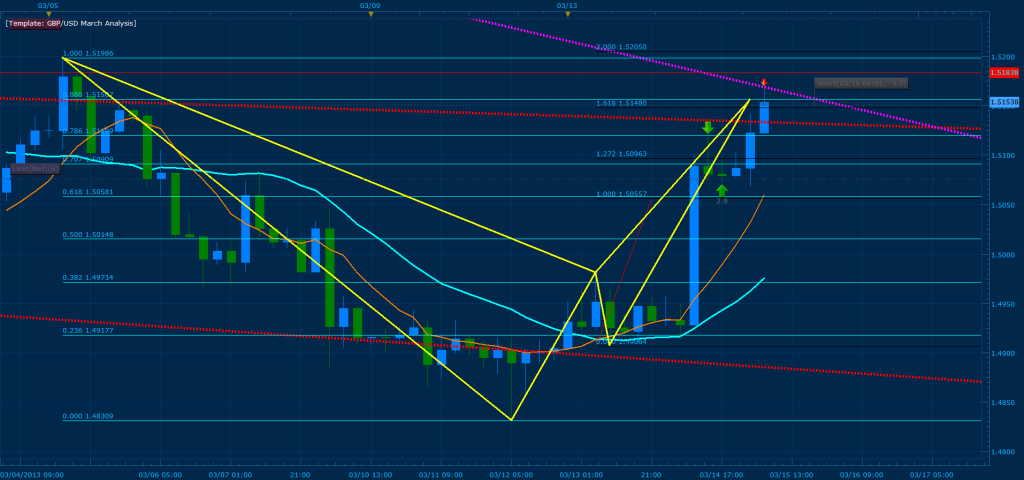
On the GBP/USD 4 hour we also have a major bearish Gartley that has triggered where the .886 of XA (X = 1.51986 Extreme) converges with 161% CD. Within this convergence zone, price tested on the daily a RED MSRT (Red diagonal line running across current zone) and halted for a bearish continuation. Today we have pushed a bit further to reach the D point and also test a 4 hour MSRT (Pink line). Please note that the main trend is bearish and is in our favor for this pattern. As a result, I expect price to push towards the 1.49 range. Again because of the fact that we are already in 3 other trades apart from this one we are using 12% max lots and will be placing our limit at target 1. Target 1 = 1.50881 Target 2 = 1.50390 Target 3 = 1.49032.
The trade i catched on the GBPJPY, due to a bearish gartley seems to work out as intended, +70 pips at the moment times two since i have two positions.
To bad my entry on the EURJPY missed by 1 pip since it’s going the same way.
And yes, i changed my color scheme on my home computer a bit since my eyes got tired of the bright light. Of course i got inspired by the colors chosen by TMB:
Hmmm, bad thing it’s hard to make out the candles in the screenshots in here. Here’s a closeup.