off topic…
I tried to post chart here. But the “insert image” button didn’t wok for me. Can anyone tell me why and how? I use window 8.
Thanks,
off topic…
I tried to post chart here. But the “insert image” button didn’t wok for me. Can anyone tell me why and how? I use window 8.
Thanks,
Hi Jeppe,
You are correct. Sorry for not responding sooner, but I’m glad you were able to get a response from our client support team.
For everyone else, on Monday at 5:02 pm New York time, we received erroneous prices on our feed that affected several NZD pairs. The correct prices for that time are below.
[B][ul]
[li]NZD/USD – 0.8250
[/li][li]NZD/JPY – 78.60
[/li][li]AUD/NZD – 1.25938
[/li][li]EUR/NZD – 1.5687
[/li][li]GBPNZD – 1.8274 bid, 1.8293 offered
[/li][/ul][/B]
The Trade Audit Committee is currently investigating and will make appropriate adjustments to any accounts that were affected. I encourage those who had affected trades to log a case with the Trade Audit Committee, so you can track the status of their resolution. I apologize for the inconvenience this has caused.
Jason
TMB,
Do you ever confirm D with the BC projection? If not, what is your reasoning for excluding this? Thanks!
We here read the book “trade what you see”, it does not use BC projection. And MTB’s method is coming from that book. So, our basic pattern does not contain that projection. However, as mention earlier, he uses other technique to confirm the D.
From what I see, TMB does not trade the “defined pattern”. He called everything D less than XA gartley, and everything above XA butterfly. Indeed, I like this notation as well. No specific name to remember. So dont get confuse what we called here and the defined pattern. Here he only called 2 name, gartley and the fail gartley is butterfly.
So from time to time, you will see more pattern from TMB than the actually existed defined pattern that is spreading around the net.
Hope this help.
In about three weeks I went from knowing zero about currency trading to opening a demo account, finding this thread and learning how to scrape up 30+ pips per trading session. Thanks for everyone’s input. The hard part for me is keeping them. Most of the loosing trades are from emotional, non-stops that ran away from me. But the winners were calculated, analyzed and well executed.
If I can learn how to let go and not get greedy I may have a chance.
ok, i’ll take a look at the video again, thanks.
Greed is a killer. And will bring you one step closer to failure if you don’t get it undercheck.
In the past [before i started learning Gartleys], i lost count of how many times i got burnt due to greed.
These days, I’m very good at keeping my emotions in check and not trying to be greedy. but there is the odd odd occasion where greed somehow takes over and i try and scalp things outside of my trading plan …and more often or not i end up getting burned. You think it’s a sure move, that the price is definitely going to move to a certain place …and then the market turns around and bit*hslaps you hard. I’d say my greed is 80% undercheck these days. like 8 times out of 10 i can resist what i perceive to be good opportunities if they are outside my trading plan.
kudos Mike, even posting that screen shot is a step of faith. dont give up is all i can tell you
Very nice that you can recognize this mike and I’m loving the fact that you are not afraid to show your mistakes. From what I see here is that after you recovered and made some profit you pushed yourself to continue trading even though you had a recovery and made a bit of profit. I recommend that you try the method where you aim for 30 pips daily and if it takes you 2-3 trades to break back even… simply stop trading for the day and continue trading the next day. This is because if you continue to over trade as you did, it leads towards mixed emotions (mainly revenge trading because you did not meet your goal) and a huge bias towards market direction. Also, notice how in the majority of your losing trades you you kept a static lot size of 300k but in the winning positions, you managed your distribution in lots very well. All in all, for the account size you are trading in the demo this is an excellent loss because you can tell that you caught your self when you where doing wrong and was able to exit accordingly :). Keep up the good work man!
Basing your D point on the sole use of Fibonacci convergence leads towards bias market decisions and projections. Their is nothing wrong in measuring the BC to project the D point, it is simply another “tool” you can use to pinpoint where to accurately locate the D. But as I’ve repeatedly stated throughout this thread, you must look for outside validation such as trendlines, pivot points, rsi, magiclines, triangles, head and shoulders, candle stick patterns, price actions, apex end, etc… that show SR near the converging fib levels (add “weight” to the S/R). For me the proper use of trend lines, basic patterns, and price action when added to the convergence between XA and CD fib points is sufficient for identifying a true D point and exiting a fake one.
I’m very interested in seeing a tutorial on your MSRT lines. I demoed about +10% a month for a couple of months but my live account is suffering (reading the disciplined trader now). Either way, I draw the MSRT lines but they are very rarely anywhere near where the patterns are forming. Do you wait for price to get near an MSRT and then look for a pattern?
Also, what pairs are you looking at nowadays? Right now I’m only trading the E/J and I can’t take one trade per week, just don’t have that kind of patience. Thanks TMoney for everything.
Is it just me or are very patterns developing over the last few days compared to normal?
The last few days have taught me that I don’t always need to be trading. Would’ve been more profitable to watch.
@Diablo1505
i saw you was up 28% or so last week, really impressive.
But how did you do this week, the reason i’m asking is because, i know we trade the same kind of patterns. And my week has been rather bad lost 50-60% of last weeks gains.
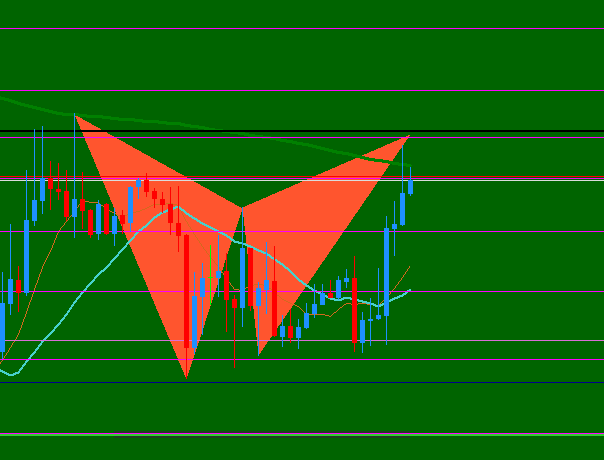
hello Tmoneybags, i have some question about D point is this true D point at 0,886 AB and 0,500 XA? if im wrong correct me please…
I’m pretty new to all this but try to be active in this thread to learn more by discussing these types of things. The D that you have pointed out doesn’t seem to have a lot of convergence in reference to XA so I don’t think it would be a true D. To answer your second question about it not reaching D, is that these price patterns will tell you where D is likely to land for a valid pattern, but not necessarily when. More importantly, these harmonic price patterns will show reversals, but only after the pattern has completed. What I mean is that the D is never guaranteed to form, the pattern can still fail. In your example, the price dropped below your C, so now you would reevaluate your pattern with the lowest low as your new C. Again, I am new to this so don’t take everything as fact. I’m just answering with what I believe I understand to be correct.
Edit: Looking at your picture again (it’s hard to tell because I’m viewing it from my phone) it looks like the price has touched below your A, meaning your C is lower than your A. Thus, it would not be a valid gartley or butterfly pattern. While I can’t really read the fib numbers on your chart, it’s possible that this could turn into a cypher pattern, though.
thanks for the replay. but i drew my A from 21 mar 19.45 in that time it suppose be my A and mb C at 22 mar 01.45 sorry for bad english. i am newbie too about forex and this pattern, im happy if you can tell me if im wrong
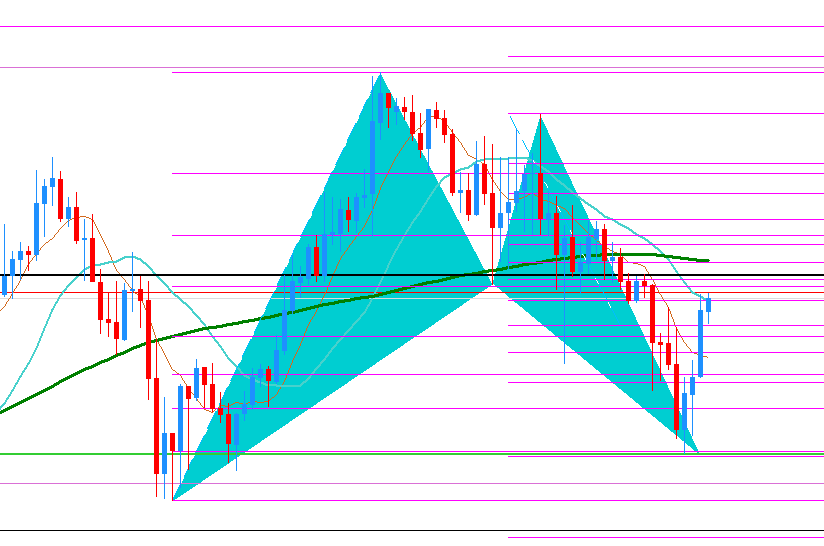
I think actually your C is higher than your A and this is what invalidates any gartleys, butterfly’s or bat patterns. With a Cypher your D always Lands of the 78.6 of XC …and your D you havent projected to land there so if it was a Cypher you were attempting you now know your error
edit: and also upon closer inspection your actual X point does not exist. you seem to have just magicked an X out of thin air 
Coming EUR USD 1 Hour