Would anybody please check and compare their chart with mine, because this happend for me, on a live a account! When checking up on a trade where i had moved stop to BE +2 pips
bid price:

ask price:

about + 60 pips difference between bid and ask… how can this even happend?
First off all my stop was at breakeven, so i should only loose a maximum of 10 pips and that would only be in a highly volatile market situation, where the spread can jump and second of all the spike on the candle is no where near -80 pips from my entry, even if the spike was legit, which i highly doubt. It only spiked like -45 pips below my entry.
jeppe,
My charts show the same. I dont have an explanation, I’m still a rookie. Sorry for the loss. That one stings.
just talked to FXCM support. they say it was a clear mistake made by themselfs. And then gave me this form to fill out so i could get my money returned.
After getting about 50-60 pips. I saw a re-test and with a total 3 D point landed on the same place and 2 other indicators say buy. So I re-enter, But for some reason I put my stop loss only 20 pips. Didn’t know where my mistake come from, I usually put 30 pips. Then it hit my stop loss, about exactly my stop loss and push up for 200 pips , and my take profit is 160 pips.
SO, instead of getting 160 pips. I lost 20 pips. Seriously, I must be sleepy at that time and key in the wrong stop loss point.
At least on the first 2 trades, I got some pie of it 
NZD pairs usually have wide spreads because they are not as popular as other pairs so the broker has to widen the spread to make it worthwhile providing this pair to trade.
I am not sure if what you are seeing on your charts is actually a true error or just a wide spread by your broker.
the worst NZD pair i have come accross for spreads is GBP/NZD …but i wouldn’t be surprised if there was a worst pair out there…
hi,
where can i find this fibonacci from ?
what do you mean? All the fib level are on the chart.
i cant see to 786 or 886 in retracement ?
[QUOTE=Halit;470462]i cant see to 786 or 886 in retracement ?[/QUOTE]
Just select a fibo and click on properties then add them manually like this
Unfortunately, because I do not understand English, see do not understand the content of the article, but translated by Google, and can be understood about the meaning, so I benefited, thanks to the author’s selfless dedication, thank!
Thanks very much
always welcome


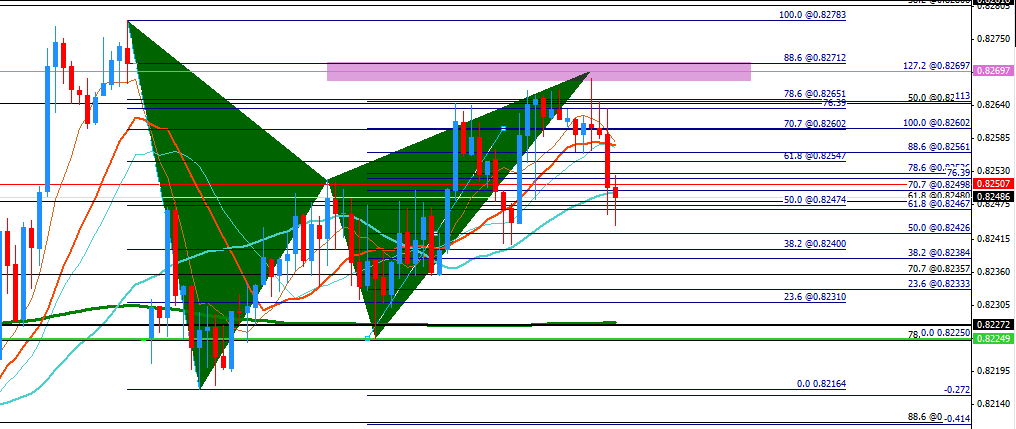
sorry, back again. now looking to go long eurnzd. no pattern for the entry, just buying the 0.382 m1 retracement at previous resistance turned support. (first chart)
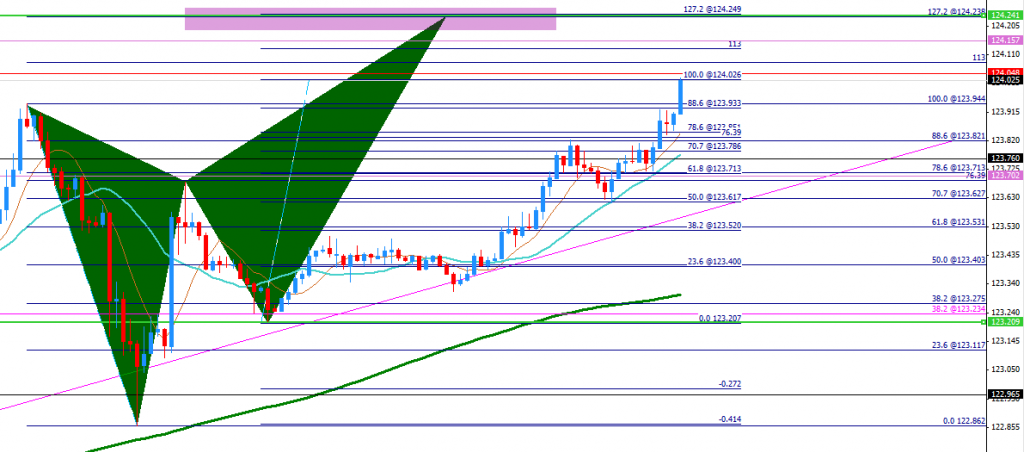
buy 1.5720, stop 1.5713, limit 1.5870 (H1 bat D). low probability but crazy risk/return. looking for entry into possible H1 bat CD leg (second chart)


thanks for charts
Say a butterfly is forming and set to hit the 127% of XA.
If D hits it successfully, how far in general will it bounce. what fib target would one aim for

I could be very wrong as I’m really new to all this, but I think in his videos TMB says that it will usually bounce back to the .500 of CD. I do think I read a post here recently that said certain pairs have certain fibs that they usually retrace to, so it can differ.