I noticed the setup you traded but didn’t take it as D was due to hit around the fib level where B actually hit [the 61st fib], and I thought D had to hit another fib level to B …but im not really sure on that…?
can anyone else confirm if D can infact hit the same fib level as B??
Hello Guys!
i kept training everyday to find gartney pattern and i want to study together with all of you. so i will share my chart to you.how about my D? im little bit confused the correct D would be in 0,500 XA or 0,786 XA convergence with 1,618 CD. feel free to comment and i am happy if u want to correct my pattern cause im beginner at forex. happy trade:)
Allright, had 30 minutes to play around with marketscope today and looked for some patterns. This is what i found, both completed patterns and possible patterns forming.
EURJPY, 1 hour. 1 cypher that completed nicely, a trade i took this week and both TP’s got hit. Then we have a possible gartley forming. But it’s to early to say since the C point can be violated by a gap due to the cyprys news during the weekend. But if the c points won’t be violated and price continues up look for it to start retracing somewhere between the 0.786 and 0.886 level.
GBPJPY, 1 hour. One gartley and cypher pattern that completed back to back. Two trades i took this week so this is just for you to see, redraw them by yourself and practice.
USDJPY, 1 hour. 1 completed gartley which i missed. And we have another possible bat pattern forming. Same as on the EURJPY it’s to early to say if the C point i am using will hold or if another c point will form OR if everything will be violated due to a gap tomorrow. But if this C point is not violated and price breaks above B you can look for D around 0.786 or 0.886.
USDCAD 1 hour/4 hour. A small cypher that completed nicely. And on top is a bigger gartley pattern forming if price will continue past B and towards D. It may be hard to see in the screenshot.
I would look for a D completing at around the 0.886 level though because of the ABCD pattern inside the gartley. If you take the leg from A->B and copy it to C you will see that it completes at the 0.886 level.
Ok guys. Hope this is helpful. Sorry for the partial information but i do not have enough time on my hands today. On completion you can for exampel start looking for confirmation signs that will confirm your D point. There are patterns everywhere on every time frame. Remember you do not have to trade them all. Choose the ones that have some other things confirming your D point like support/resistance, RSI overbought/oversold, RSI divergence, pivot points, previous support/resistance, etc. Keep looking and you will start seeing them more frequently.
Here you also have a nice pattern that completed last week. A cypher pattern and gartley pattern completing at the same point on the NZDJPY 4 hour chart. There is also a butterfly pattern hidden in there even though B retraces up to the 0.886 level which is a bit high. A high probability setup and you see how it worked out.
These are the trades that you should be looking for instead of trading every pattern out there.
Thanks for taking the time to post them Diablo, the majority I had not noticed. I see you really like your Cypher’s. We should start calling you the king of cyphers lol. I think USD/JPY bat that you predicted looks quite promising …and if it doesn’t invalidate itself i will probably attempt to trade it.
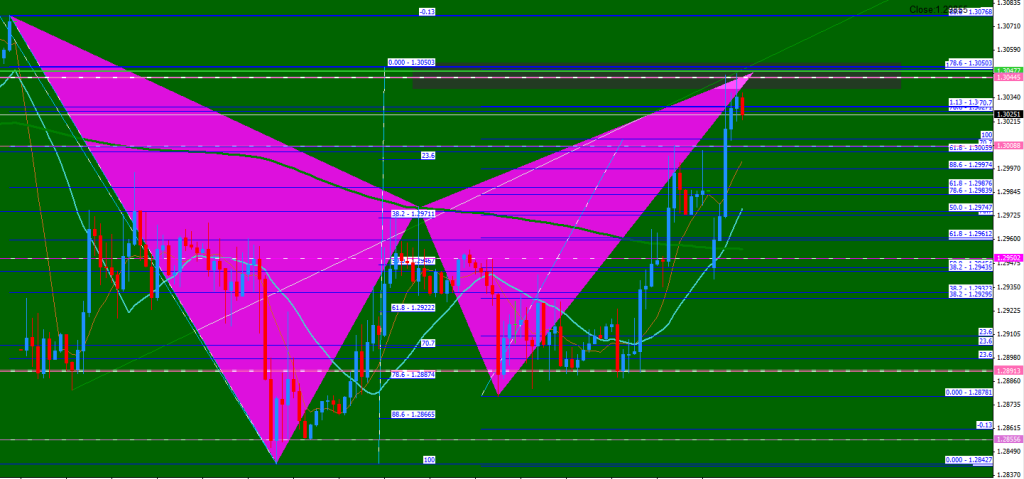
I think on the EURUSD, 1 hour one you posted though, that when i drew it in, to me it looked like an ab=cd gartley had already completed on the 61st fib, bounced a little down, before bouncing back up and through the 61st fib. im a bit skeptical it will turn into a bat