And at a very old Supply level. My chart shows May-13. Very nice.
Oops, my bad. I don’t trade Harmonics primarily, but like them as an entry if other factors line up. I was scanning through charts for nest week and see a possible Bearish Cypher in Eur/Cad. Is this pattern one you’d recommend. I’m happy for any critique. Also, my first post with Jing, so not sure what to expect.
Do you use a pattern recognition indicator The one I would buy is a little more expensive then I’d like to pay, and I guess hunting for W’s and M’s isn’t that bad, but I get a little lazy. TM, could I ask how many pairs you look at a day? I’m always seeing Bat patterns in Oil, but not sure if you just trade Forex.
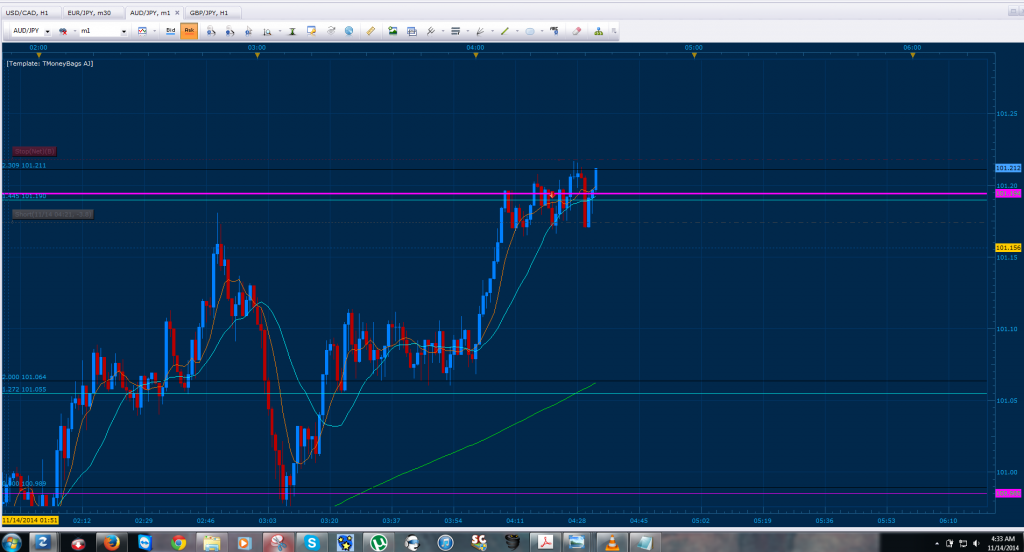
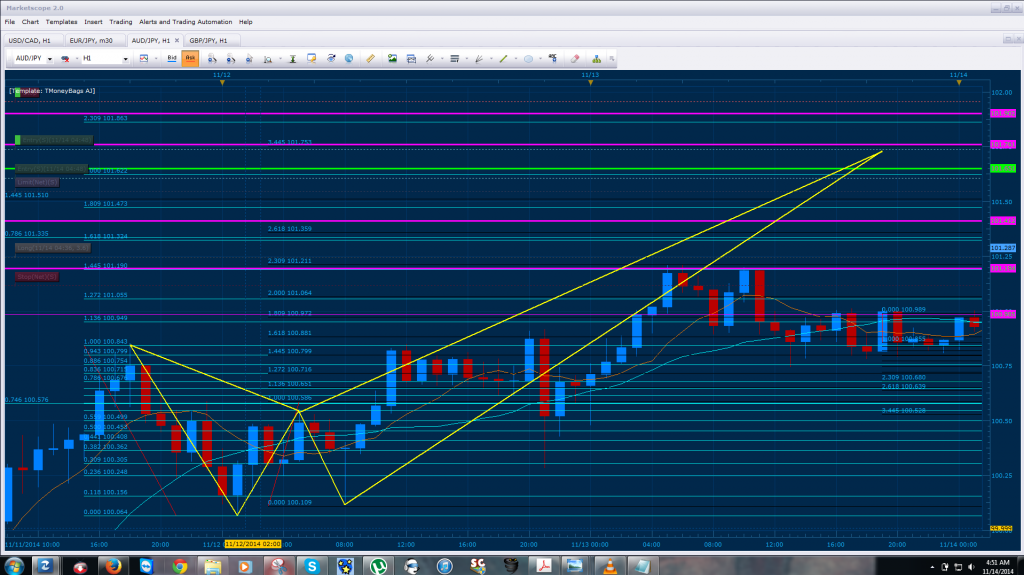
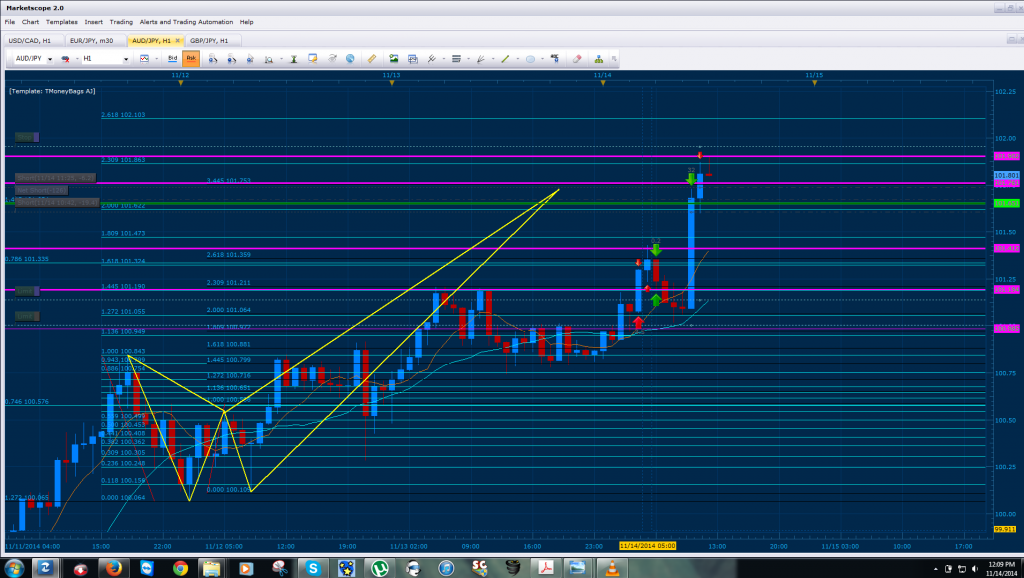
We have a butterfly pattern that has triggered on the AUD/JPY on the 344.5% of CD converging with the 2.309 and the 1.445 of XA.
I only trade the forex markets and tend to scan through the nine symmetrical markets that we have analyzed throughout this year.
As for pattern recognition, I recommend reading “Trade What You See: How to Trade Pattern recognition”.
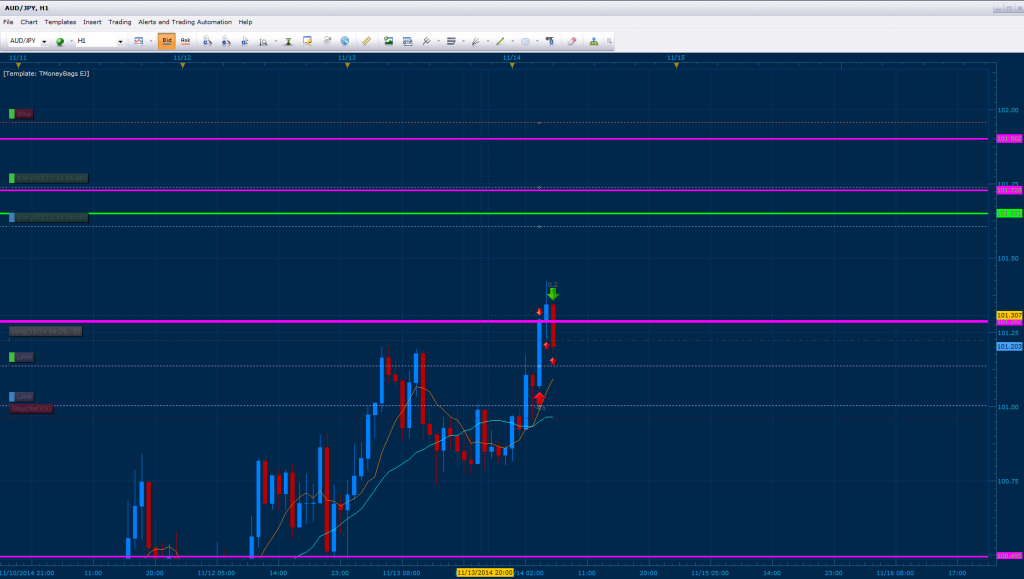
AUD JPY Butterfly Closed
i can’t get 30 pip per day. i trade with long term. i usually get 100-200 pip per position. i has more time for other action
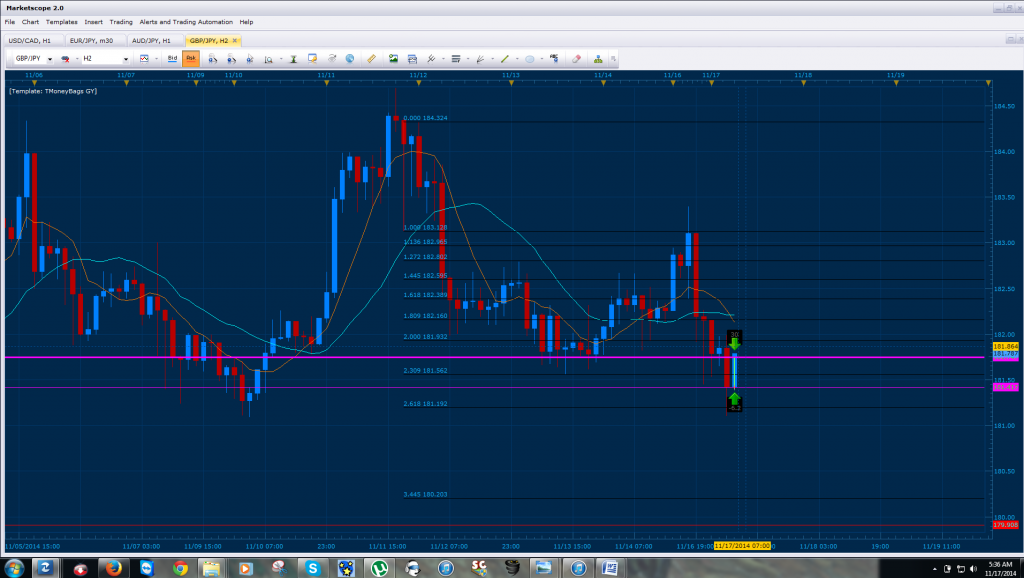
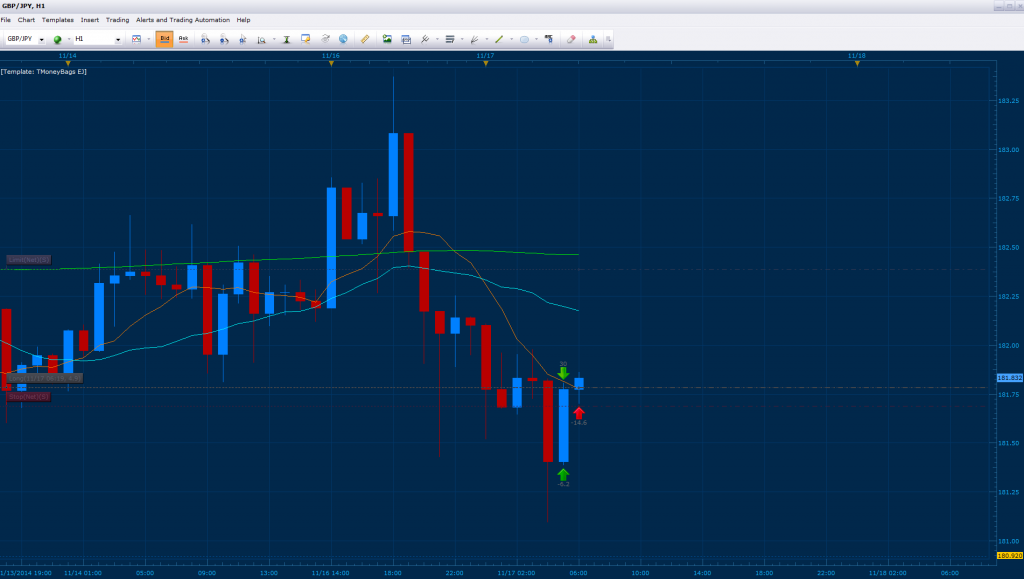
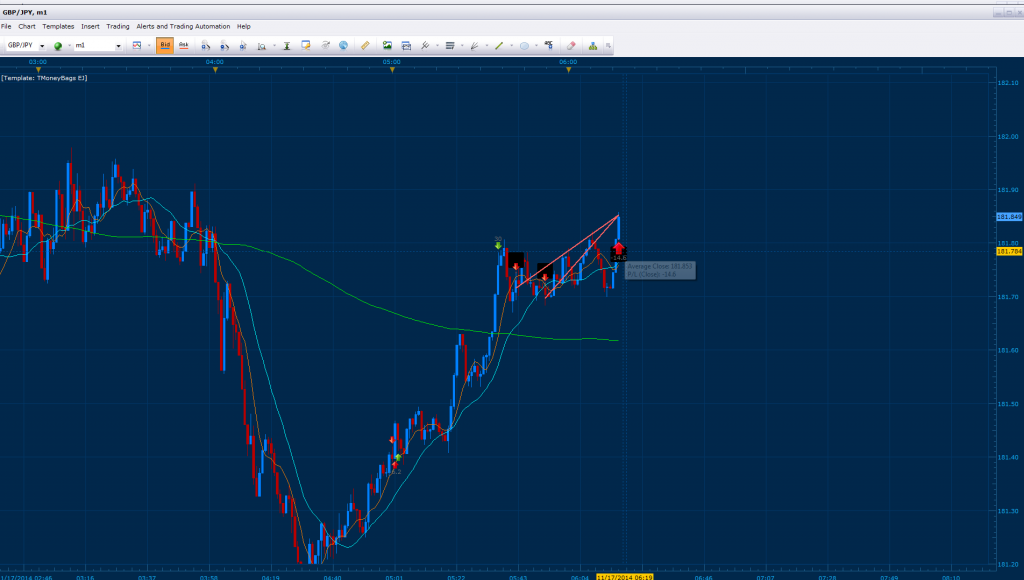
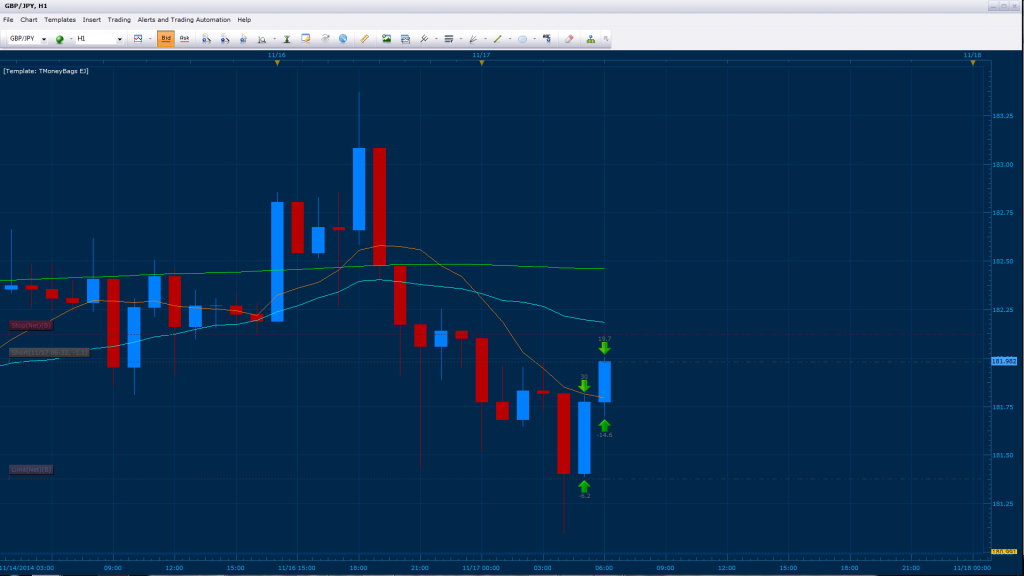
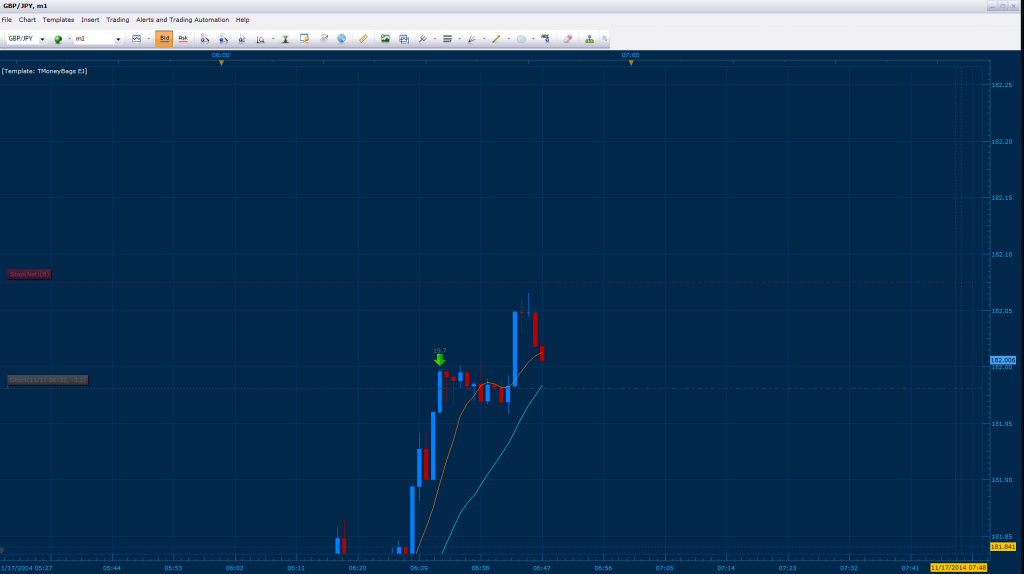
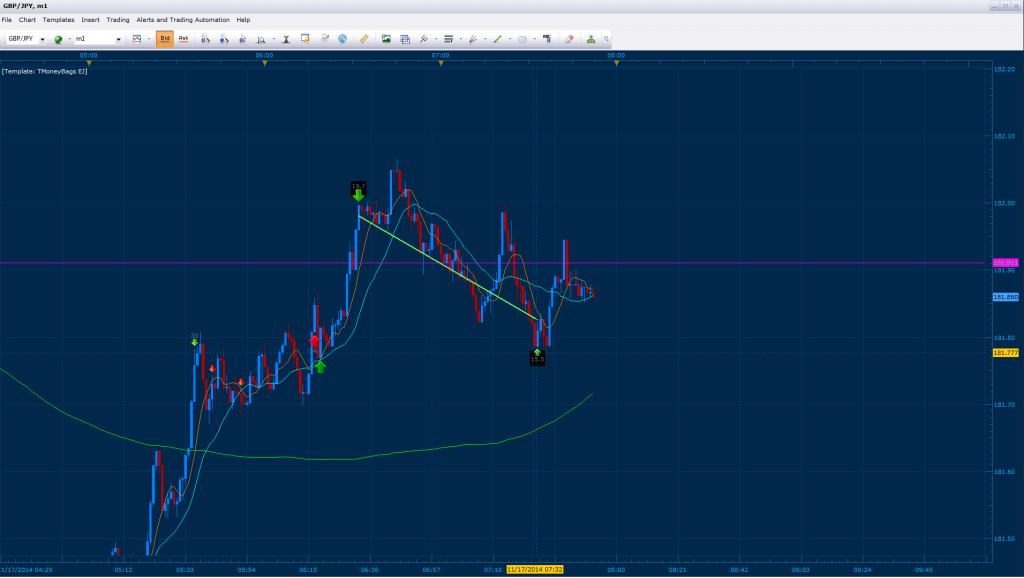
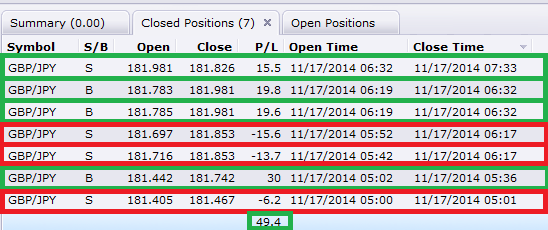
Hello and Good Morning all, bellow we have the GBP/JPY reversing from the 261% CD and .943 of XA. Here I will go through the process of how to scalp the reversal after confirmation. You will note that I have a 6 pip loss initially before entering the long.
30 pip scalp after confirmation
Bearish Continuation signal
Fake out
I woke up early today with my body tired at 1 am ready to trade the markets, had only 3 hours of sleep and after my stretching and meditation (my daily routine before trading) I forced my self to “hit the sack” because of lack of sleep. I couldn’t sleep as I wrestled endlessly with the thought of needing my rest and the responsibility of needing to trade. Something inside me was pushing me to wake up and fulfill my responsibilities… an urge that kept me searching for my dreams for 2 hours and a half. It felt good though… to finally have that sense of responsibility towards my students here and coworkers, I knew the laziness that I had grown accustom to these past years as I went through a separation with my wife was now slowly dying.
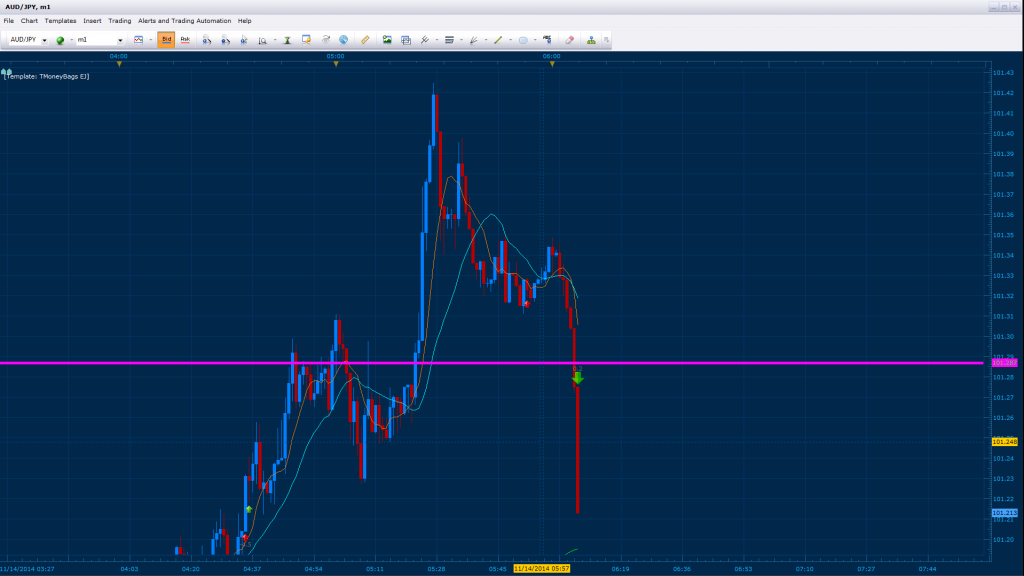
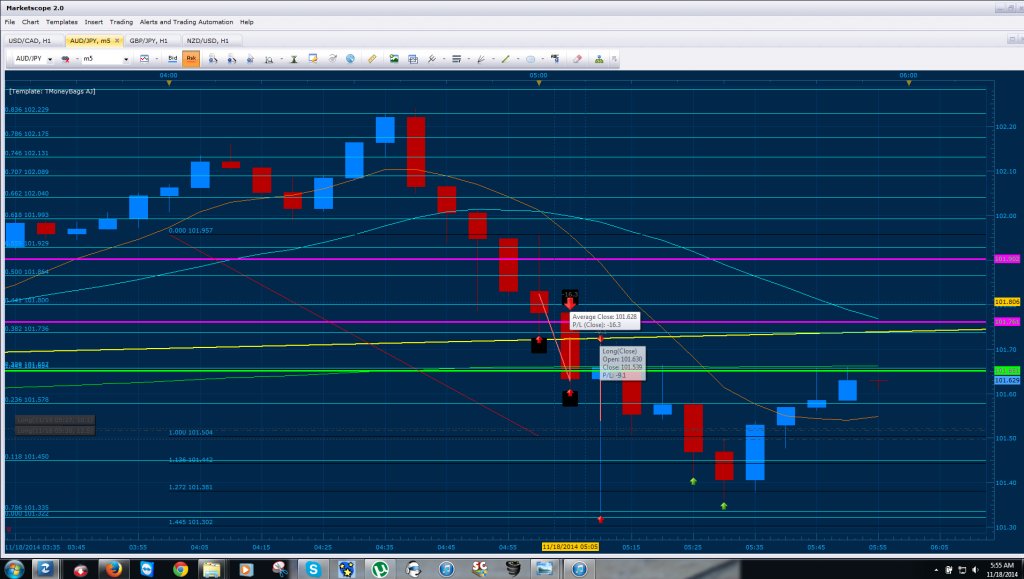
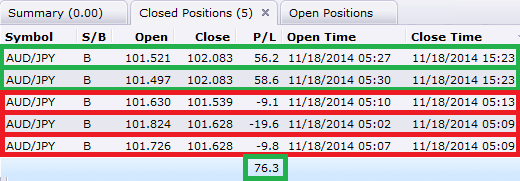
After waking up and experiencing that “**** it” I need to work, I dove into the markets and noted all the missed opportunities I had. Within me I felt that gut instinct pushing and pulling, telling me to do my full top down as I searched through the USD/CAD AUD/JPY and GBP/JPY. The fact that I missed those opportunities, conflicted with me and made me rush through my analysis not checking for my patterns properly. As I rushed through, I chose the AUD/JPY and was faked out twice, I calmed down… breathed in deep and realized what I was doing to my self. I entered the AUD JPY Long position one more time after reaching 100% CD, placed my stop accordingly at the 101.213 and sat on my hands to relieve my self from that anxiety that makes us trigger happy.
Since my return to babypips I’ve been working on my emotional discipline thoroughly, watching the 1 minute chart along with the hourly. Putting classical music some days, rock and roll, things that burst those emotions within as you trade as one reads price action. I made sure to stay away from my trading partners and not listen to their opinions for I feared that it would make my decisions bias before having the proper emotional intelligence needed to handle oneself. Today we traded together as I went through the experience above, feeling that same emotional pull you would feel on a wall street floor. Anyways, bellow is my active trade:
Entered AUD/JPY Long, Posting analysis shortly.
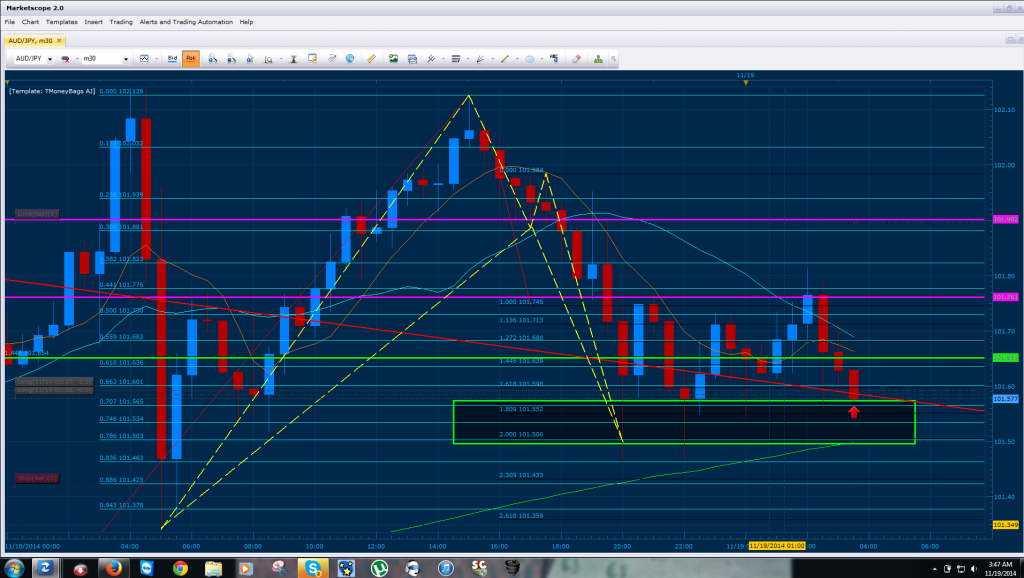
Bellow we have the AUD/JPY on the 30 min chart where the convergence of 200% CD and the .786 has confirmed the bullish continuation on the pair. I’ve placed a green rectangle swing how the .707 of XA converging with 180.9% CD has been respected by base price. Notice how my entry came from an MSRT (red trendline) converging with this point. I’ve set the limit at 30 pips, if a break occurs we will continue the long and take the C that seems to be developing towards the butterfly. Our physical stop is at 101.419
Edit.: Added additional lots at 101.454
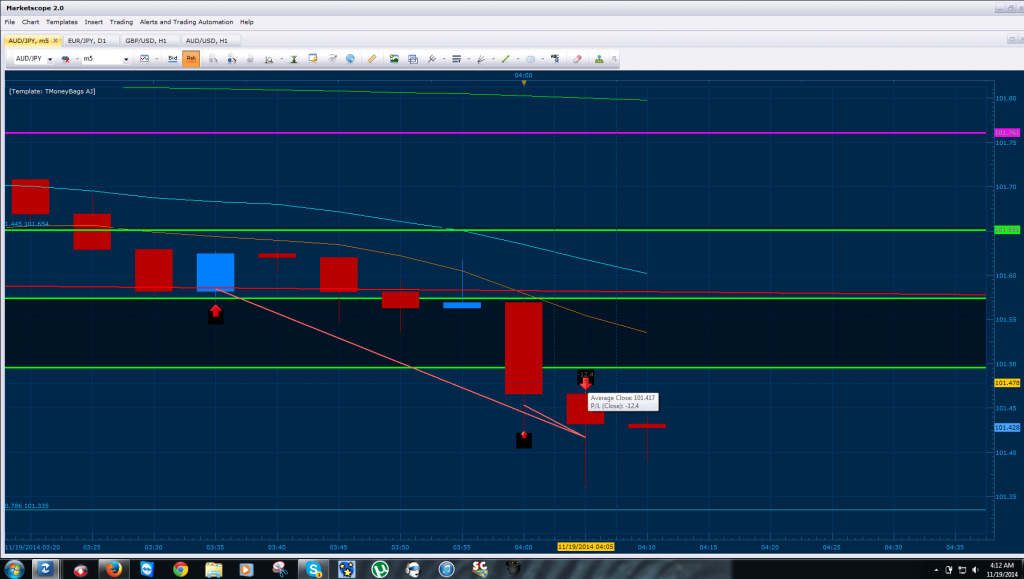
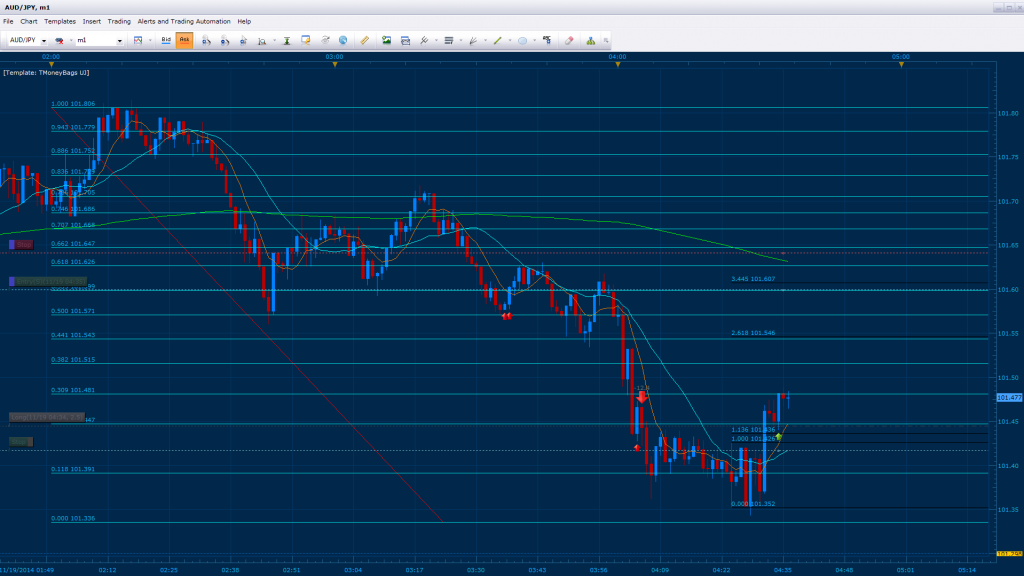
Entered a scalp towards the re-entry point on the AUD/JPY 1 min chart. Bellow you will note the entry came from price action after the news where a physical stop was placed 1 pip bellow the entry. Currently our stop has been placed towards break even covering the spread and an entry for the short in preparation for the CD move is placed at 101.597 where the 344.5 CD converges with the .559 of XA (101.642 is our physical stop for this entry).
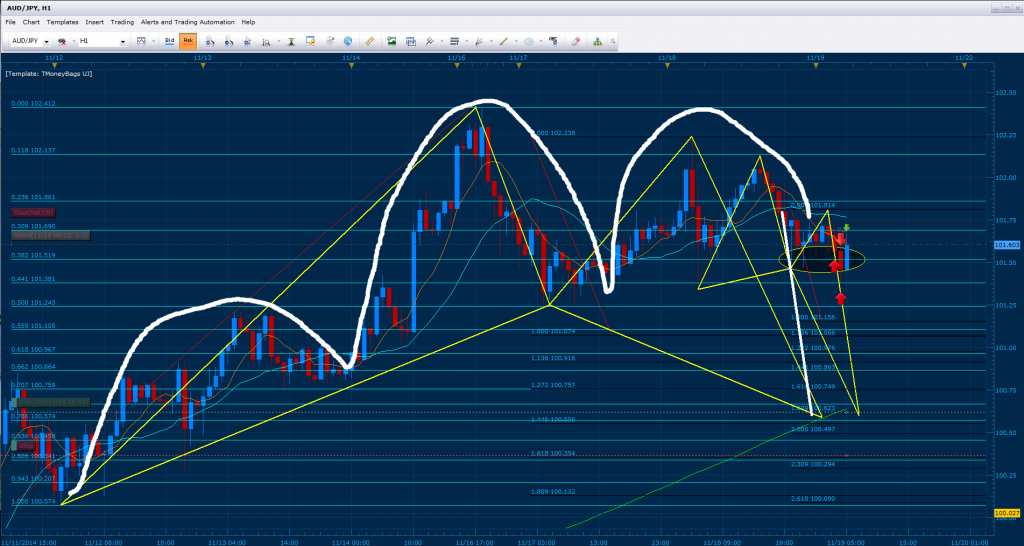
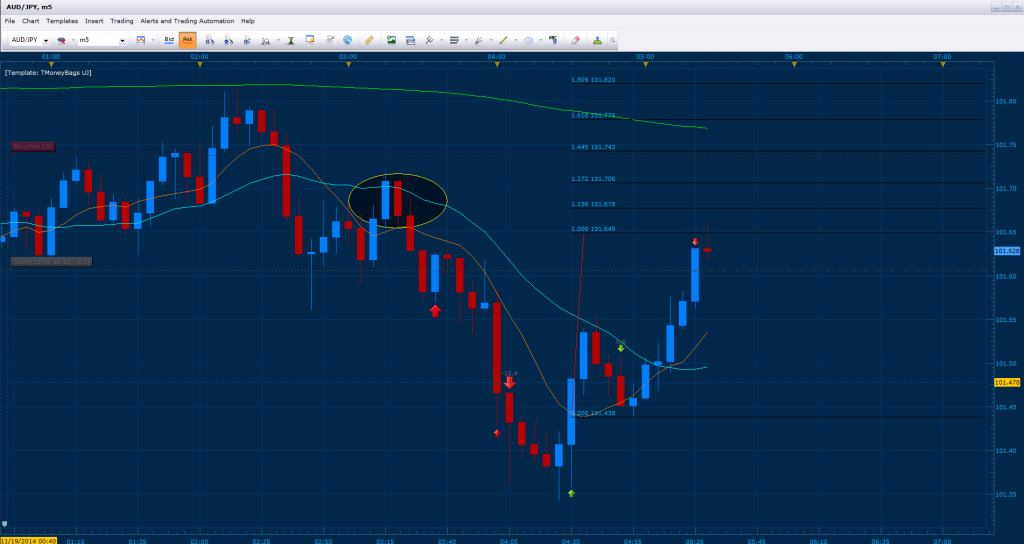
Within the AUD/JPY 1 hour chart we have a CD confirmation (yellow ellipse) from a bullish butterfly that is forming aruond the 180.9% of CD. In addition, Their is a gartley that lands within the same zone where the 144.5% of CD converges with the .786 of XA. You will note that I have adjusted my stop on the bearish entry I had shown on the 1 min. This is do to the development of a gartley developed on the 5 minute where the 100% cd had formed as we “stalked” price (second image). Also note that we have a bearish head an shoulder that has broken and done its test for the short, giving us an apex landing on the projected pullback for the pair and continuation of the Long Term trend.
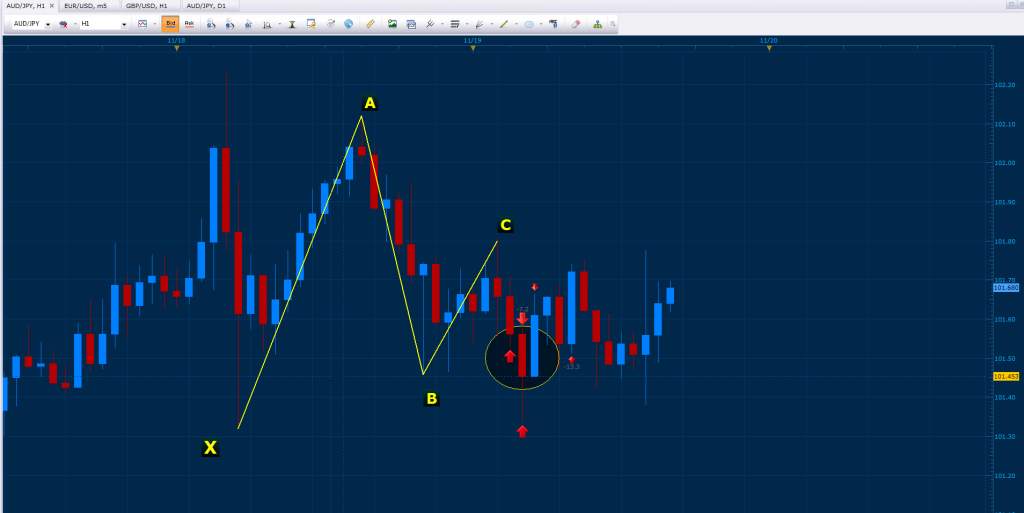
I’m sorry for my question but why/how did you choose your B point?
I plotted my B point on .886 of XA.
Thank you very much.
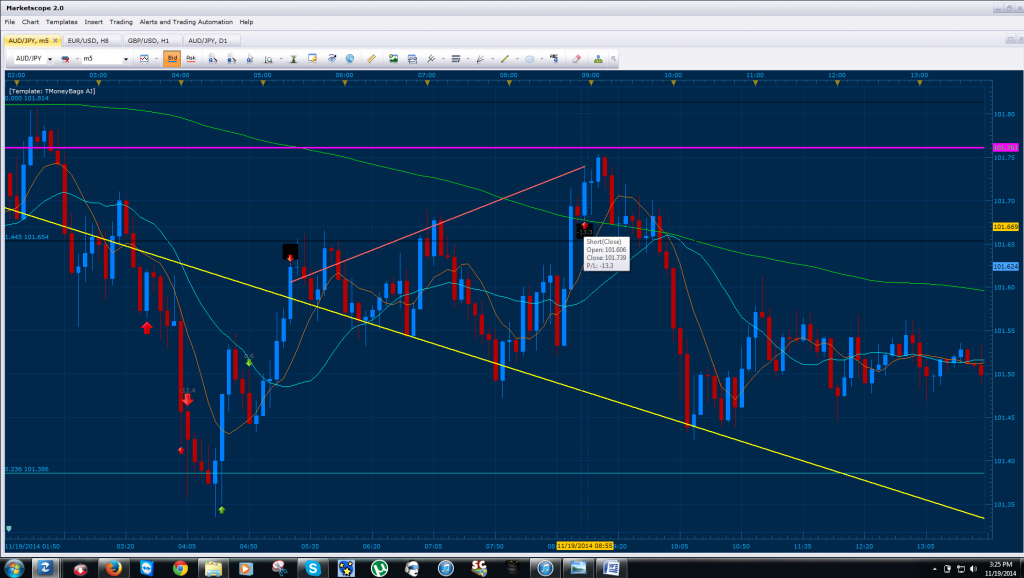
As you can see, our AUD/JPY trade has faked us out and closed negative. After this, I decided to take a nap and wait for the volatility to kick up and show us the direction for today (news).
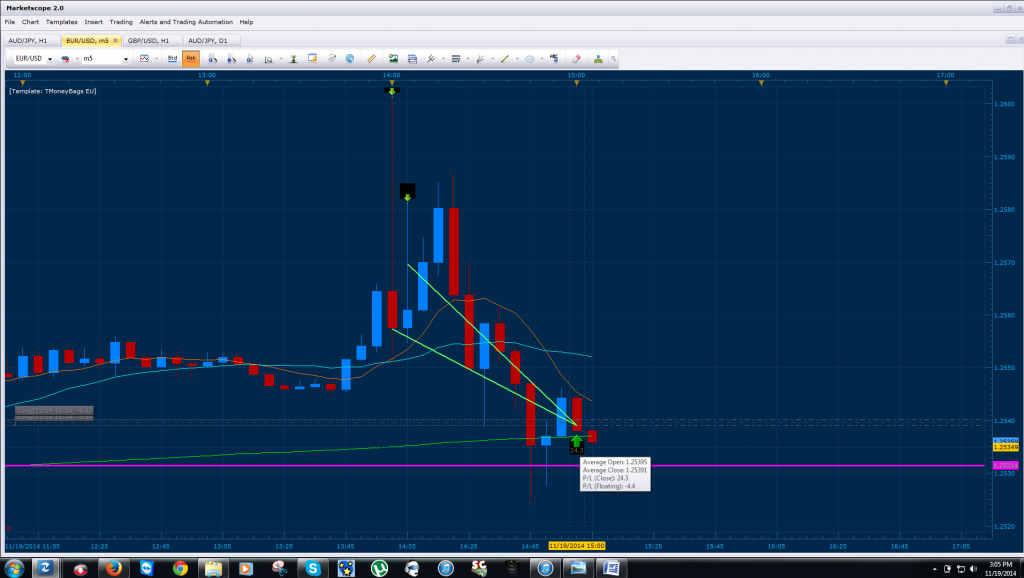
One of my trading partners “watched my back” as I slept and entered the EUR/USD short for a 30 pip scalp as illustrated bellow. ----
I reversed positions on the pair manually, seeing the C to D developing on the 5 min and hourly charts.
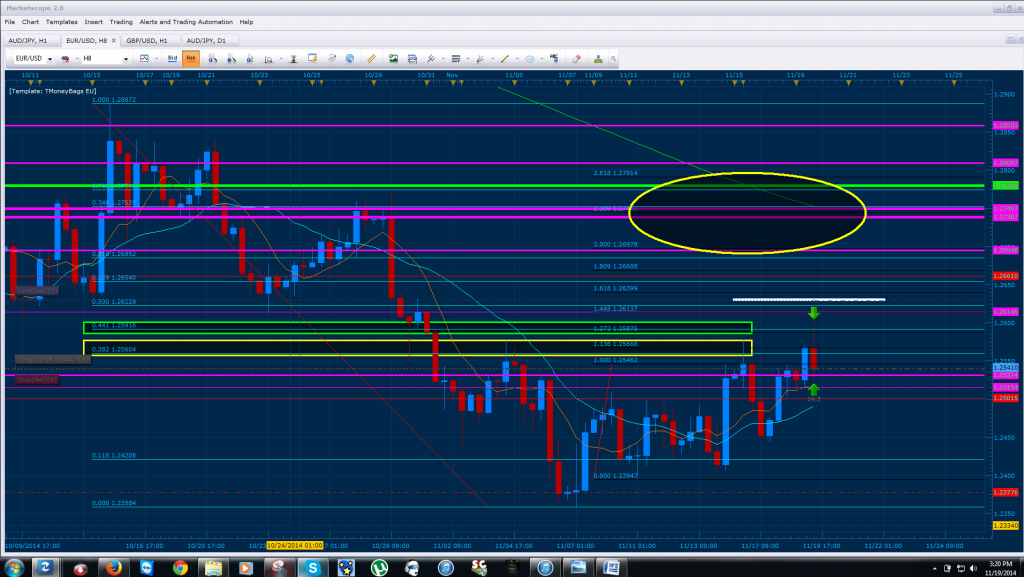
Bellow we have the EUR/USD on the 8 hour chart where our long term projections for the pair shows a bullish continuation towards the 1.26948 - 1.27914 range (yellow Ellipse). We will be taking a 90 pip scalp towards the target illustrated by the white horizontal line (our limit). Notice how our entry on the pair is the break of 100% CD and lands on its retest after hitting the convergence; where the .441 of XA converges with 127% CD.
Here is a close up of the previous fib convergences that have worked. In the yellow rectangle we have the .382 of XA converging with 113.6% CD (wick of price) and 100% CD (Base). This zone lead towards a 118 pip correction. In addition we have the most recent convergence highlighted by the green rectangle, where the .441 of XA converges with 127% CD triggered at 2pm during news release.
Feel free to always ask questions, their is no need to say sorry and I’m back on the thread posting frequently. Also thank you for pointing this out, you’ve made me realize that I made the mistake of not having my physical stop above the wick on the C point. I’ve circled where price broke the B point for the C to D confirmation.
