Cool, I can see that. So with the XA leg, is it typically the more extreme highs/lows you use, the more powerful the signal? I’ll go back through the thread and see if the examples seep into my brain better now that fibs are becoming less scary to me. I redrew the chart with your advice for my own benefit. Thanks!

No, price can’t exceed C it must retrace from there and then form D
Correct! Also, make sure that X is always at an extreme of price and not in the middle of a leg.
Gracias TmB!
I have a question. I have difficulty spotting convergence of fibs. Do they have to match perfectly with wicks and with each other?
Thank you!
once you see XA and draw the fib, how far can the B go in regards to the fib?
What is the maximum and minimum?
B can be a maximum of 100% of XA (this is rare but possible). Their is no rule for the minimum other than that it should always be in between XA. But I much rather you trade a pattern where B at least retraces off the .236 or .382 for symmetry.
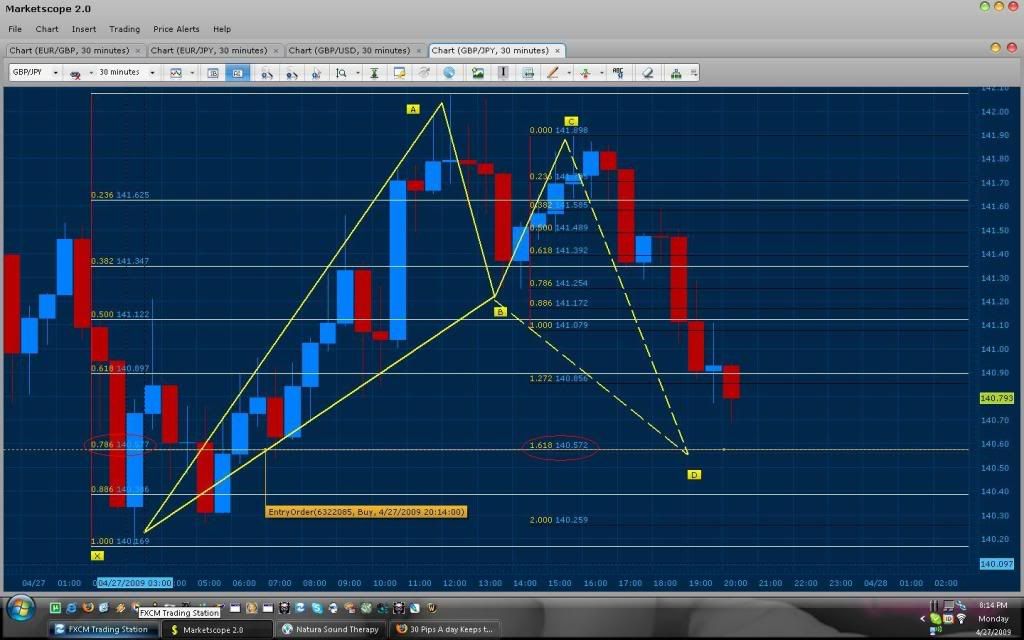
Since it’s 6-8pm and TMoney said that’s when Ds tend to form. So I think I found 2.
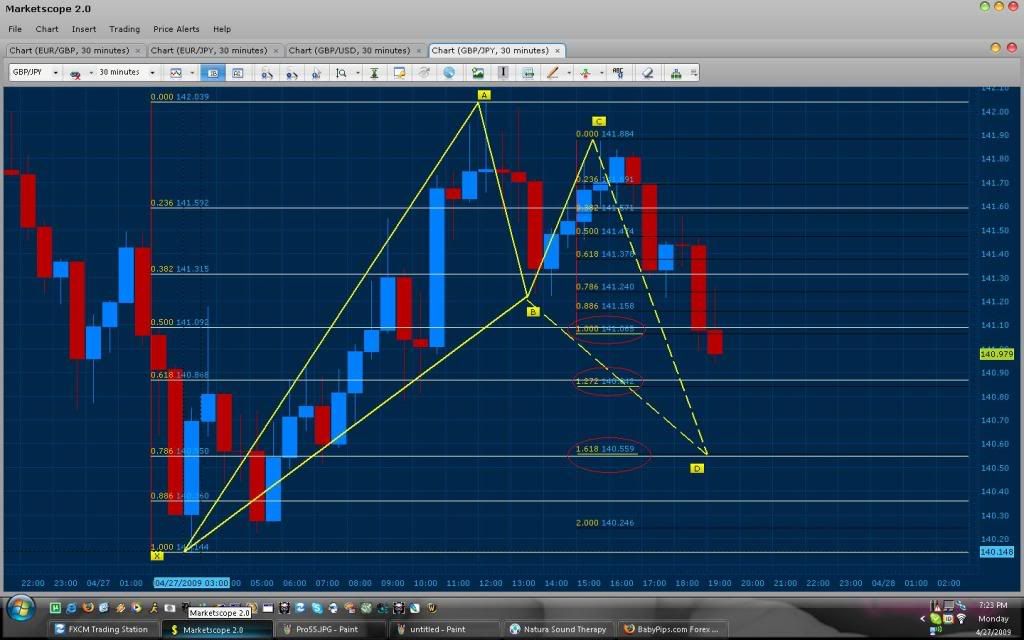
Bullish Gartley GBP/JPY 15 min

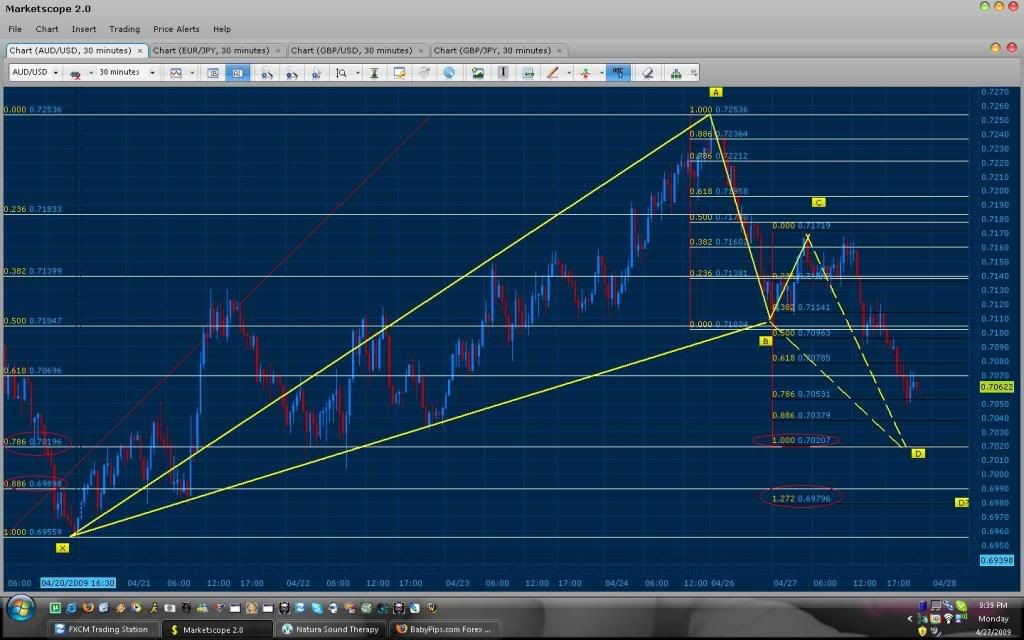
Bearish Gartley? (D is at same spot as X) GBP/USD 30 min

Let me know what you guys think.
Convergence between the percentage of CD (its measurement in relation to AB) and the fib point of XA must be within a 0-10 pip range based on a 30 min time frame. The higher the time frame, the higher the pip range can be. 0 = best 10 = worst
Here is an example of divergence of CD and XA:
Here we notice 3 points of convergence. The first one is at 100% of CD, the second one is at 127% of CD, and the third is on the 161% of CD. Visually you will notice that the convergence of 161% CD and the .786 fib level has the closest proximity. Which in effect signals that yes, you can trade the first 2 convergence, but the optimal choice would be the latter.
*Note: If you are looking for a bullish trade, and your convergence is bellow the XA fib level, typically price will spike bellow the fib level to touch the CD % and then close above the XA fib level. In this and in every case I always suggest that your entry or market order should be exactly on the XA fib level or a few pips above it (in order to make sure the trade goes in depending on the market). On the other hand If I did not need to be in a trade but I wouldn’t mind making an extra 30 pips for the day then in this situation, I would place my entry right on the CD % that’s bellow the fib level and If price spikes down and gets me in then I typically would end up with a perfect wick. If not then I simply did not get into the trade and that is good as well  .
.
Thanks Tmb! Great information!
I see that maybe a new pattern is in its way to complete in the current gbp/usd 30 chart.
It’s the purple one, what do you think. Could it be possible?
Regards!

Corect!  Good D area.

Yes I like your patterns. The first one looks like the pattern we could trade tonight.
I redrew the pattern initially spotted by Geodawg19 on the ASK and noticed that it has perfect convergence. CD 161% converges with .786 of XA.

:eek: Interesting Geodawg19! I’m gonna check my chart again because it’s the only convergence that I see (100% cd) and in your chart I don’t see that convergence!
Hope you can help me with that.
Keep up the good work:)
Regards!
I’m so excited that I actually picked a correct pattern that others found as well! I had this chart all laid out around 5:00 PM today. I had a buy order at 1.4584 with a TP at 30 pips. Unfortunately my order wasn’t triggered, I guess because of the spread and my order location (it looks like it should have just barely put me in the trade), but that’s okay, cause I called it and I’m learning!

The X you used is around .7000 and the one I used is at .6952
Good job on calling that. As for barely missing your spread, ouch lol. I do admit it does happen, which is why we shouldn’t always be so greedy and take into account the spread heheh ;). But some times the fact that you predicted price movement is enough reward, even if you didn’t get the pips in.
Ahh That’s right! The xtreme low!
Thank you!
Thank you for helping out Geodawg. I want you to take note though that on the AUD/USD you have drawn a bullish pattern and it should be drawn on the ASK of price and not the BID (as you have selected). Also I would like you to draw your X from an even more extreme point of price as shown bellow. Here you see perfect convergence at the 100% of CD and .786 of XA. Also take note that the BC leg did not reach the .500 retracement and instead pushed a bit through the .382 and retraced from there. This normally means that price will complete at 100% give you a small bounce and then either whipsaw to the 127% of D and close back at 100% or have a true bounce near the 127% (in this case the .886 of XA). The best convergence is though at the 100%, I’m sure that will give us 30 pips.