A few noob questions lol.
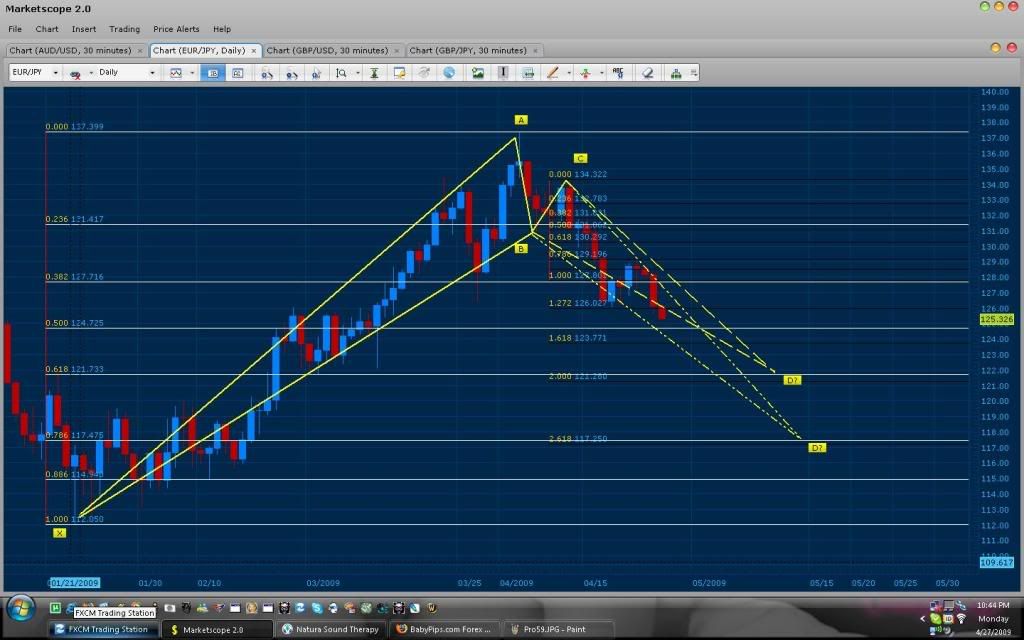
Should i have drawn the XA starting at the yellow rectangle? or the teal circle?
Is the purple circle a good B?
Edit* Also I never figured out what is the difference between a bid/ask chart? lol:o
A few noob questions lol.
Should i have drawn the XA starting at the yellow rectangle? or the teal circle?
Is the purple circle a good B?
Edit* Also I never figured out what is the difference between a bid/ask chart? lol:o
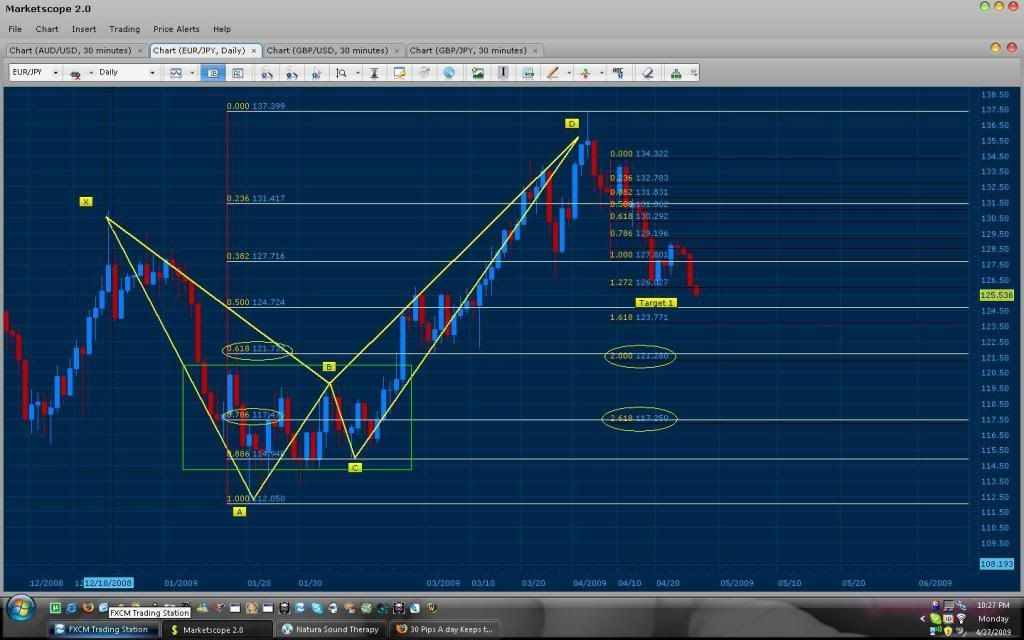
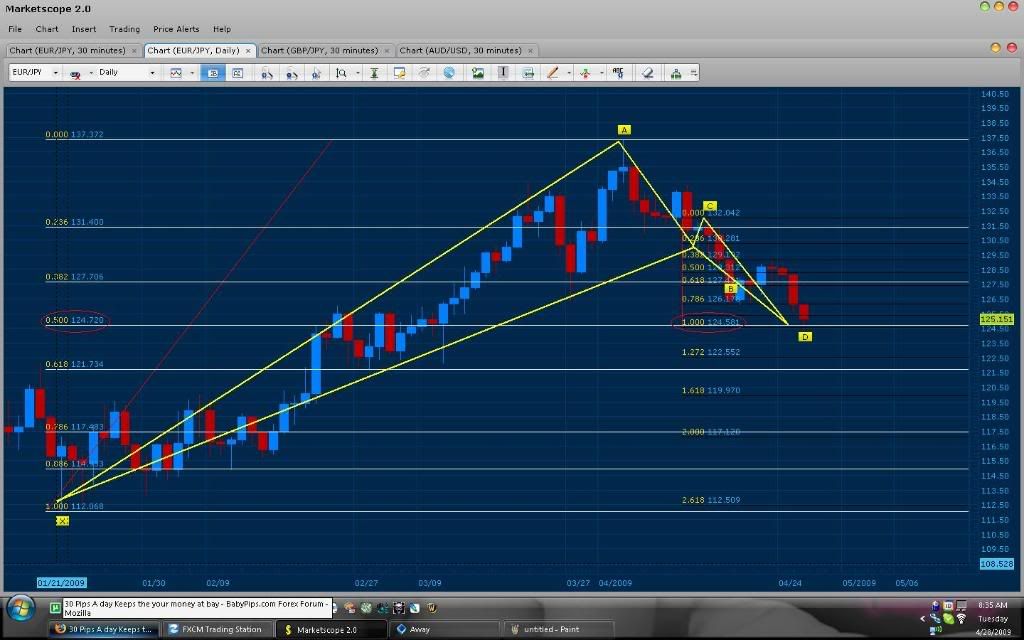
As we all know, since the beginning of the month the the EURO/JPY has been on a downward spiral. This is not at all surprising, because as you can clearly see bellow there was a Butterfly pattern predicting its movement.
Now near the end of the month, we are finally reaching Target 1 and we can expect some support around that price range (124.724 = .500 fib of XA). In addition, there is no divergence in this area so we should expect the downtrend to continue and possibly hit the next 2 levels of resistance and do some significant moves in each one.
For the upcoming pattern on the Daily, 200% of CD converges with the .618 of XA. Further more, 261% of CD does even better convergence with the .786 of XA. In addition, both areas are near a major area of support and resistance level as shown by price history (the green box).
Both X’s work but the Yellow would have been your best choice.
Yes it can be a B but you should try the B C area right before the BIG green bar up (i cant really tell the price levels maybe 1.1500 i guess). Also, it would be good to know the time frame.
Thanks a lot TmB this threat helped me so much so far, and the replies are always so fast, I’m really getting an understanding of the Gartley, soon I will study the Butterfly more 
Cheers
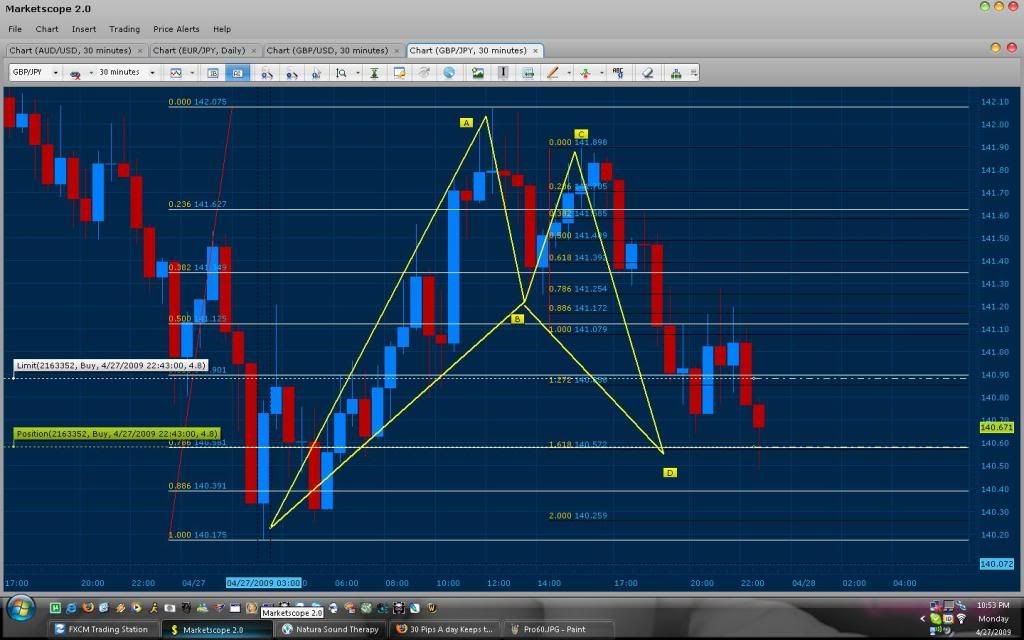
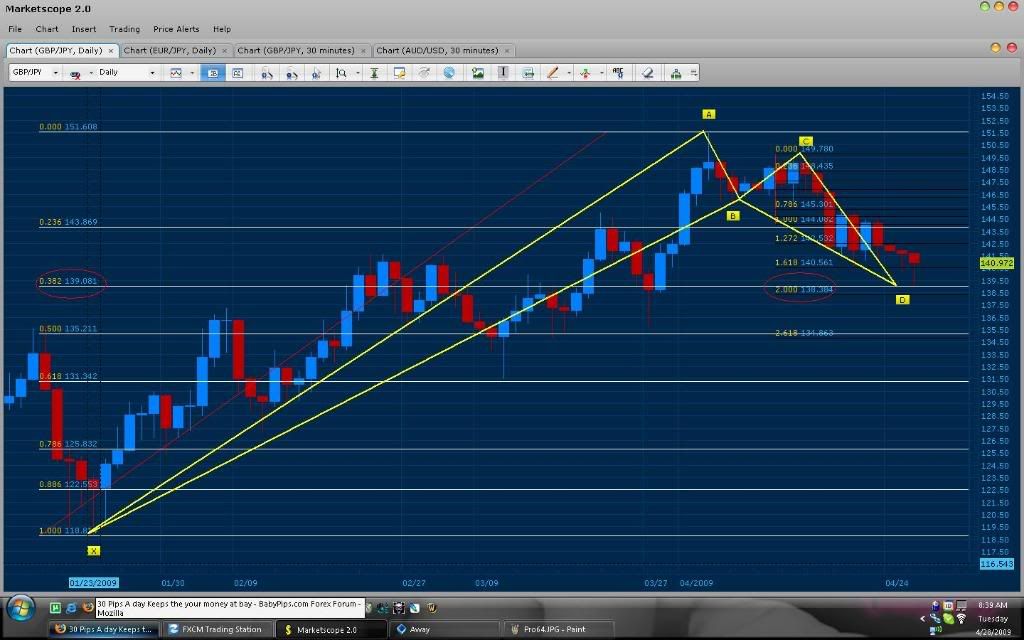
Our GBP/JPY trade has been triggered and it looks like price is respecting the convergence at the area.
The GBP/JPY could still turn profitable, though it seems to be stalling quite a bit. There was such a nice bounce right above the convergence point a few hours earlier, that I was concerned it wouldn’t be able to bounce again when it dropped a few pips lower so I didn’t take the trade.
Yeah definitely a scary pair to trade heh and I do not recommend it to beginners. I will be waiting for a 60 min close on this one. The way the Candles are moving is showing a lot if indecision in the market. Also, the long wicks that are being generated is a good sign of a reversal.
It’s coming up!!! Now this time is before midnight eastern. So this could have been or still could be a fake out correct?
We just past our fake out time 9pm est-11:30pm est. This could be the move up now.
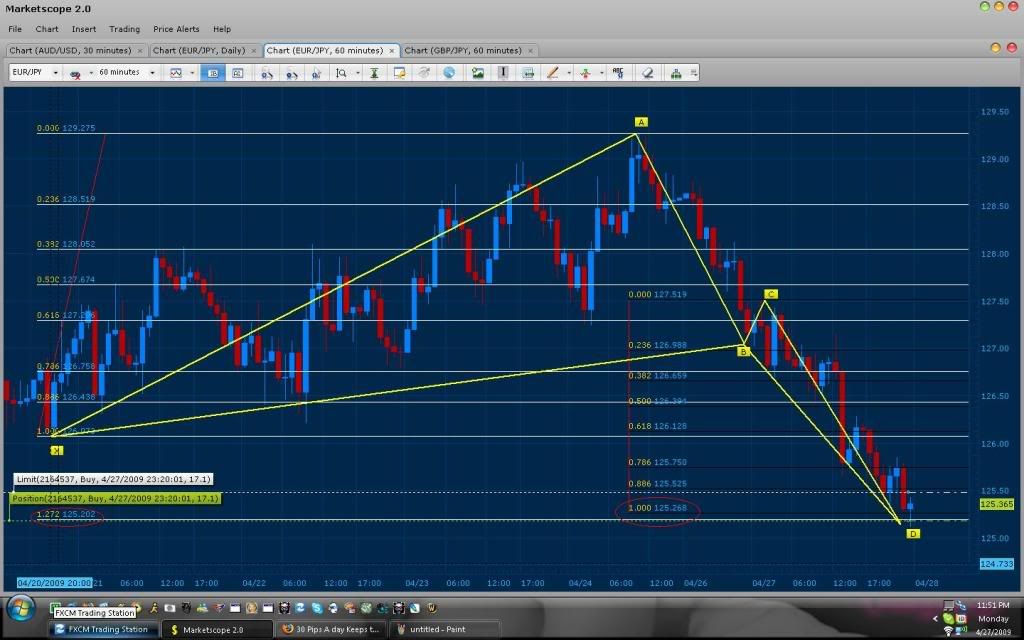
Here’s another trade I am currently in. It’s a Butterfly Bullish pattern where CD 100% converges with the 1.272 of XA. As you can notice, the AD leg has had no true retracement what so ever. What is happening is that the sellers have exhausted themselves and the market is now re-testing the levels it blew through.
Looks like the EURO/JPY is about to hit Target 1 from the Daily pattern. only about 5-10 pips away
That’s not a very nice looking pattern…lol…did you stop out?
I’m in the middle of tax returns tonight which are due on Thurs, so not playing, but I am checking in now & then to see what’s happening. I found an indicator today that actually draws the patterns, but haven’t had much time to work with it.

Yeah your correct. The pattern is not symmetrical at all. I’m am still in it, should have gotten out when both yen trades accumulated 30 pips. I left the trades untended thinking it would hit the limits and am now stuck in this :eek:. Very very stupid of me and I hope you all learn from this mistake (Never Trust Price). Also, I posted earlier that price would reach the point its at now and decided to trade that area to recover the loss on the GBP/JPY. Which was also a huge mistake, I let my sense of fear lead me towards bad judgment.
The yen pairs are at major support levels for the daily so it is reason to not give up on the trade and/or manage it with a lower loss. I’m going to ask my mentor for some help though, I believe in the “in love with the trade” phase and need to snap back and see the clearer picture in the market (Always ask for a second opinion, you might be clouding your judgment in desperate situations).
Last trading session I fell victim to not following my own advice.
Cons:
I traded the “Fake Out” Times I had posted in the beginning of this thread.
I traded a pair which I had not done a full analysis of and only took into account a 30 minute view of the market.
I fell in love with the trade and let it sit negative.
I added to a loss by desperately getting into a second trade to make up for it (Did not fully analyze the situation).
I let my emotions take control of me.
Pro:
I realized what I had fallen victim to and I began the steps to recover.
I woke up my trading partner (who was sleeping waiting for the london session) and he helped me with the recovery.
I did not panic and fully analyzed the market. In effect allowing me to see the reason why price kept going against my favor and see the True patterns that where developing.
Bellow are the True patterns that helped with the recovery and prevention of loss for the account.
EURO/JPY: 100% of CD converged with .500 of XA (Daily Chart).
GBP/JPY: 200% of CD converged with .382 of XA (Daily Chart).
I want you all to take note that the “True D” occurred at 2:30AM on both pairs which is passed the Fake out hours and one of the times when most D’s form. If I would have stuck to my rules and did not ignore them, I would have avoided this whole situation and had a great trading day with out the stress.
My trading partner HMB will be posting the results and how he helped me recover the account. In addition he will be showing his technique of getting out of these type of situations.
Not sure I’m going to trade this one, this pair has been acting a little funny to me, but there is perfect convergence of the 50% of XA with the 200% of AB.
The best thing about this stage of my trading, is that, instead of trading all the time, I’m actually trying to learn more about what happens and why. I haven’t taken a trade yet this week, and that’s huge for me, as I’m used to trying to scalp the heck out of the morning until I’m exhausted and ticked off. Plus, I spent so much time blindly making a trade whenever a few conditions were met, and then being confused when it didn’t go my way.
Your right the convergence is there, but the symmetry in the patterns look bad because of the consolidation. I would follow your advice in this one and see the results rather then taking the risk. Good Job.
TMB I am really glad to hear that you were able to pull it together and recover. I realize it is very helpful to have a trading partner. Thanks for sharing your experience and not just posting the winning trades.
Bank
Hey TMB -
What constitutes good symmetry? Is there a technical way to measure that, or is it more based on how the triangles of the pattern form in relation to each other?
Hi TMB
I paper traded the following pattern this morning, and would like to know whether I had traded it correctly. Is it safe to say that there was convergence at the 100% of XA, giving a high probability trade? That is how I assessed it. It worked out pretty well but I would like to know if I did the right thing.
Thanks!
Bank

Yeah… I want to apologize to all who have been following this thread. Again, I should have followed my own advice and stuck to the trade plan. Even if that meant closing out our first trade negative right after the close (as I should have done), because price will always have an opportunity to allow for recovery.
All in all, I would like every one to note that we did in the end Recover from a huge potential loss and where still able to reach our goal of 30 pips for the day!