The time that it took price to create AB when equal to the time price took to form CD constitutes perfect symmetry. The zig zag’s that the market forms the actual flow of pattern after pattern also adds towards symmetry.
Hey, I’m still refining my ability to draw fibs correctly. Does this look correct? Should I put the X a little further to the right? Is the red circle a good D?
(The red circle is 200% convergence with 88.6)
Thanks!
P.S. How can I upload the charts without having to make them look so small and blurry? 

[QUOTE=BankDaPips;103641]Hi TMB
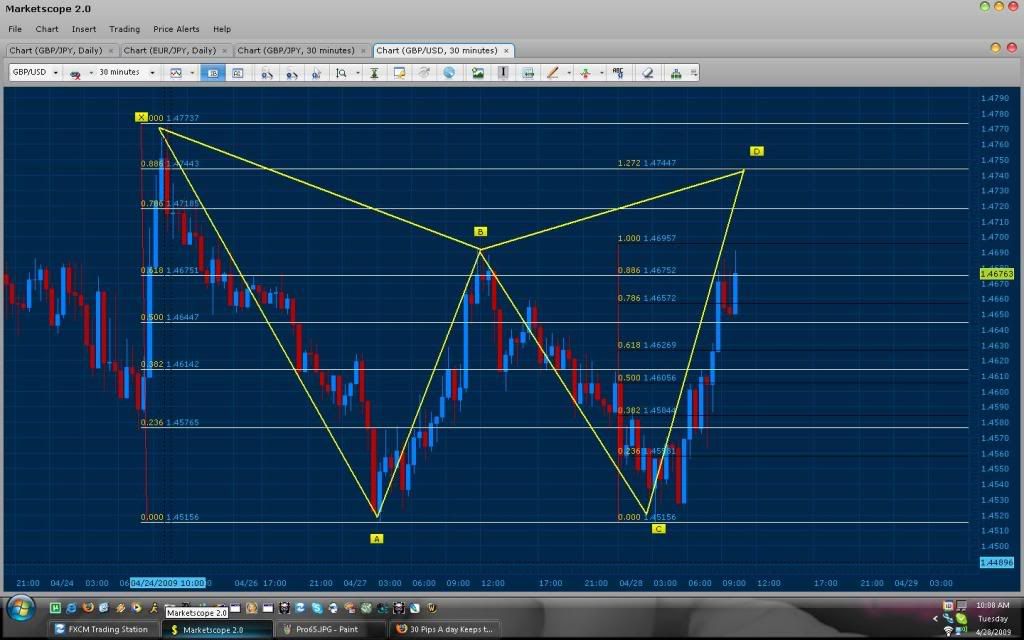
I paper traded the following pattern this morning, and would like to know whether I had traded it correctly. Is it safe to say that there was convergence at the 100% of XA, giving a high probability trade? That is how I assessed it. It worked out pretty well but I would like to know if I did the right thing.
Thanks!
Bank
…/QUOTE]
Yes this is a rare pattern that formed and I am surprised that you cached it, congratulations (Even though the convergence seemed iffy).
Bellow is the upcoming pattern for the pair, using your XA as AB. Also notice how as a simple ABCD it bounced off the 100% (as it should). But the convergence to make it a true gartley is at 127% of CD and the .886 of XA.
Hey Ogna,
When you save your image, visit an image hosting site such as imageshack. Upload the image and choose a resize option. You will be given a URL for the image. Copy it. Click the insert image button when typing your post and paste the URL in the popup that appears.
Bank
I traded this one with a 20 pip stop loss. my stop was hit within a minute! Maybe it was too close, as price came back and is now in the favor of the trade. Oh well, I’m trading micro lots right now as I learn this so I’m keeping most of the emotion out of it (something I’ve struggled with since I started trading!).
TMB - I’m ready for the critique!
Thanks very much TMB…I see how important it is to zoom out the charts so you can see bigger patterns. Will set some price alerts.
Bank
Yes, if C where to retrace and pass D (not make any new low) then we can say that CD will be converging at that area. Your XA is correct, the possible convergence is as well. But were too early in price to say that this is the pattern forming (CD should be above B before were sure of prediction). But good job, your getting the hang of it and to make note of this heh, here is a possibility of where the EURO/GBP will go if price continues the up trend.
The following is a possible Daily pattern for the EURO/GBP
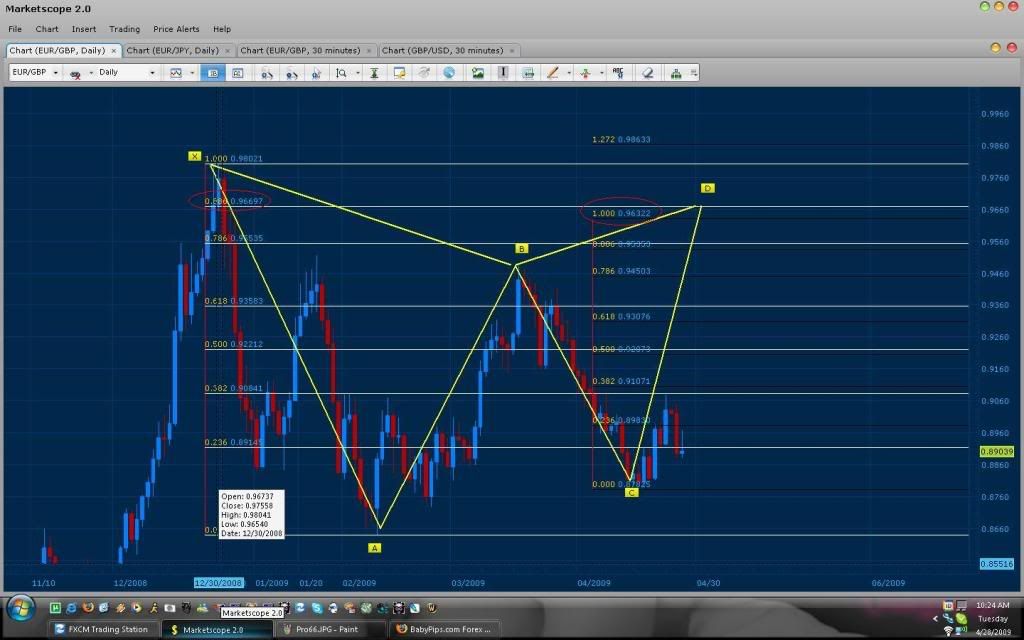
Hey again, I tried to make the chart clearer. Does the red circle look like a good D?
Is everything correctly drawn?
Thanks!
Edit* SORRY for posting again, i didnt see the reply haha >.<

Heh yeah, this happens quite often. It is the reason why I wait for a close above (Bearish pattern) or bellow (Bullish Pattern) my fib level when trading the JPY pairs. The yen pairs are known for this type of volatility (1-5 sec hit stop then back to base price).
Nice Lavaman!!!
Hi TMB
I realize that I am bit limited with the fib levels on my platform, so I downloaded marketscope. How do i add the 786 and 886 levels?
[I]**** Not to worry, figured it out! ****[/I]
Bank
Hey TMB,
I wanted to ensure that I could see that pattern on my own, so I went and downloaded marketscope. Turns out that I realize that because VT Trader limits the number of fib levels you can have, my results were skewed. The minute I setup on scope I was able to draw my patterns and identify the convergence. I am happy!!! 

Hahahahahah I know!!! In fact this is the very first time that I find that trading forex can be fun! I’m like a little boy in kindergarden, although I think my teacher is like three years younger than me.
One thing I like about this method is that it teaches you patience…you have to [B]wait[/B] for price to reach the D target because if it does, then chances are it’s a true pattern. But on the other hand, one needs to resist the temptation to anticipate that it will go to D and take a trade in that direct while waiting which I think is a stage some traders might entertain.

1 Like
Great point Sweet Pip, that’s been one of my biggest hurdles in trading, anticipating signals and getting in too early. With this, I can set my buy/sell order and just wait, knowing that it’s not a true pattern if I’m not triggered into the trade.
SweetPip has been reading my mind :D. Thing is, I continue to use my Candle+STARC rules as I wait.
Bank
Actually to me this method is a relaxing one. Since you spot your D’s (wich is fun), you can watch the market by the time they’re supposed to be formed and your entries are not in a rush like in other methods.
I think it elimites the stress of trading.
That’s fine as long as you have a reason to take a trade…lol…but if not and the [B]only[/B] reason to enter is in anticipation of D then one might find themselves in trouble.
I agree SweetPip…Patience on a whole pays in trading.