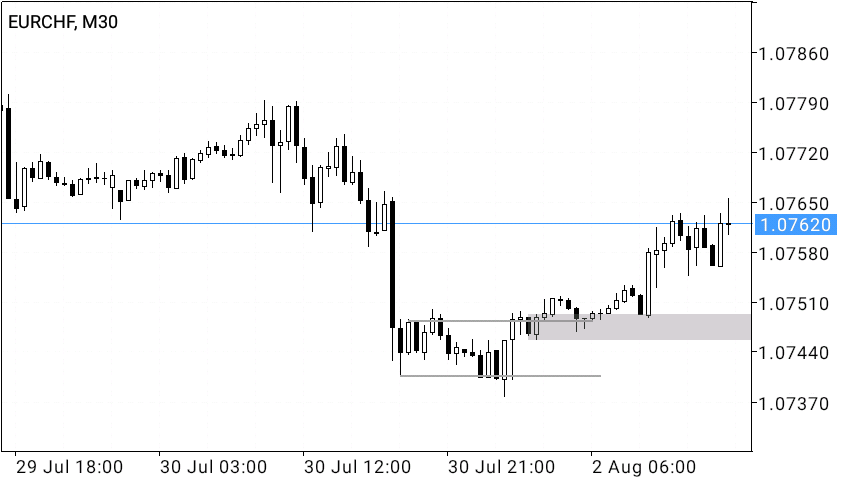
Just some added evidence this was an accumulation accompanied by a spring
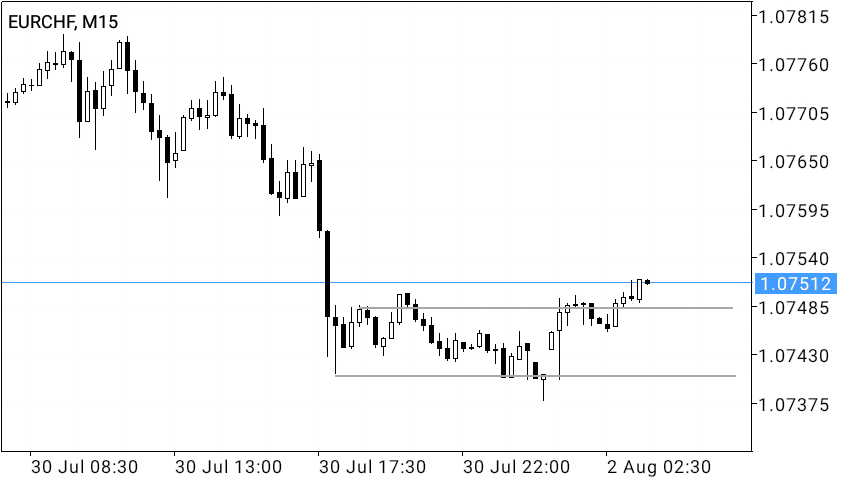
EURCHF M15
This is current running diary; 1:1 profit closed, allowing the trade to mature from here.
EURCHF M30 Updated
EURCHF ended up a loser although 1:1 was taken so overall it was a net zero trade. Although there is accumulation on <H1 going on. Keeping a close eye.
Currently, there’s a million dollar setup on GBPJPY. Price is retracing into the daily timeperiod demand zone as seen below
GBPJPY DAILY RBR;
We’ve had a great reaction from the bulls on H4 already. A strong bullish pin bar close, traders like @Pinbar1993 & @Alg626 would find such quite compelling
GBPJPY H4
You know me so well…lol
Yes, nice big rejection of price. Looks like it might have been a fake out to the sellers.
Only concern that it’s been in a downtrend the last two months. I would take some profit earlier and move my stop up.
Also moved up pretty good from the last pin off this zone and few days ago.
On the lower timeperiod, demand seems to have won the battle for dominance.
We have had a clean spring, marking a victorious campaign for bulls.
GBPJPY M30 accumulation
I have my limit order resting in the marked zone within the spring.
SL is set below the swing low(spring)
I forgot to click send earlier
@PegasusIllusions
If it were me, I would stay out of this deal. I approach from D1 and only trade when the price approaches close to the S/R level for a higher probability entry.
Here is one example:
I spotted the price approaching the S/R level of the pre-drawn D1. I then switch to H4 looking for a buy entry if price rejects, or if price breaks, wait for the return to test the old S/R level and find a sell entry.
Here I found a bearish rejection pin at h4, I bought here, ratio R:R = 1/3
EURJPY Running Diary; Price is still looking bullish, had an excellent reaction to a last point of support. I’m not adding into the trade (original position was taken from 128.713)
EURJPY H4 LPS
**Potential higher low forming on daily
EURJPY Daily HL?
If you look at M30 & H1, price has formed a break of bearish structure after establishing a spring reaction from H4 lps demand zone.
This includes GBPJPY - which will be testing lps of the minor accumulation it formed yesterday…still bullish leaning. CADJPY also had a positive reaction to demand almost similar to EJ.
A daily zone I’m watching currently. Not a huge fan of this pair, but I’ll wwatch for bullish price action
EURGBP DAILY BULLISH ENGULF DMD;
Today I’ll share a case study of a trade setup I took last week on the Binary options broker’s synthetic indices.
Case Study 2: Volatility 50 Index - Distribution
This M30/15 distribution range actually makes up a daily bearish pin bar I found on the daily timeperiod, see below
Daily Bearish Pin Bar
Happens to have been within a weekly timeperiod supply zone, which made it very viable
Currently, I’ve managed to close half of the position at a very dear return
Volatility 50 Index Running Diary;
Stops were kept above the swing high (the wick of the daily pin bar). The trade was executed by a limit order after spotting the distribution schematic on M15-30 . The order was left at the lpsy (last point of supply), see the schematic diagram above
Building from the setup shared on EURGBP daily chart above, I’ll be withdrawing my interest to go long from the zone.
Reason being, the trend is looking quite bearish in the macro picture. A quick look at the chart below will tell you
EURGBP MONTHLY
The chart above shows misbehaving price action really, one can’t make a good conclusion on it
Below is to add emphasis on how “…lines will give a lot of information on sideways price action” like the one above.
EURGBP DISTRIBUTION SCHEMATIC - MONTHLY
Where I’ve marked "majorSOW" is where I believe price is headed. Issue really is figuring out how to join in on the emerging trend.
I imagine price will most probably react to the current area of demand just so it can keep dropping, but the demand zones below current demand should trap a lot of buyers.
Two things to note from the image above; the demand zone around 0.82340 and the equal lows just below it.
The equal lows give me the idea that price might want to sweep below them before any reasonable rally.
This is around the imbalance that leads to 0.79400 where there’s a potential demand zone as well.
Keeping some dry powder for developments on this one.