DAILY TECHNICAL OUTLOOK ON GBP/USD
28 Aug 2013 01:00GMT
Trend Daily Chart: Sideways
Daily Indicators: Turning down
21 HR EMA: 1.5543
55 HR EMA: 1.5558
Trend Hourly Chart: Sideways
Hourly Indicators: Turning up
13 HR RSI: 46
14 HR DMI: +ve
Daily Analysis: Consolidation with upside bias
Resistance
1.5696 - Last Tue’s high
1.5638 - Last Fri’s high
1.5592 - Y’day’s high
Support
1.5482 - Y’day’s low
1.5423 -Last Wed’s low
1.5392 - Aug 06 high
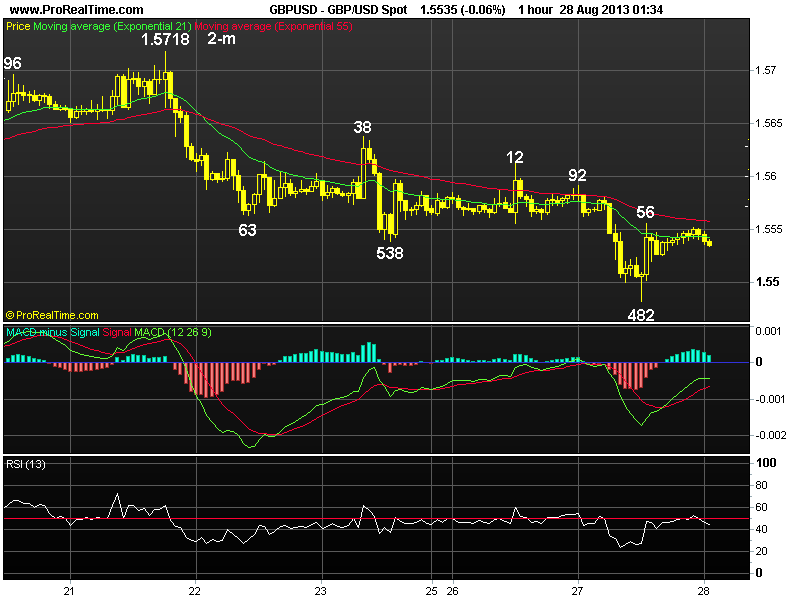
. GBP/USD - 1.5538 … Although the pound traded sideways in Asia on Tue, traders gave sterling a broad-based bashing at European open, price easily penetrated last Fir’s low 1.5538 n tumbled to 1.5482 at NY open, dlr’s renewed weakness due partly to escalation of Middle East tension lifted cable to 1.5556 .
. Cable’s rebound fm 1.5582 signals decline fm last Wed’s 2-month peak at 1.5718 has made a temporary bottom there as this low was accompanied by ‘bullish convergences’ on the hourly oscillators n choppy consolidation is envisaged in next 1-2 days. Looking at the bigger picture, sterling’s aforesaid retreat fm 1.5718 signals the 3-legged erratic rise fm Jul’s 3-year trough at 1.4814 has possibly made a temporary top there n breach of 1.5423 sup wud add credence to this view, then further subsequent weakness to 1.5373 wud be seen, this is a ‘minimum’ 38.2% r of aforesaid upmove fm 1.4814.
. Today, expect initial sideways trading in Asia n as long as 1.5510/20 holds, upside bias remains for a retracement of the said decline fm 1.5718 twd 1.5612 but res 1.5638 wud cap upside. Below 1.5582 may risk 1.5423 b4 rebound.
DAILY TECHNICAL OUTLOOK ON GBP/USD
10 Oct 2013 03:18GMT
Trend Daily Chart : Sideways
Daily Indicators : Turning down
21 HR EMA :1.5977
55 HR EMA :1.6023
Trend Hourly Chart : Down
Hourly Indicators : Rising fm o/s
13 HR RSI : 37
14 HR DMI : -ve
Daily Analysis : Consolidation b4 one more fall
Resistance
1.6070 - Tue’s NY low
1.6006 Last Fri’s low
1.5968 - Y’day NY res
Support
1.5916 - Y’day’s low
1.5886 - Sep 17 low
1.5844 - 50% r of 1.5427-1.6260
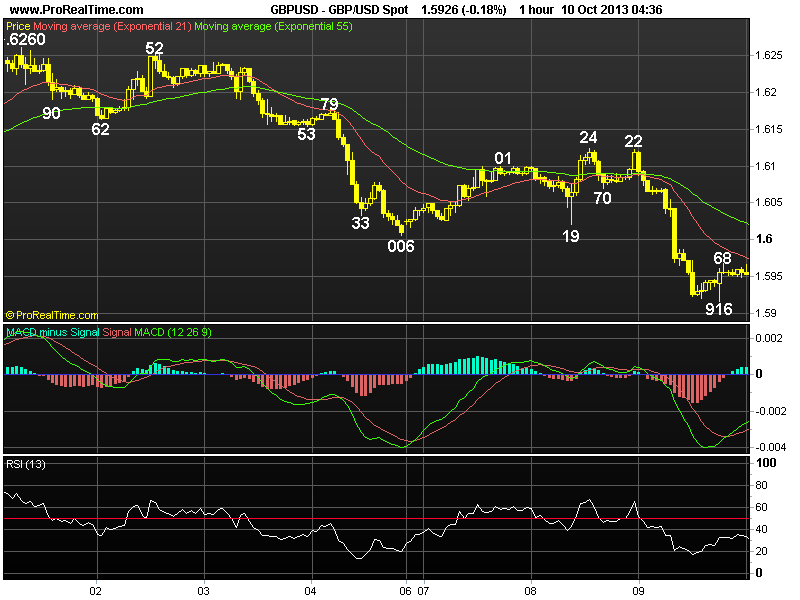
. GBP/USD - 1.5960..Cable’s traded wildly initially y’day as news of nomin-
ation of Fed Vice Chair Yellen as next Fed Chief led to a bout of dlr-buying in
Aust., price bounced to 1.6122 but quickly fell in Asia. Intra-day fall accele-
rated after weaker-than-expected U.K. prod. data n cable tanked to 1.5916 in NY.
. Y’day’s selloff to 1.5916 has justified our weekly bearish view that MT
rise fm Jul’s 3-year low at 1.4814 has made a top last week at 1.6260 (Tue) n as
indicated in previous update, cable’s aforesaid fall fm 1.6260 is at least cor-
recing MT intermediate rise fm 1.5427, since price has already reached the ‘mini
mum’ 38.2% r obj. at 1.5942, next downside target is pointing at the ‘natural’
50% r obj. at 1.5844, a daily close below there wud turn outlook even more bear-
ish for further selloff to 1.5708 (38.2% r of 1.4814-1.6260).
. Today, the o/n rebound fm y’day’s post-FOMC low at 1.5916 suggests the
pound wud gain some respite in Asia n range trading is in store, as price is tra
ding below the 21-hr & 55-hr emas, downside bias remains for decline fm 1.6260
to extend twd next chart obj. at 1.5886 but 1.5844 shud remain intact.
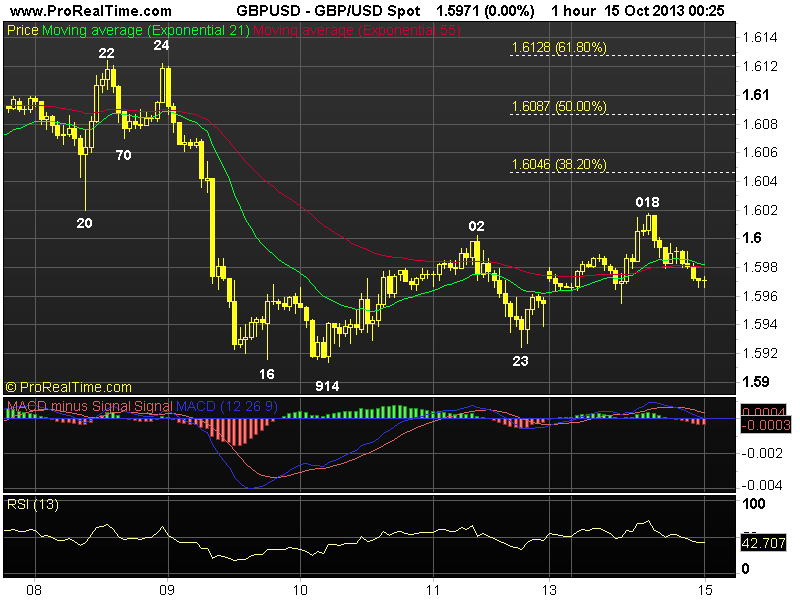
[B] DAILY TECHNICAL OUTLOOK ON GBP/USD
15 Oct 2013[/B] [I]00:51GMT[/I]
[B]Trend Daily Chart [/B] :Sideways
[B]Daily Indicators [/B]:Turning down
[B]21 HR EMA [/B] :1.5982
[B]
55 HR EMA[/B] :1.5980
[B]Trend Hourly Chart [/B]:Sideways
[B]
Hourly Indicators[/B] :Neutral
[B]13 HR RSI[/B] :41
[B]14 HR DMI[/B] :-ve
[B]Daily Analysis[/B] : Consolidation b4 one more fall
[B]Resistance [/B]
1.6070 - Last Tue’s NY low
1.6046 - 38.2% r of 1.6260-1.5914
1.6018 - Y’day’s high
[B]Support[/B]
1.5914 - Last Thur’s low
1.5886 - Sep 17 low
1.5844 - 50% r of 1.5427-1.6260
. [B]GBP/USD - 1.5968 [/B]… Trading cable proved to be tricky y’day as despite
initial weakness to 1.5955 in European morning, renewed buying lifted the pair n
to a session high at 1.6018 in NY morning. However, the British pound pared its
gains and dropped to 1.5979 in NY afternoon n then 1.5966 ahead of Asian open.
. Despite y’day’s rebound to 1.6018, as mentioned in previous updates,
cable’s early fall below 1.6006 sup (now res) to 1.5914 last Thur suggests MT
rise fm Jul’s 3-year low at 1.4814 has made a top at 1.6260 n as long as 1.6046
(38.2% r of 1.6260-1.5914) holds, downside bias remains for said fall fm 1.6260
to at least correct the MT intermediate upmove fm 1.5427 n yield weakness to 50%
r target at 1.5844, a daily close below there wud retain bearish scenario for
further losses twd 1.5708 (38.2% r of 1.4814-1.6260). On the upside, abv 1.6046
res wud abort bearishness n risk stronger gain to 1.6076 (last Tue’s NY low) but
res at 1.6122/24 shud remain intact.
. Today, in view of aforementioned bearish scenario, selling cable on intra-
day recovery for a re-test of sup 1.5914 is favoured.
DAILY TECHNICAL OUTLOOK ON GBP/USD
24 Oct 2013 01:03GMT
Trend Daily Chart : Up
Daily Indicators : Neutral
21 HR EMA : 1.6172
55 HR EMA : 1.6172
Trend Hourly Chart : Sideways
Hourly Indicators : Rising fm o/s
13 HR RSI : 43
14 HR DMI : -ve
Daily Analysis : Consolidation b4 marginal fall
Resistance
1.6260 - 01 Oct high
1.6225 - Last Fri’s high
1.6181 - Mon’s high
Support
1.6119 - Y’day’s low
1.6064 - Last Wed’s high, now sup
1.6010 - Last Tue’s high, now sup
. GBP/USD - 1.6195… Despite edging higher to 1.6258 in Asian morning on
Wed, failure to penetrate Oct’s 1.6260 top triggered profit-taking. Cable tanked
in early European morning b4 extending fall to session low of 1.6119 after MPC
minutes. The pound later pared its losses n rebounded to 1.6176 in NY afternoon.
. Looking at the hourly n daily charts, as y’day’s rise to 1.6258 was accom-
panied by bearish divergences on the hourly indicators, subsequent selloff to
1.6119, which also happened to be the minimum 38.2% r of 1.5894-1.6258 suggests
price wud consolidate below Oct’s 1.6260 top n choppy trading with downside bias
remains. However, as mentioned in our previous update, cable’s rally fm 1.5894
signals upmove fm Jul’s 3-year trough at 1.4814 has resumed n abv 1.6260 wud
extend to 1.6310/11 (Sep 2012 peak n 50% proj. of 1.5427-1.6260 measured fm
1.5894 respectively) but price wud hold well below 2013 peak at 1.6380.
. Today, we are holding a short position in anticipation of weakness to
1.6100 but 1.6076 (50% r of 1.5894-1.6258) shud hold. Only a daily close abv
1.6225 wud confirm correction fm 1.6258 is over, yields 1.6258/60.
DAILY TECHNICAL OUTLOOK ON GBP/USD
25 Oct 2013 00:47GMT
Trend Daily Chart : Up
Daily Indicators : Neutral
21 HR EMA : 1.6189
55 HR EMA : 1.6182
Trend Hourly Chart : Sideways
Hourly Indicators : Neutral
13 HR RSI : 55
14 HR DMI : -ve
Daily Analysis : Consolidation b4 marginal fall
Resistance
1.6310 - Sep 21 2012 high
1.6260 - 01 Oct high
1.6223 - Y’day’s high
Support
1.6119 - Y’day’s low
1.6064 - Last Wed’s high, now sup
1.6010 - Last Tue’s high, now sup
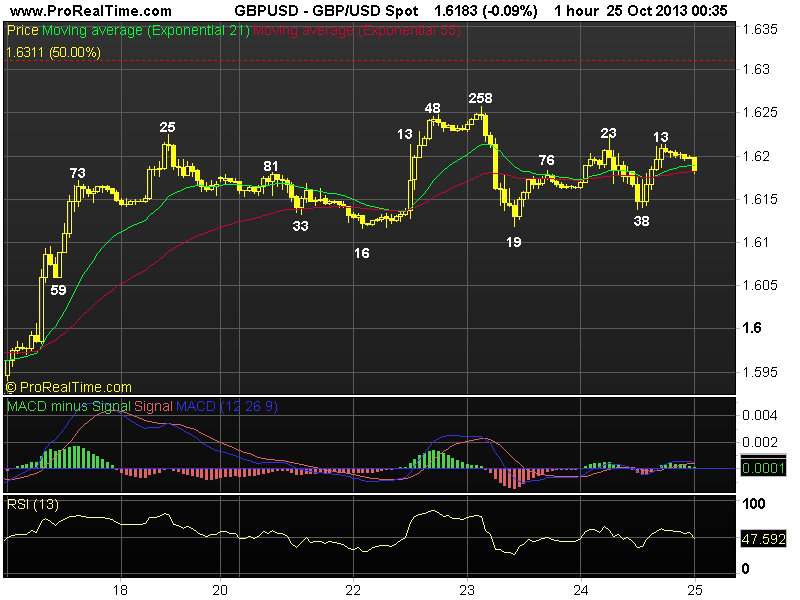
. GBP/USD - 1.6187.… The British pound proved to be a little tricky to trade
y’day as despite initial bounce to 1.6223 in European morning, price retreated
sharply to 1.6138 at NY open. However, cable pared its losses n staged a strg
recovery to 1.6213 in NY afternoon b4 falling again at Asian open.
. Y’day’s choppy trading suggests price wud be confined inside nr term range
of 1.6119-1.6258 for today n consolidation with mild downside bias wud be seen
but said lower lvl wud hold. Looking at the bigger picture, as mentioned in our
previous update, cable’s rally fm 1.5894 to 1.6258 on Wed signals upmove fm
Jul’s 3-year trough at 1.4814 wud resume soon n abv Oct’s peak at 1.6260 wud
extend gain to 1.6310/11 (Sep 2012 peak n 50% proj. of 1.5427-1.6260 measured fm
1.5894 respectively) next week/early Nov but price wud hold well below 2013 peak
at 1.6380 due to loss of momentum.
. Today, we are holding a short position in anticipation of a re-test of
y’day’s low at 1.6138 but sup at 1.6116/19 shud hold n yield rebound. Only a
daily close abv 1.6223 wud abort near term bearish bias on the pound.
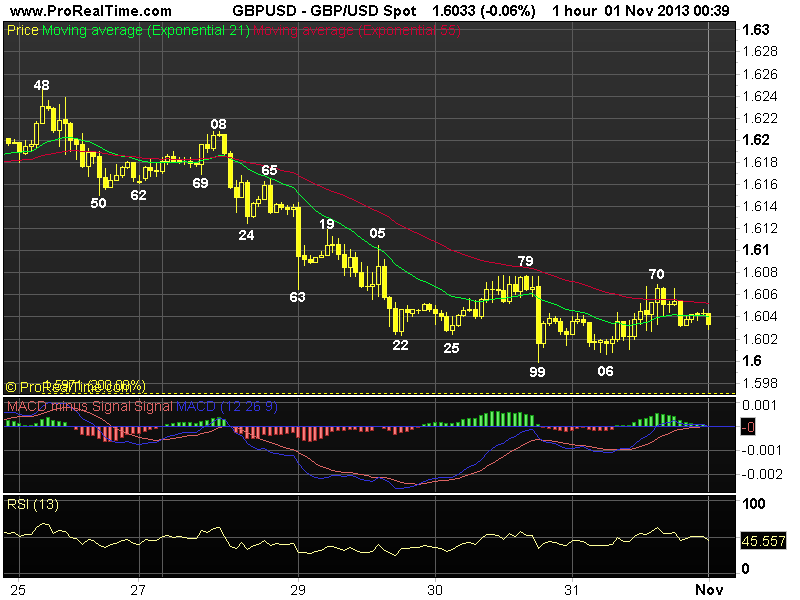
DAILY TECHNICAL OUTLOOK ON GBP/USD
[B]01 Nov 2013[/B] [I]01:34GMT[/I]
[B]Trend Daily Chart[/B] Sideways
[B]Daily Indicators[/B] Turning down
[B]21 HR EMA [/B] 1.6041
[B]55 HR EMA[/B] 1.6053
[B]Trend Hourly Chart[/B] Near term down
[B]Hourly Indicators[/B] Neutral
[B]13 HR RSI [/B] 49
[B]14 HR DMI[/B] -ve
[B]Daily Analysis [/B] Consolidation with downside bias
[B]Resistance [/B]
1.6165 - Hourly res, Oct 28
1.6119 - Last Wed’s low, now res
1.6079 - Y’day’s high
[B]Support[/B]
1.5999 - Y’day’s low
1.5940 - Oct 17 low
1.5894 - Oct 16 low
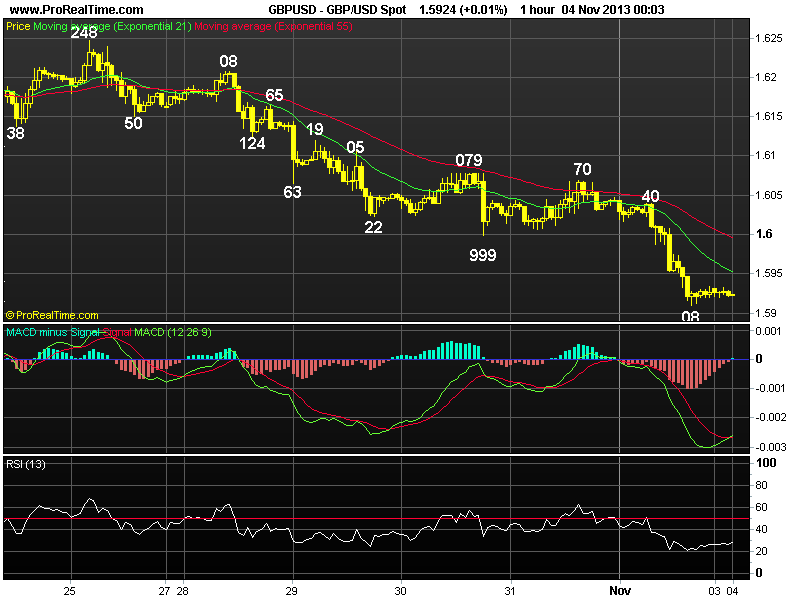
. [B]GBP/USD - 1.6025[/B]… Despite initial weakness to 1.6006 ahead of European opening, failure to penetrate Wed’s low at 1.5999 prompted active short-covering n price rebounded to 1.6070 due to cross-buying of gbp vs eur in NY morning. However, renewed selling interest pushed cable back down to 1.6031 nr NY close.
. The outlook remains pretty much the same as our prev. update. Looking at the daily n hourly charts, this week’s selloff to 1.5999 (Wed) suggests near
term rise fm 1.5894 (Oct 16 low) has ended at 1.6258 last Wed n consolidation below Oct’s near 9-month high at 1.6260 wud continue with downside bias. The price action fm 1.6260 cud also be unfolding into a triangle (a-leg at 1.5894, b-leg 1.6258 n present decline is the c-leg), if this view holds true, then then 2-3 more weeks of choppy sideways trading is in store.
. Today, in view of abovementioned scenario, we are holding short for weakness to 1.5975, however, 1.5964 (80.9% r of 1.4894-1.6258) wud hold n yield recovery. On the upside, only abv 1.6119 wud abort bearishness on the pound n risk stronger gain to 1.6165 next week.
*** T.G.I.F. ***
WEEKLY TECHNICAL OUTLOOK ON GBP/USD
03 Nov 2013 23:53GMT
Trend Daily Chart: Sideways
Daily Indicators: Turning down
21 HR EMA :1.5955
55 HR EMA : 1.5998
Trend Hourly Chart : Near term down
Hourly Indicators : Rising fm o/s
13 HR RSI : 27
14 HR DMI : -ve
Daily Analysis : Consolidation with downside bias
Resistance
1.6040 - Last Fri’s European high
1.5999 - Last Wed’s low
1.5953 - Last Fri’s European low
Support
1.5894 - Oct’s low (16th)
1.5818 - 38.2% r of 1.5102-1.6260
1.5753 - -Jun 17 high
. GBP/USD - 1.5923 .… Although cable also fell in tandem with eur/usd last week, active selling of eur/gbp cross limited sterling’s downside some what, price weakened to a fresh 2-week low of 1.5908 on Fri.
. Looking at the daily chart, despite the recent volatile broad sideways
move inside recent 1.5894-1.6260 range, anticipated selloff in the euro suggests cable wud also come under selling pressure in this week, a breach of 1.5894 wud confirm MT rise fm 2013 3-year trough at 1.4814 (Jul) has indeed formed a top earlier at 1.6260 on the 1st day of Oct n correction of the intermediate rally fm 1.5102 wud knock the pound to 1.5818, being a ‘minimum’ 38.2% r, a daily close below there wud send price lower twd 1.5681 (50% r) later this month. In view of abv bearish scenario, selling cable on recovery is favoured n only a daily close abv 1.6079 wud prolong consolidation, risk 1.6119/24.
. Today, expect initial sideways trading in Asia as Tokyo market is closed
n reckon 1.5953 wud cap intra-day recovery n yield test of said daily sup at
1.5894, break wud extend recent erratic fall to 1.5840/50.
[B]‘WEEKLY’ ELLIOTT WAVE ANALYSIS ON GBP/USD
15 Nov 2013[/B] [I]16:02GMT[/I]
. [B]GBP/USD - 1.6091[/B] … Despite cable’s impulsive rally fm Jul’s 3-year low at 1.4814 to as high as 1.6260, subsequent retreat to 1.5854 suggests minor consolidation wud be seen b4 rising further to 1.6380 res n possibly twds 1.6491 later, however, key daily res at 1.6747 shud hold on 1st testing.
. Let’s recap the previous count, decline fm 2012 Apr’s peak at 1.6747 marked the terminus of a triangle C-leg (see the larger degree wave count below), D-leg:1.6747-1.5234 n E-leg:1.5234-1.6380, subsequent selloff fm there has developed into a 3-legged decline n has ended at 1.4814 in July, current rally fm there is impulsive with wave 1.4814-1.5435: 2:1.5102 n wave 3 is now unfolding n gain to 1.6344/80 (2 times ext. of 1.4814-1.5435 measured fm 1.5102 n chart res), abv wud encourage for further rise to 1.6491 (2.236 times extension) but 1.6728/47 (2.618 times extension n 2012 Apr’s peak) wud hold.
On the downside, only below 1.5718/53 (prev. sup, now res) wud signal a temporary top is made n risk stronger retracement twds Sep's low at 1.5427.
------------------- *** LARGER DEGREE WAVE COUNT *** ---------------------------
[I][B]21 NOV 2011…[/B][/I] Cable’s 3-legged rise fm 1985 record low of 1.0370 signals an (A)-(B)-© wave has completed at 2.1162 (07’), the subsequent impulsive decline is an x-wave with wave (3) bottom at 1.3500, the choppy consolidation fm there is turning into a triangle with A-1.7044, B-1.4228, C-1.6747, D-leg is either ended at 1.5234 or may extend weakness to 1.4690-1.4781 area.
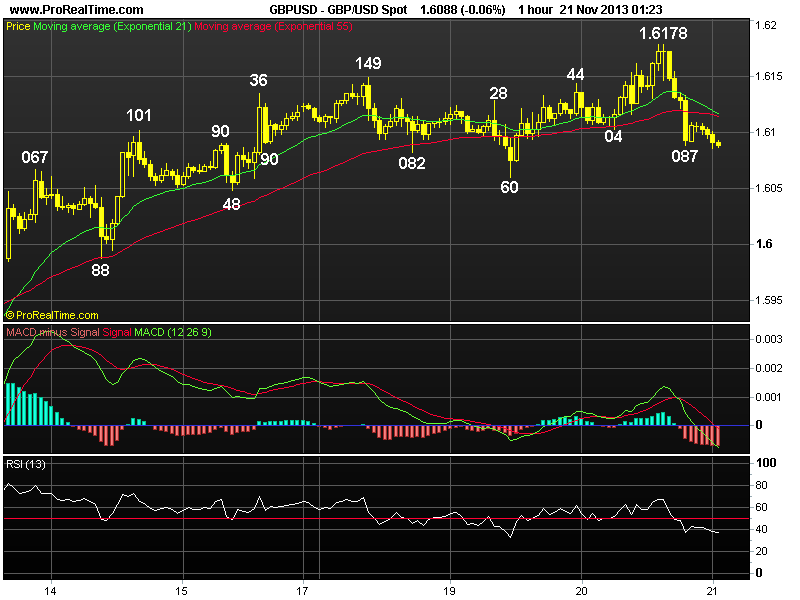
DAILY TECHNICAL OUTLOOK ON GBP/USD
21 Nov 2013 00:22GMT
Trend Daily Chart
Sideways
Daily Indicators
Rising
21 HR EMA
1.6120
55 HR EMA
1.6116
Trend Hourly Chart
Sideways
Hourly Indicators
Falling
13 HR RSI
40
14 HR DMI
-ve
Daily Analysis
Consolidation with downside bias
Resistance
1.6208 - Oct 28 high
1.6178 - Y’day’s high
1.63149 - Mon’s high
Support
1.6060 - Tue’s low
1.6048 - Last Fri’s low
1.5988 - Last Thur’s low
. GBP/USD - 1.6088… Despite initial bounce to 1.6143 in Aust. Wed, price
retreated to 1.6104 at European open. However, cable rose after BoE minutes signalled the U.K. economy is recovering n price to climbed a 3-week high of 1.6178 in NY b4 tanking to 1.6087 after release of mildly hawkish FOMC minutes.
. Y’day’s decline fm 1.6178 to 1.6087 strongly suggests cable’s near term upmove fm Nov’s near 2-month low at 1.5854 has made a top there n further choppy trading below 2013 peak at 1.6260 (Oct) wud be seen with downside bias, below 1.6060 sup wud add credence to this view n bring weakness to next chart sup at 1.6048, however, as hourly oscillators’ readings wud be in o/sold territory on such move, reckon 1.6016 (this is a ‘natural’ 50% r of aforesaid rise fm 1.5854- 1.6178) wud contain weakness n bring subsequent rebound.
. Today, anticipated usd’s broad-based strength shud weigh on the pound n selling cable on intra-day recovery is therefore recommended, however, profit shud be taken on subsequent decline. On the upside, only abv 1.6149/54 res wud dampen bearishness on cable n may risk re-test of 1.6178 but 1.6208 shud hold.
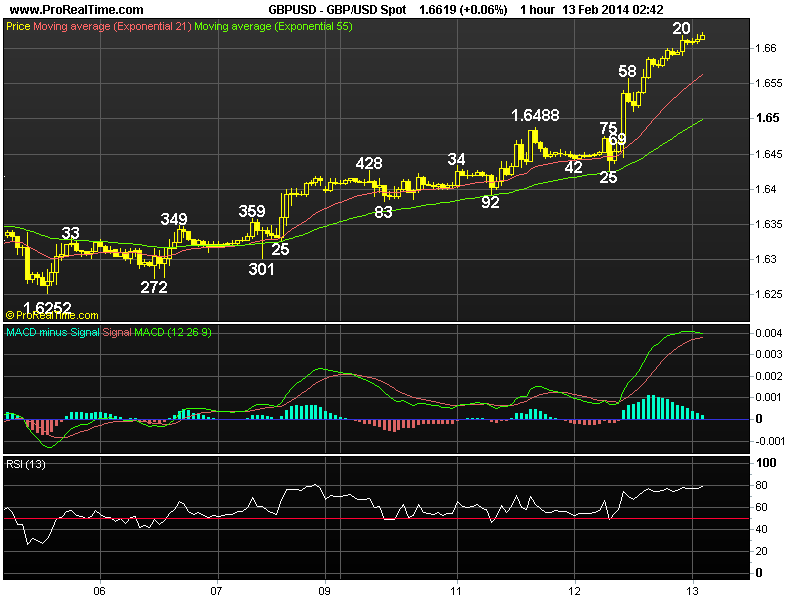
DAILY TECHNICAL OUTLOOK ON GBP/USD
13 Feb 2014 00:30GMT
Trend Daily Chart
Sideways
Daily Indicators
Neutral
21 HR EMA
1.6552
55 HR EMA
1.6491
Trend Hourly Chart
Up
Hourly Indicators
Getting o/bot
13 HR RSI
76
14 HR DMI
+ve
Daily Analysis
Consolidation with upside bias
Resistance
1.6747 - 2011 high (Apr 28)
1.6668 - Jan’s 24 high
1.6620 - Intra-day high (AUS)
Support
1.6588 - Wed’s European morning high
1.6488 - Tue’s NY high, now sup
1.6425 - Y’day’s low
. GBP/USD - 1.6609.… Although cable traded sideways in Asia n briefly
retreated fm 1.6475 to 1.6425 in European morning, release of hawkish BoE Infla-
tion report n upbeat remarks by BoE Governor Carney sent sterling surging to
1.6558, price later rallied to 1.6600 in NY n then 1.6620 in Australia today.
. Looking at the daily picture, y’day’s rally abv Tue’s high of 1.6488
confirms correction fm Jan’s 2-1/2 year peak at 1.6668 has indeed ended earlier
at 1.6252 n as price is currently trading well abv both 21-hr n 55-hr emas, sug-
gesting upside bias remains for gain twd said Jan’s high at 1.6668, break there
wud confirm MT rise fm 2013 3 year trough at 1.4814 has once again resumed n
yield further headway twd next daily obj. at 1.6747 (2011 peak in Apr). On the
downside, only below 1.648 (prev. res, now sup) wud abort present bullishness.
. Today, buying cable’s on dips in anticipation of further gain twd 1.6668
is favoured but abv needed to yield further headway twd 1.6700. On the downside,
only a firm breach of sup at 1.6511 (reaction low fm 1.6558) wud dampen current
bullish scenario n shift risk to the downside for retracement twd 1.6488.
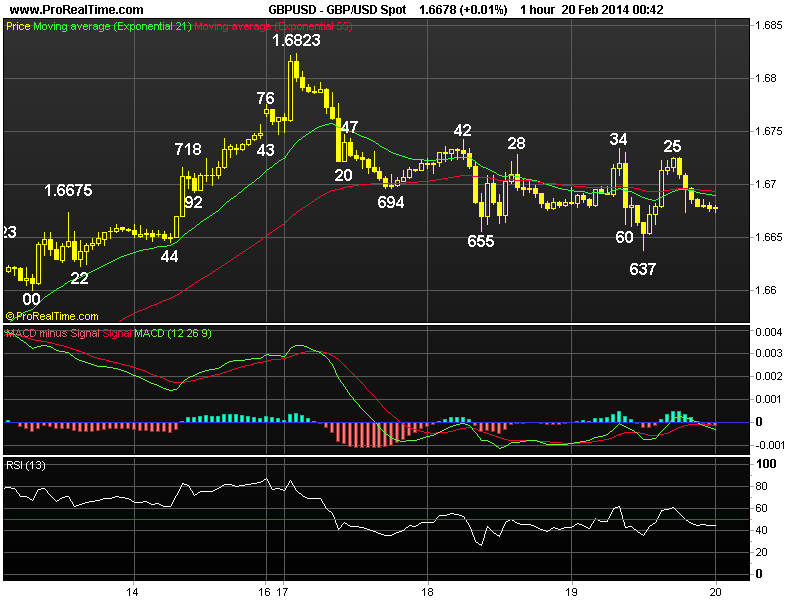
DAILY TECHNICAL OUTLOOK ON GBP/USD
Update At 20 Feb 2014 00:51GMT
Trend Daily Chart
Up
Daily Indicators
Rising
21 HR EMA
1.6689
55 HR EMA
1.6693
Trend Hourly Chart
Sideways
Hourly Indicators
Neutral
13 HR RSI
44
14 HR DMI
-ve
Daily Analysis
Initial decline b4 rebound
Resistance
1.6823 - Mon’s fresh 4-year high
1.6796 - Hourly chart
1.6742 - Tue’s high
Support
1.6637 - Y’day’s low
1.6600 - Hourly chart
1.6558 - Prev. res, now sup
. GBP/USD - 1.6678.… Despite cable’s brief rebound to 1.6734 in European
morning y’ay, price tumbled to 1.6660 after higher-than-expected U.K. unemploy-
ment rate n then to 1.6537 ahead of NY open. Later, cable recovered on short-
covering to 1.6725 in NY morning b4 falling again after FOMC minutes.
. Looking at the hourly n daily charts, y’day’s firm breach of Tue’s low
at 1.6655 to 1.6637 confirms corrective decline fm Mon’s 4-year peak at 1.6823
has resumed n as long as res area at 1.6734/42 (y’day’s high n Tue’s high)
holds, downside bias remains for aforesaid fall to retrace MT uptrend fm 2013
bottom at 1.4814 (Jul) to extend marginally, however, as houly oscillators’
readings wud display ‘bullish convergences’ on next decline, reckon 1.6600/05,
hourly chart lvl n the ‘minimum’ 38.2% r of intermediate rise fm 1.6252-1.6823,
wud contain weakness n yield rebound later.
. In view of abv analysis, although selling cable on intra-day recovery is
favoured, day traders shud buy the pound on next decline. On the upside, a daily
close abv the said res area at 1.6724-42 wud be the 1st signal correction is
over n yield further gain twd 1.6796, then re-test of 1.623 next week.
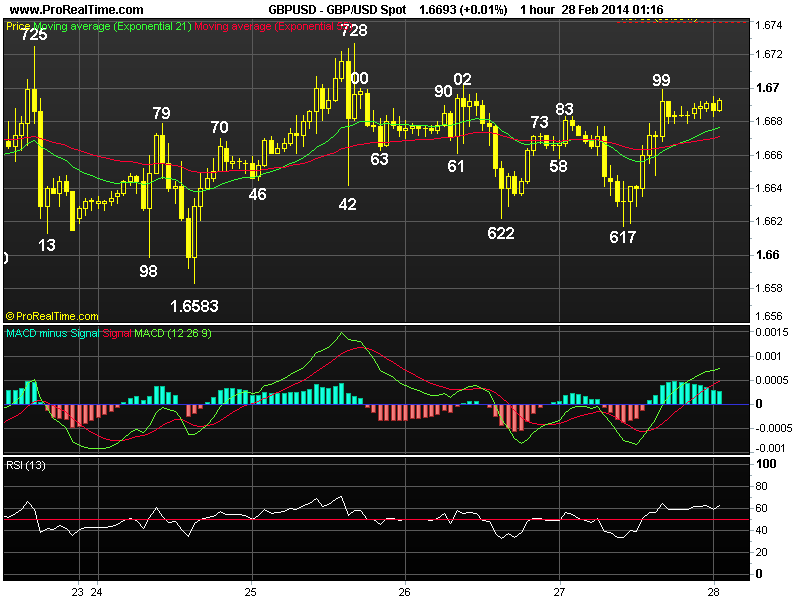
_gbp.gif[/IMG] DAILY TECHNICAL OUTLOOK ON GBP/USD
Last Update At 28 Feb 2014 01:21GMT
Trend Daily Chart
Up
Daily Indicators
Rising
21 HR EMA
1.6677
55 HR EMA
1.6671
Trend Hourly Chart
Sideways
Hourly Indicators
Rising
13 HR RSI
63
14 HR DMI
+ve
Daily Analysis
Consolidation with upside bias
Resistance
1.6823 - Last Mon’s 4-year high
1.6776 - Last Mon’s NZ res
1.6728 - Tue’s high
Support
1.6617 - Y’day’s low
1.6583 - Mon’s low
1.6537 - 50% r of 1.6252-1.6823
. GBP/USD - 1.6691 …. The British pound continued to fluctuate wildly on Thur. Although cable weakened fm Asian high at 1.6683 to 1.6617 in European morning, renewed buying interest there lifted price n sterling later rallied back to 1.6699 after dovish remarks by Fed Chair Janet Yellen b4 stabilising.
. Despite y’day’s brief drop below Wed’s low at 1.6622 to 1.6617, cable’s
subsequent rebound after holding well abv Mon’s low at 1.6583 suggests further ‘choppy’ sideways trading inside near term established broad range of 1.6583- 1.6728 wud continue with upside bias for gain to 1.6728 res (Tue’s high), however, break is needed to signal the corrective fall fm last Mon’s 4-year peak at 1.6823 has indeed ended at 1.6583 (Mon) n a daily close abv 1.6734/42, Feb 19 high n Feb 18 top respectively wud add credence to this view n yield possible resumption of MT uptrend for re-test of 1.6823 later next week.
. Today, we’re holding a long position in anticipation of further gain. On
the downside, only below 1.6617 wud shift risk to the downside for a re-test of Mon’s low at 1.6583, below wud bring stronger retracement of MT intermediate fm rise 1.6252 twd 1.6537 (being 50% r of 1.6252-1.6823) b4 prospect of recovery.
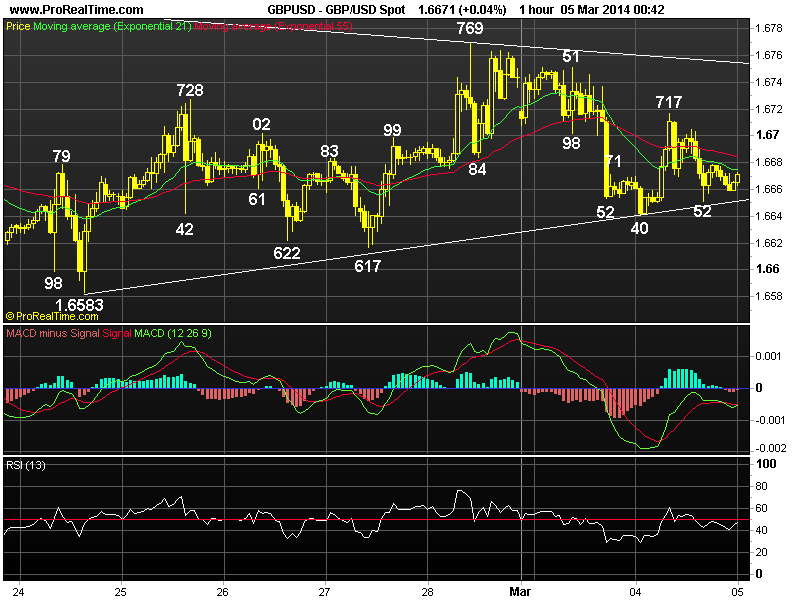
_major_gbp.gif[/IMG] DAILY TECHNICAL OUTLOOK ON GBP/USD
05 Mar 2014 00:40GMT
Trend Daily Chart
Up
Daily Indicators
Neutral
21 HR EMA
1.6675
55 HR EMA
1.6685
Trend Hourly Chart
Sideways
Hourly Indicators
Turning up
13 HR RSI
48
14 HR DMI
-ve
Daily Analysis
Consolidation with downside bias
Resistance
1.6823 - Feb’s 4-year high
1.6769 - Last Fri’s high
1.6717 - Y’day’s high
Support
1.6640 - Y’day’s low
1.6617 - Last Thur’s low
1.6583 - Feb 24 low
. GBP/USD - 1.6671.… Although the British pound staged a brief but strg
rebound fm 1.6640 (Asia) to 1.6717 (Europe) as tension on Russia-Ukraine eased,
renewed selling interest pressued cable to 1.6651 in New York b4 stabilising.
. Looking at the hourly n daily charts, cable’s strg retreat fm last Fri’s
top at 1.6769 to 1.6640 y’day suggests the rebound fm last Mon’s 1.6583 low has
indeed made a top there n as long as 1.6769 holds, ‘choppy’ consolidation below
Feb’s 4-year peak at 1.6823 wud continue with downside bias. The price action fm
there is possibly developing into a triangle with a-leg trough at 1.6583; b-leg
: 1.6769 n c-leg decline is still unfolding n may bring weakness twds 1.6617 n
possibly twds 1.6600, however, anticipated low readings on hourly oscillators
shud limit downide to 1.6583. Only below 1.6583 wud risk stronger retracement of
the MT intermediate rise fm 1.6252 to 1.6538 (50% r).
. In view of abv consolidative view, we’re trading cable on both sides of
the market today. On the upside, only abv 1.6769 res wud signal correction fm
1.6823 is over n MT rise fm 2013 2-year trough at 1.4814 (Jul) may resume n
extend gain to 1.6936 (61.8% proj. of 1.6252-1.6823 fm 1.6583) later.
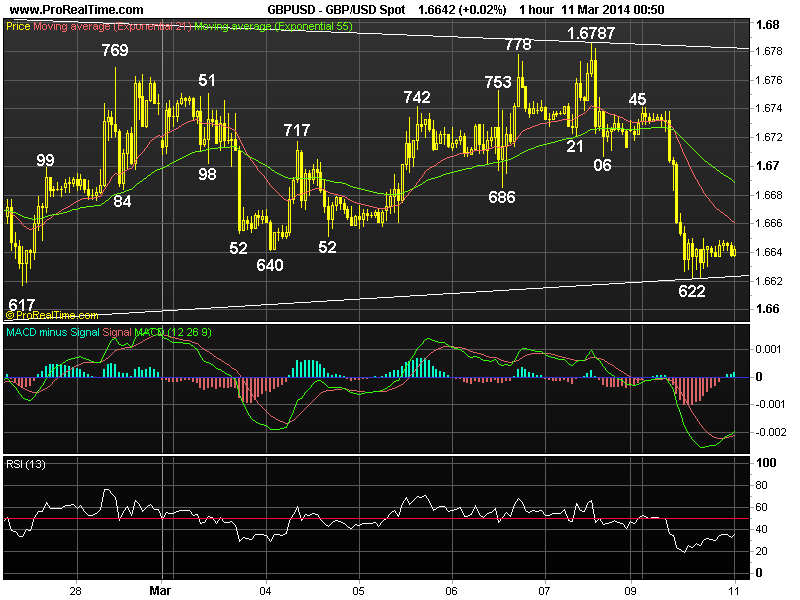
major_gbp.gif[/IMG] DAILY TECHNICAL OUTLOOK ON GBP/USD
11/03/2014 00:49 GMT
Trend Daily Chart
Up
Daily Indicators
Neutral
21 HR EMA
1.6661
55 HR EMA
1.6689
Trend Hourly Chart
Near term down
Hourly Indicators
Rising fm o/sold
13 HR RSI
39
14 HR DMI
-ve
Daily Analysis
Consolidation with downside bias
Resistance
1.6787 - Last Fri’s 2-week high
1.6745 - Y’day’s high (NZ)
1.6706 - Last Fri’s NY low
Support
1.6622 - Y’day’s low
1.6583 - Feb 24 low
1.6547 - Eq. of 1.6823-1.6583 fm 1.6787
. GBP/USD - 1.6642 … Despite staging a brief recovery fm last Fri’s NY low at 1.6706 to 1.6745 in NZ on Mon, the British pound tumbled in European morning due to active cross selling in sterling (eur/gbp rallied fm 0.8290 to 0.8351). Cable weakened further to 1.6622 due to dovish comments fm BOE’s Bean.
. Looking at the hourly n daily charts, yesterday’s sell off signals the
recovery fm last Mon’s low at 1.6583 has ended at 1.6787 last Fri n further
‘choppy’ consolidation below Feb’s 4-year peak at 1.6823 wud continue with
downside bias n as long as 1.6706 (prev. sup, now res) holds, another leg of
corrective fall twd 1.6583 is likely, below wud bring stronger retracement of MT intermediate rise fm 1.6252 to 1.6538/47 (being 50% r of 1.6252-1.6823 n 100% measurement of 1.6823-1.6583 projected fm 1.6787 respectively), however, reckon downside wud hold abv dynamic sup at 1.6470 (61.8% r of 1.6252-1.6823).
. Today, in view of near term bearish scenario, selling cable on recovery
in anticipation of further weakness is favoured n only a breach of 1.6706 wud
signal the pullback fm Fri’s 1.6787 high is over instead n yield stronger gain
to 1.6745 1st, abv wud yield re-test of 1.6787 res later this week.
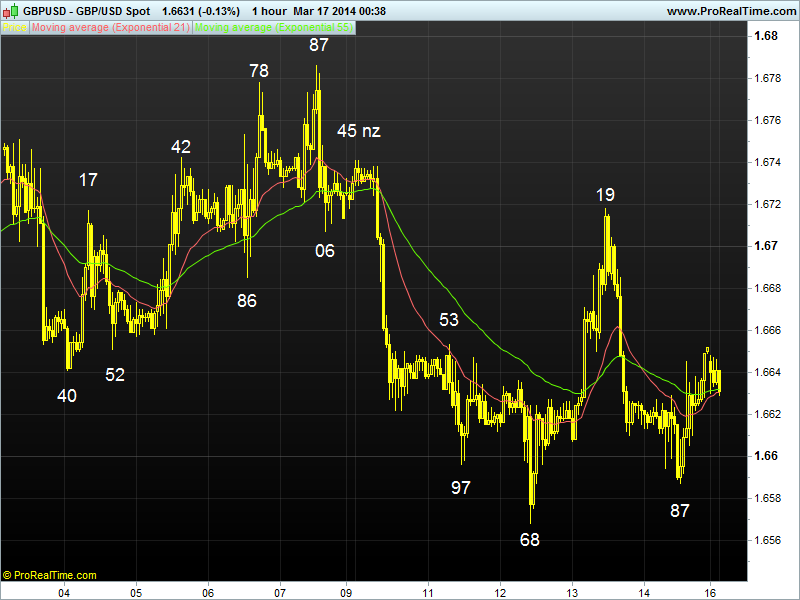
bp.gif[/IMG] WEEKLY TECHNICAL OUTLOOK ON GBP/USD
Last Update At 17 Mar 2014 00:07GMT
Trend Daily Chart
Up
Daily Indicators
Turning down
21 HR EMA
1.6631
55 HR EMA
1.6632
Trend Hourly Chart
Sideways
Hourly Indicators
Rising
13 HR RSI
53
14 HR DMI
+ve
Daily Analysis
Choppy trading to continue
Resistance
1.6745 - Last Mon’s high (NZ)
1.6719 - Last Thur’s high
1.6686 - Hourly res
Support
1.6605 - Hourly sup
1.6587 - Last Fri’s low
1.6568 - Last Wed’ 3-week low
. GBP/USD - 1.6635.… Although weakness in sterling last week pressured
the pound below previous daily sup at 1.6583 to a 30-week trough of 1.6568,
broad-based short-covering lifted cable to as high s 1.6719 Thur but only to
fall sharply back to as low as 1.6587 Fri b4 staging another bounce.
. Cable’s aforesaid strg bounce fm 1.6568 to 1.6719 suggests correction fm
Feb’s 4-year peak at 1.6823 has possibly ended there n initial consolidation is
in store this week, abv 1.6719 wud add credence to this view, then price shud
head twd pivotal res at 1.6787, break wud encourage for a re-test of 1.6823 n
later twd 1.6921, this is 61.8% proj. of MT intermediate rise fm 1.6252-1.6823
measured fn 1.6568. On the downside, below 1.6568 wud confirm MT rise fm 2013 3-
year trough at 1.4814 has formed a temporary there, then risk wud shift to the
downside for weakness twd 1.6470, this is 61.8% r of the intermediate rise fm
1.6252-1.6823.
. Today, in view of abv analysis n intra-day neutral outlook on cable, we
are standing aside initially n may trade fm both sides of the market for short
trade. However, as long as Fri’s low at 1.6587 holds, price may ratchet higher
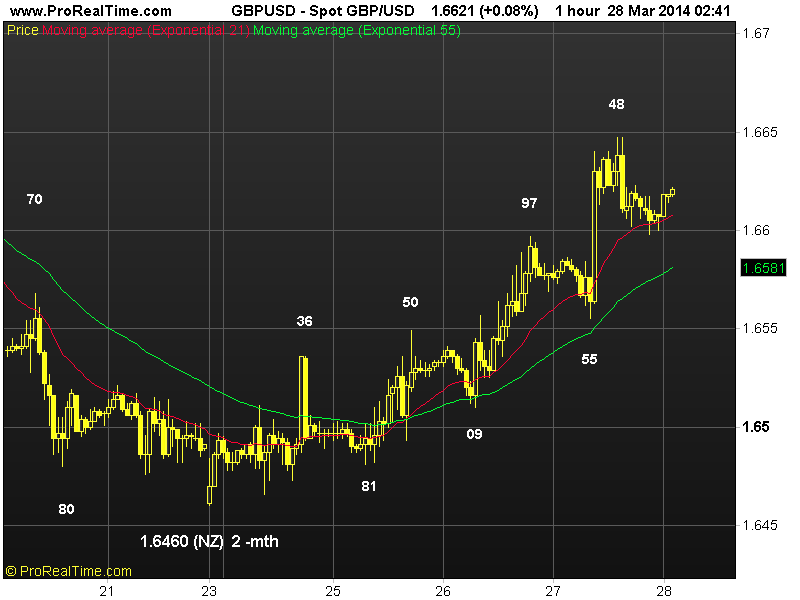
DAILY TECHNICAL OUTLOOK ON GBP/USD
Last Update At 28 Mar 2014 00:10GMT
Trend Daily Chart
Sideways
Daily Indicators
Turning up
21 HR EMA
1.6604
55 HR EMA
1.6578
Trend Hourly Chart
Near term up
Hourly Indicators
Tuning down
13 HR RSI
55
14 HR DMI
+ve
Daily Analysis
Consolidation b4 one more rise
Resistance
1.6719 - Mar 13 high
1.6667 - Mar 17 high
1.6647 - Y’day’s high
Support
1.6555 - Y’day’s low
1.6509 - Wed’s low
1.6460 - Mon’s low in NZ
. GBP/USD - 1.6611…Cable continued its recent winning streak Thur n rose
for a 4th day as ‘upbeat’ U.K. retails sales triggered broad-based buying of
sterling, price jumped fm session low of 1.6555 after the data n climbed to a
1-week high of 1.6647 in NY b4 retreating to 1.6500 in Aust. on profit taking.
. Although y’day’s anticipated rally to 1.6647 confirms cable’s 1st leg of
correction fm Feb’s 4-year peak at 1.6823 has ended earlier at 1.6460 on Mon n
as long as y’day’s low at 1.6555 holds, consolidation with mild upside bias
still remains for gain twd ‘dynamic’ obj. at 1.6684, this is 61.8% r of said dec
line fm 1.6823-1.6460, however, as hourly oscillators wud display ‘bearish diver
ging signals’ on sch move, reckon upside wud falter well below res at 1.6719 n
risk has increased for a strg retreat to occur later today or Mon. Looking ahead
, only a daily close abv 1.6719 wud retain bullish prospect of further headway
to 'pivotal res at 1.6787 next week.
. Today, we’re holding a long position in anticipation of one more rise n
profit sud be taken on next upmove. On the downside, a daily close below 1.6555
anytime wud signal correction fm 1.6460 ha ended n yield weakness twd 1.6509.
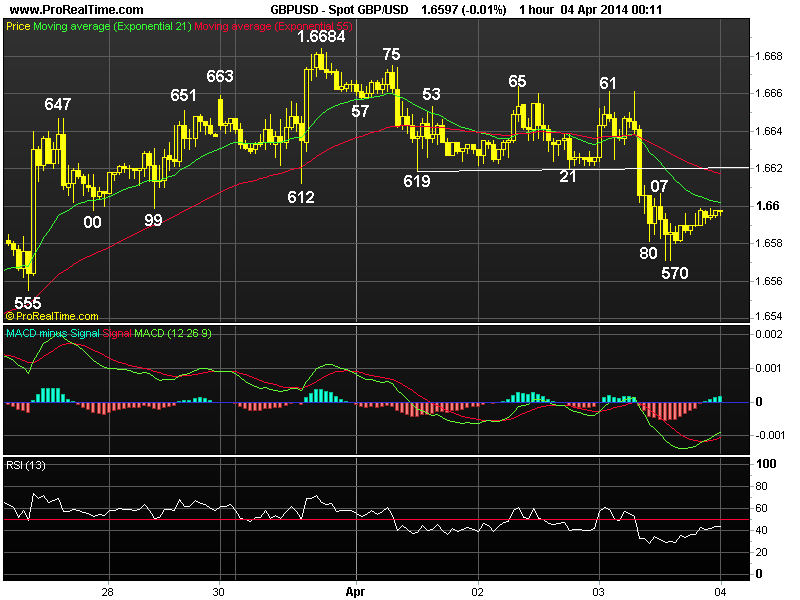
DAILY TECHNICAL OUTLOOK ON GBP/USD
Last Update At 04 Apr 2014 00:18GMT
Trend Daily Chart
Sideways
Daily Indicators
Neutral
21 HR EMA
1.6602
55 HR EMA
1.6617
Trend Hourly Chart
Near term down
Hourly Indicators
Rising fm o/s
13 HR RSI
43
14 HR DMI
-ve
Daily Analysis
Consolidation with downside bias
Resistance
1.6684 - Mon’s high
1.6665 - Wed’s high
1.6619 - Tue’s low
Support
1.6570 - Y’day’s low
1.6555 - Last Thur’s low
1.6509 - Last Wed’s low
. GBP/USD - 1.6597… Despite trading just abv Tue’s 1.6619 low y’day at Asian open, hawkish comments by BoE Governor Carney reported on BLP sent price higher to 1.6661 b4 easing to 1.6625. Cable re-tested 1.6661 in Europe but fell on downbeat U.K. services PMI. Selloff in eur/usd knocked cable to 1.6570 in NY.
. Looking at the broader picture, y’day’s anticipated decline has retained
our daily bearish technical outlook on cable. Although the erratic rise fm last
Mon’s 1.6460 low confirms the 1st leg of correction fm Feb’s 4 year peak at
1.6823 has ended there, as price has faltered right at the indicated ‘dynamic’
res at 1.6684 (being 61.8% r of 1.6823-1.6460), cable’s selloff to 1.6570 Thur signals correction is over. A daily close below 1.6555 sup anytime wud encourage for a re-test of 1.6460 next week, break wud confirm downtrend fm 1.6823 has finally resumed n yield weakness twd 1.6321 (equality projection of 1.6823-1.6460 measured fm 1.6684, later this month.
. Today, as cable has traded well abv 1.6570 in NY afternoon, suggesting
consolidation wud continue in Asia n we may need to wait for U.S. payrolls data b4 prospect of another fall. Only abv 1.6619/21 risks 1.6661/65, break, 1.6684.
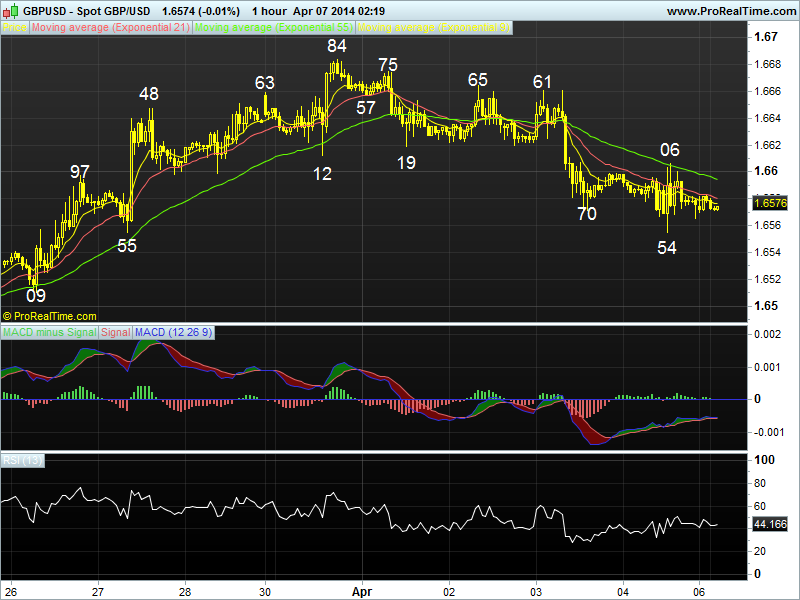
WEEKLY TECHNICAL OUTLOOK ON GBP/USD
Last Update At 07 Apr 2014 00:01GMT
Trend Daily Chart
Sideways
Daily Indicators
Neutral
21 HR EMA
1.6582
55 HR EMA
1.6596
Trend Hourly Chart
Near term down
Hourly Indicators
Bullish convergences
13 HR RSI
46
14 HR DMI
-ve
Daily Analysis
Marginal fall b4 rebound
Resistance
1.6684 - Last Mon’s high
1.6665 - Last Wed’s high
1.6606 - Last Fri’s low
Support
1.6554 - Last Fri’slow
1.6509 - Mar 26 low
1.6460 - Mar 24
. GBP/USD - 1.6579… Despite continuing its recent winning streak n rising for a 6th consecutive day to 1.6684 last Mon, the pound then ratcheted lower as weaker-than-expected U.K. PMIs triggered broad-based profit taking in sterling n price later weakened to 1.6554 after Fri’s U.S. jobs data b4 staging a recovery.
. Although cable’s erratic upmove fm Mar’s low at 1.6460 confirms the 1st leg of correction fm Feb’s 4 year peak at 1.6823 has ended there, as price has faltered right at the ‘dynamic’ res at 1.6684 (being 61.8% r of 1.6823-1.6460) last Mon, the selloff to 1.6554 Fri signals correction is over. A daily close below 1.6554 sup wud encourage for a re-test of 1.6460, break wud confirm early decline fm 1.6823 has resumed n yield weakness twd 1.6321 (equality projection of 1.6823-1.6460 measured fm 1.6684) later this month. On the upside, only abv 1.6684 wud abort present bearish scenario n may risk stronger gain twd 1.6787.
. Today, as Fri’s 1-week low at 1.6554 was accompanied by ‘bullish cover-
gences’ on the hourly oscillators, range trading is in store initially. As long
as 1.6619/21 (previous sup) holds, further fall to 1.6538 (61.8% r of 1.6460-
1.6684) is still envisaged. Only abv said res may risk retracement to 1.6650/60.
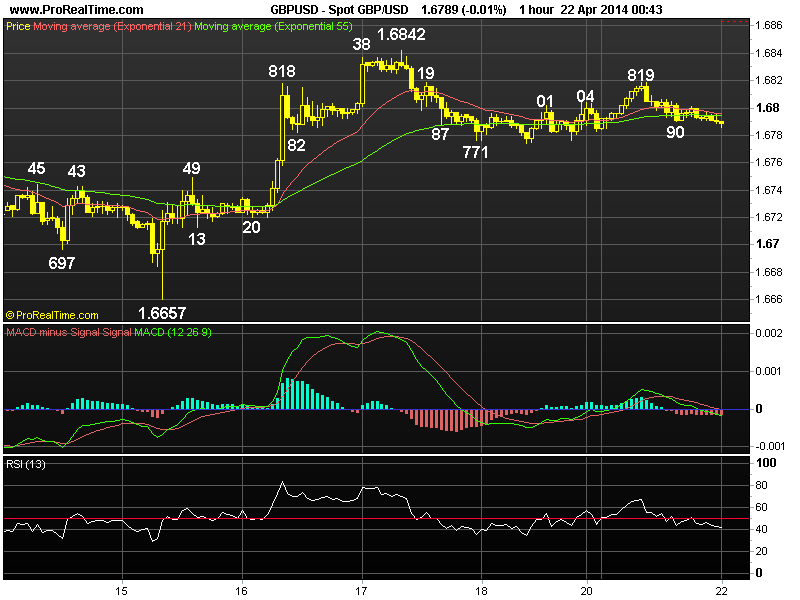
[B]DAILY TECHNICAL OUTLOOK ON GBP/USD[/B]
Last Update At [B]22 Apr 2014[/B] [I]00:40GMT[/I]
[B]Trend Daily Chart [/B]
Up
[B]Daily Indicators [/B]
Bearish divergences
[B]
21 HR EMA[/B]
1.6794
[B]55 HR EMA[/B]
1.6796
[B]Trend Hourly Chart [/B]
Sideways
[B]Hourly Indicators [/B]
Falling
[B]13 HR RSI [/B]
42
[B]14 HR DMI[/B]
-ve
[B]Daily Analysis[/B]
Consolidation with downside bias
[B]Resistance [/B]
1.6879 - 2009 high (Nov)
1.6842 - Last Thur’s high
1.6819 - Y’day’s high
[B]Support[/B]
1.6771 - Last Fri’s low
1.6749 - Last Tue’s high
1.6713 - Last Tue’s NY sup
[B]. GBP/USD - 1.6789 [/B]… Although the pound traded with a steady tone at Mon
open y’day, broad-based buying of sterling helped price to ratchet higher fm
last Fri’s 1.6771 low (Reuters) to intra-day peak of 1.6819 b4 coming off in NY
due to euro’s weakness, cable later retreated to 1.6790, then 1.6786 today.
. Looking at the hourly and daily charts, as last week’s 4-1/2 year high at
1.6842 high was accompanied by bearish divergences on the hourly indicators, sub
sequent retreat suggests a temporary top has been made n initial consolidation
with downside bias is seen, however, break of 1.6657 sup is needed to violate
recent series of higher lows n higher highs n signal the long-awaited correction
has taken place, then cable wud head twd 1.6554. On the upside, abv 1.6842 wud
extend MT upmove fm 1.4228 (2010 bottom) to 1.6879 (Nov 2009 high) n possibly
twd 1.6945, being 50% projection of the MT intermediate rise fm 1.5854-1.6823
measured fm 1.6460, bearish divergences on daily indicators shud cap price
below key res 1.7044 (Aug 2009 peak - reaction high fm 2009 low at 1.3500).
. Today, as long as 1.6819 holds, downside bias remains, below 1.6771 wud
yield weakness to 1.6747/49 n only abv 1.6819 may risk re-test of 1.6842.
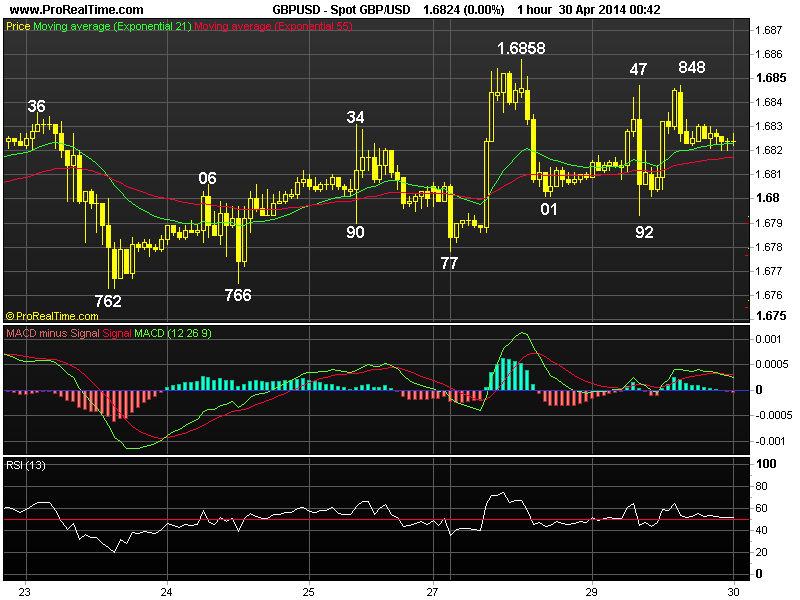
DAILY TECHNICAL OUTLOOK ON GBP/USD
Last Update At 30 Apr 2014 00:40GMT
Trend Daily Chart
Up
Daily Indicators
Rising
21 HR EMA
1.6823
55 HR EMA
1.6817
Trend Hourly Chart
Sideways
Hourly Indicators
Neutral
13 HR RSI
51
14 HR DMI
+ve
Daily Analysis
Consolidation with downside bias
Resistance
1.6945 - 50% proj. of 1.5854-1.6823 fm 1.6460
1.6879 - 2009 high (Nov)
1.6858 - Mon’s fresh 4-1/2 year high
Support
1.6792 - Y’day’s NY low
1.6762 - Last Wed’s low
1.6713 - Apr 15 NY low
. GBP/USD - 1.6825.… Cable went through a ‘roller-coaster’ session on Tue. Although price rose briefly to 1.6847 in early Europe n then tumbled to 1.6792 after release of disappointing U.K. Q1 GDP data, price rebounded on active buying of pound vs euro n rose 1-tick higher to 1.6848 in NY morning b4 easing.
. Although cable’s rebound fm y’day’s low at 1.6792 to 1.6848 suggests 1st leg of correction fm Mon’s fresh 4-1/2 year peak at 1.6858 has ended there n another day of choppy sideways swings is envisaged, as long as 1.6858 top holds, downside bias remains for another attempt twd chart obj. at 1.6762 (last week’s low), however, a daily close below there is needed to confirm a temporary top has been formed n yield stronger retracement to 1.6710/20. On the upside, abv said high anytime wud confirm MT uptrend fm 1.4228 (2010 bottom) has once again resumed n further gain to 1.6879 (Nov 2009 high) wud follow, however, prominent ‘bearish divergences’ on hourly oscillators on next upmove shud cap price below 1.6945 (50% projection of 1.5854-1.6823 measured fm 1.6460, n bring correction.
. In view of abv analysis, we’re selling cable again on recovery n only abv
minor daily res at 1.6879 wud risk marginal gain to 1.6900/05 b4 retrace. occur.