AceTraderforex Aug 28, 2013: DAILY TECHNICAL Market Outlook on Majors GBP/USD

DAILY TECHNICAL OUTLOOK ON GBP/USD

Last Update At 13 May 2014 00:30GMT

Trend Daily Chart

Up

Daily Indicators
Turning down

21 HR EMA
1.6872

55 HR EMA

1.6885

Trend Hourly Chart
Sideways

Hourly Indicators
Neutral

13 HR RSI
50

14 HR DMI

0

Daily Analysis
Consolidation b4 one more fall

Resistance
1.6975 - Last Thur’s high
1.6938 - Last Fri’s high
1.6916 - Last Fri’s Asian low (now res)

Support
1.6832 - Last Fri’s low
1.6821 - May 03 low
1.6792 - Apr 29 low

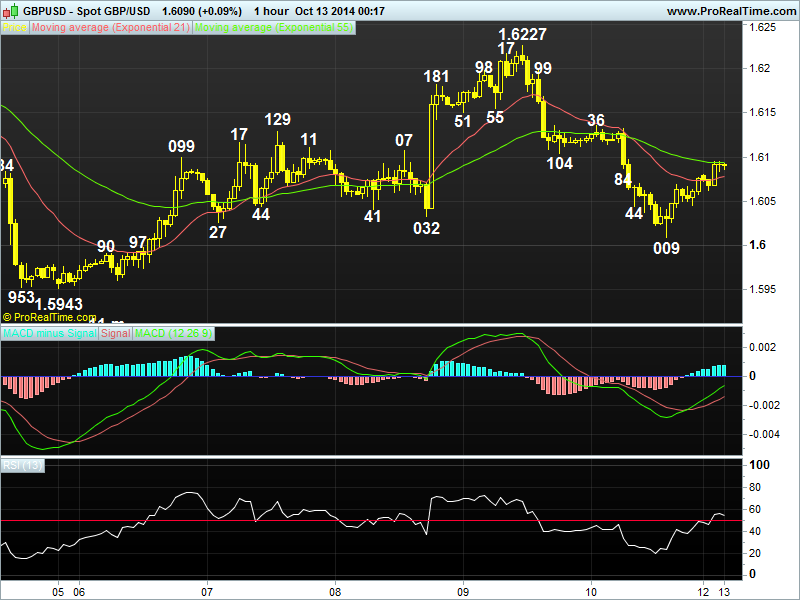
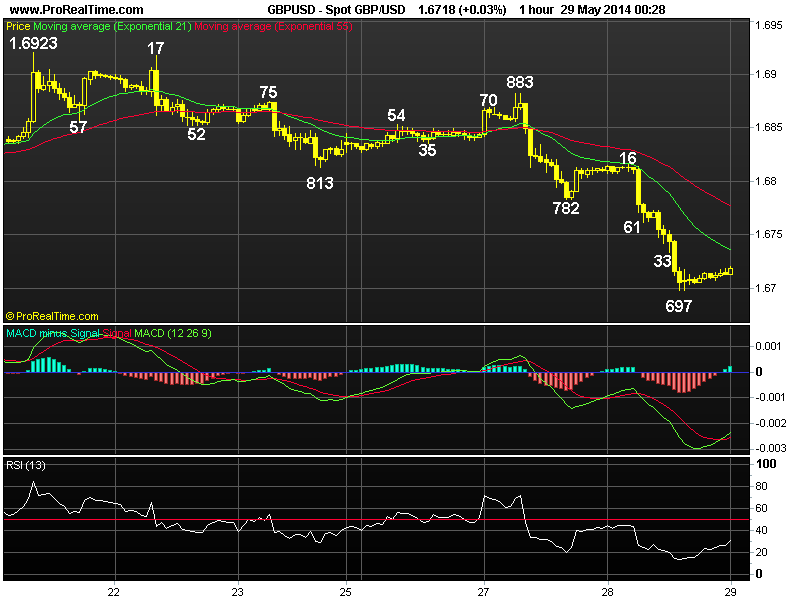
. GBP/USD - 1.6873… Although cable found support at 1.6840 in NZ on Mon n then ratcheted higher to 1.6903 in European morning due partly to cross-buying in sterling. Renewed dlr’s broad-based firmness checked intra-day gain n cable later retreated to 1.6863 in NY session.

. Looking at the hourly n daily charts, cable’s rebound fm 1.6840 to 1.6903
y’day suggests choppy trading abv last Fri’s low at 1.6832 wud be seen but as sell off fm last Tue’s near 5-year peak at 1.6996 indicates MT uptrend fm 2013 trough (Jul) at 1.4814 has possibly made a temporary top there, 1.6916 (prev. sup, now res) shud hold n downside bias remains for re-test of said sup. Below 1.6821 (May 3 low) anytime wud add credence to this view n further decline to 1.6791/92, being the ‘minimum’ 38.2% r of intermediate rise of 1.6460-1.6996 n Apr 29 low respectively, wud follow but prominent ‘bullish convergences’ on the hourly oscillators on such a move shud keep price abv 1.6762 (Apr 23 low).

. In view of abv analysis, trading cable is cautiously favoured n only abv
1.6938 (last Fri’s high) wud dampen present mildly bearish scenario on cable n risk stronger retracement to 1.6970/75 b4 prospect of retreat.

DAILY TECHNICAL OUTLOOK ON GBP/USD
Last Update At 20 May 2014 00:13GMT

Trend Daily Chart
Up

Daily Indicators
Turning down

21 HR EMA
1.6819

55 HR EMA
1.6815

Trend Hourly Chart
Sideways

Hourly Indicators
Falling

13 HR RSI
46

14 HR DMI
-ve

Daily Analysis
Marginal rise b4 strg retreat

Resistance
1.6903 - Last Mon’s high
1.6875 - Last Tue’s high
1.6845 - Y’day’s high

Support
1.6784 - Last Fri’s low in Europe
1.6732 - Last Thur’s low
1.6657 - Apr 15 low

. GBP/USD - 1.6815… Cable rebounded after retreating fm 1.6833 to 1.6806 in European morning on Mon n price later rose abv later Fri’s high of 1.6841 to 1.6845 ahead of NY open, however, lack of follow through buying prompted profit-taking there n cable retreated to 1.6812 b4 moving sideways in NY afternoon.

. Looking at the hourly n daily charts, although y’day’s break of last Fri’s high to 1.6845 signals decline fm May’s near 5-year peak at 1.6996 has formed a minor low there n another day of choppy trading wud continue, as the last week’s breach of indicated sup at 1.6762 strongly suggests MT uptrend fm 1.4228 (2010 trough) has formed a temporary top at 1.6996, downside bias remains n 1.6895/03, being the ‘dynamic’ 61.8% r of 1.6996-1.6732 n last Mon’s high respectively, wud hold n yield another decline later this week. Below 1.6784 (hourly sup) anytime wud suggest recovery is over, 1.6732 again. Looking ahead, below said sup wud indicate the pound is en route to 1.6560, this is a ‘minimum’ 38.2% r of the intermediate MT rise fm 1.5854 (Nov 2013 low) later this month.

. Today, selling cable on intra-day recovery is still favoured n only abv 1.6903 wud abort this bearish scenario n risk gain to 1.6938.

DAILY TECHNICAL OUTLOOK ON GBP/USD

Last Update At 22 May 2014 23:54GMT

Trend Daily Chart

Up

Daily Indicators
Turning down

21 HR EMA
1.6870

55 HR EMA
1.6865

Trend Hourly Chart
Sideways

Hourly Indicators
Neutral

13 HR RSI
47

14 HR DMI
+ve

Daily Analysis
Choppy trading to continue

Resistance
1.6997 - May 6 high
1.6938 - May 9 high
1.6923 - Wed’s high

Support
1.6852 - Y’day’s low
1.6802 - Tue’s low
1.6784 - Last Fri’s low in Europe

. GBP/USD - 1.6867… Cable went through a mini ‘roller-coaster’ session on
Thur as despite a brief rise to 1.6917 in European morning, release of U.K. Q1
GDP which was in line with forecast disappointed the market n the pound swiftly reterated to 1.6862 n then later to 1.6852 in NY afternoon b4 recovering.

. Looking at the daily picture, although early rally abv res at 1.6903 (last
week’s high) to 1.6923 on Wed signals correction fm May’s near 5-year peak at 1.6997 (Reuters) has ended at last Thur’s 4-week trough at 1.6732, aforesaid retreat fm 1.6917 suggests further choppy trading below 1.6997 wud continue n a stronger pullback twd 1.6802 may be seen, however, reckon sup at 1.6784 wud hold n upside bias remains for another rise next week after consolidation but a daily close abv 1.6923 is needed to bring a re-test 1.6997 next week. Looking ahead, abv 1.6997 wud confirm MT uptrend fm 1.4228 (2010 trough) has once again resumed n yield gain twd the key daily res at 1.7044 (Aug 2009).

. In view of abv analysis, buying cable on dips for another rise twd 1.6823 is still favoured today. On the downside, only a firm break of 1.6782/84 wud abort present mildly bullish scenario n may risk subsequent weakness twd 1.6732.


DAILY TECHNICAL OUTLOOK ON GBP/USD
Last Update At 29 May 2014 00:30GMT

Trend Daily Chart

Sideways

Daily Indicators
Falling

21 HR EMA
Rising fm o/s

55 HR EMA

29

Trend Hourly Chart
Down

Hourly Indicators
Rising fm o/s

13 HR RSI
1.6736

14 HR DMI
1.67

Daily Analysis

Resumption of recent decline

Resistance
1.6816 - Y’day’s high
1.6782 - Tue’s low, now res
1.6732 - May 16 low, now res

Support
1.6697 - Y’day’s 5-week low
1.6657 - Apr 15 low
1.6624 - 50% r of 1.6252-1.6997

. GBP/USD - 1.6717.… Cable came under renewed selling in Asia at 1.6816 Wed n fell to 1.6761 at European open. Intra-day decline continued after data showed growth in U.K. retail slowed in May n price subsequently tumbled to a 6-week low of 1.6697 in NY morning b4 staging a minor rebound on short covering.

. Looking at the daily chart, y’day’s breach of previous May’s low at 1.6732 n daily close below there confirms a major top has been formed at May’s near 5-year peak at 1.6997 (Reuters) n price is en route to 1.6560 in June, this is a ‘minimum’ 38.2% r of the intermediate MT rise fm 1.5854-1.6997. Having said that , as daily oscillators wud be o/sold territory on such a move, daily sup at 1.6460 (Mar 24 low in NZ) shud contain weakness. Therefore, trading cable fm short side is favoured, however, one shud look to take profit on next decline as the hourly oscillators wud display bullish convergences on next decline, suggesting sharp fall is unlikely to be seen n reckon 1.6624, this is the ‘natural’ 50% r of intermediate rise of 1.6252-1.6997, wud hold n yield rebound later.

. Today, expect weakness to 1.6555 n only abv 1.6782 wud indicate temporary low is made, risk stronger retracement twd 1.6813/16 b4 another fall next week.

DAILY TECHNICAL OUTLOOK ON GBP/USD

Last Update At 06 Jun 2014 00:52GMT

Trend Daily Chart
Sideways

Daily Indicators
Turning up

21 HR EMA
1.6789

55 HR EMA
1.6768

Trend Hourly Chart
Nr term up

Hourly Indicators
Easing fm o/bot

13 HR RSI
66

14 HR DMI
+ve

Daily Analysis
Consolidation with upside bias

Resistance
1.6883 - May 27 high
1.6845 - 38.2% r of 1.6997-1.6693
1.6825 - Y’day’s high in NY

Support
1.6782 - Tue’s high (now sup)
1.6758 - 50% r of 1.6693-1.6825
1.6723 - Y’day’s low

. GBP/USD - 1.6809… Despite cable’s brief jump to 1.6793 in European morning due partly to cross-buying in sterling, price fell after BoE kept its monetary policy unchanged. Cable then briefly dropped to 1.6723 but only to rally in tandem with euro to session high of 1.6825 in NY afternoon.

. Looking at the hourly n daily charts, y’day close abv Tue’s high of 1.6782 signals cable’s decline fm May’s near 5-year peak at 1.6997 (Reuters) has indeed made a temporary low at last Thur’s 5-week trough at 1.6693 n as long as sup at 1.6758 (50% r fm 1.6693) holds, gain to 1.6845 n then 1.6883 is likely, being the ‘natural’ 50% r of 1.6997-1.6693 n May’s 27 high respectively, however, as hourly oscillators wud be in o/bot territory on such a move, upside wud falter below pivotal res at 1.6923 (May 21 high) n yield retreat next week.

. In view of abv analysis, buying cable on dips in anticipated of further gain to 1.6860/70 is favoured today but profit shud be taken on upmove. On the downside, only below 1.6723 wud suggest aforesaid correction fm 1.6693 is over n shift risk to the downside for re-test of 1.6693, however, this move is unlikely to be seen today.

DAILY TECHNICAL OUTLOOK ON GBP/USD

Last Update At 12 Jun 2014 00:23GMT

Trend Daily Chart
Sideways

Daily Indicators
Turning up

21 HR EMA

1.6784

55 HR EMA
1.6782

Trend Hourly Chart
Sideways

Hourly Indicators
Rising

13 HR RSI
58

14 HR DMI
+ve

Daily Analysis
Choppy trading to continue

Resistance
1.6883 - May 27 high
1.6845 - Last Fri’s high
1.6817 - Tue’s high

Support
1.6838 - Y’day’s low
1.6723 - Last Thur’s low
1.6693 - May’s 5-week low

. GBP/USD - 1.6791… Despite cable dropped to 1.6738 shortly after Asian open on Wed. Price rallied to 1.6797 in European morning after jobs data showed U.K. unemployment fell to its lowest lvl since early 2009. Later, cable extended intra-day gain to session high of 1.6812 in NY b4 retreating.

. Looking at the hourly n daily charts, despite y’day’s rebound fm 1.6838, as mentioned in previous update, the early selloff fm last Fri’s high of 1.6845 signals correction fm May’s 5-week trough at 1.6693 has ended there n as long as 1.6833 (Mon’s high) holds, downside bias remains for another decline twd 1.6723 (last Thur’s low) after consolidation, below wud yield re-test of aforesaid low at 1.6693 but break there needed to confirm early fall fm May’s near 5-year peak at 1.6997 (Reuters) to retrace MT uptrend has finally resumed n yield weakness to 1.6657 n then 1.6595, being the Apr 15 low n 1.23 times extension of 1.6997-1.6732 measured fm 1.6923.

. Today, as cable is currently trading abv the 21-hr n 55-hr emas, suggesting near term upside bias remains, abv 1.6812 may yield gain to 1.6833 but only break of 1.6845 bring stronger retracement twd 1.6881 (61.8% r of 1.6997-1.6693).

[B]DAILY TECHNICAL OUTLOOK ON GBP/USD[/B]

Last Update At [B]19 Jun 2014[/B] [I]00:47GMT[/I]

[B]Trend Daily Chart [/B]
Sideways

[B]Daily Indicators [/B]
Rising

[B]21 HR EMA [/B]
1.6971

[B]55 HR EMA[/B]
1.6963

[B]Trend Hourly Chart [/B]
Up

[B]Hourly Indicators [/B]
Rising

[B]13 HR RSI [/B]
66

[B]14 HR DMI[/B]
+ve

[B]Daily Analysis[/B]
Consolidation b4 one more rise

[B]Resistance [/B]
1.7078 - 2.236 time ext. of .6693-1.6845 fm 1.6738
1.7044 - Aug 05 (2009) high
1.7011 - Mon’s fresh 5-year peak

[B]Support[/B]
1.6920 - Y’day’s low
1.6890 - 38.2% r of 1.6693-1.7011
1.6860 - Last Fri’s high (now sup)

. [B] GBP/USD [/B]- 1.6995… Cable swung wildly in volatile session Wed. Despite a brief jump to 1.7005 after BoE’s minutes, price swiftly tumbled to 1.6932 as statements fm BoE tempered speculation of a U.K. rate hike soon. Later, cable fell to 1.6920 in NY n then rose to 1.7001 after FOMC rate & policy decision.

. Looking at the hourly n daily charts, y’day’s rally fm 1.6920 strongly
suggests cable’s correction fm Mon’s 5-year peak at 1.7011 has ended there n intra-day bullishness remains for re-test of said res lvl, abv there wud bring
re-test of major res at 1.7044, this was 2009 peak as well as the reaction high fm 2009 multi-decade trough at 1.3500, a daily close abv wud encourage for further headway to 1.7100, then twd measured upside target at 1.7300, this is 100% proj. of intermediate rise fm 1.4814-1.6260 measured fm 1.5854. Our weekly strategy is holding a long position in anticipation of a gain to 1.7100.

. Today, as current price is trading abv the 21-hr & 55-hr emas, buying
the pound on dips is the way to go n only below 1.6920 wud dampen current bullish scenario, risk weakness to 1.6906/07 nut 1.6875 (50% r fm 1.6738) shud hold.

DAILY TECHNICAL OUTLOOK ON GBP/USD

Last Update At 25 Jun 2014 00:16GMT

Trend Daily Chart

Up

Daily Indicators
Rising

21 HR EMA
1.6991

55 HR EMA
1.7004

Trend Hourly Chart
Nr term down

Hourly Indicators

Rising fm o/s

13 HR RSI
38

14 HR DMI
-ve

Daily Analysis
Consolidation with downside bias

Resistance
1.7091 - 61.8% proj. of 1.6738-1.7011 fm 1.6922
1.7064 - Last Thur’s fresh 5-1/2 year peak
1.7034 - Y’day’s high

Support
1.6966 - Y’day’s low
1.6920 - Last Wed’s low
1.6878 - 50% r of 1.6693-1.7064

. GBP/USD - 1.6980… Despite cable’s sideways move after retreating fm Australian high of 1.7034 to 1.7017 in Asia, price tumbled to 1.6973 in European morning after dovish remarks fm BoE Governor Mark Carney. Later, cable fell further to 1.6966 in NY session due to upbeat U.S. economic data b4 recovering.

. Looking at the hourly n daily charts, although cable’s brief breach of
key res at 1.7044 (2009 Aug’s reaction high fm Jan’s 24-year trough at 1.3500) last week to a 5-1/2 year peak at 1.7064 on Thur confirms the near 5-year long broad sideways consolidation has ended n aforesaid rise to correct LT downtrend fm 2.1162 (2007 multi-decade peak) is expected to head to 1.7136 in early July, y’day’s breach of Mon’s low at 1.7002 suggest a long-awaited correction has occured n consolidation with downside bias is seen for a retracement twd 1.6920 (last week’s low). Having said that, as hourly oscillators wud display minor bullish convergences on such a move, reckon 1.6878, this is the ‘natural’ 50% r of 1.6993-1.7064, wud hold n yield strg rebound later this week.

. Today, selling cable on recovery for weakness to 1.6920 is recommended. Only abv 1.7064 aborts this mildly bearish scenario n extends gain twd 1.7095.

[B]DAILY GBP/USD TECHNICAL OUTLOOK[/B]

Last Update At [B]17 Jul 2014[/B] 00:10GMT

[B]Trend Daily Chart [/B]
Up

[B]Daily Indicators[/B]
Bearish divergences

[B]21 HR EMA [/B]
1.7136

[B]55 HR EMA[/B]
1.7130

[B]Trend Hourly Chart[/B]
Up

[B]Hourly Indicators[/B]
Neutral

[B]13 HR RSI [/B]
52

[B]14 HR DMI[/B]
+ve

[B]Daily Analysis[/B]
One more rise b4 correction

[B]Resistance[/B]
1.7287 - 100% proj. of 1.6952-1.7180 fm 1.7059
1.7230 - 100% proj. of 1.6460-1.6997 fm 1.6693
1.7192 - Tue’s fresh near 6-year high

[B]Support[/B]
1.7113 - Y’day’s low
1.7085 - Last week’s low (Jul 08)
1.7059 - Y’day’s low

. [B]GBP/USD[/B] - 1.7138 … The British pound chopped around in a tight range as eur/usd took centre stage in Wed’s session. Despite edging higher to intra-day top at 1.7151 in Europe, price briefly dipped to session low of 1.7113 after UK wage rise came in lower than forecast, cable later moved narrowly in NY trading.

. Looking at the hourly & daily charts, Tue’s rally to a fresh near 6-year peak of 1.7192 confirms long-term uptrend has once again resumed n as long as 1.7059 sup holds, gain twd 1.7230 is envisaged (being 100% projection of 1.6460-1.6997 measured fm 1.6693). Having said that, as both hourly & daily technical indicators wud display prominent ‘bearish divergences’ on such move, reckon 1.7303, this is 50% proj. of intermediate rise fm 1.6693-1.7180 measured fm 1.7059 shud cap upside n risk has increased for a long-overdue strg correction to take place later this month, so die-hard sterling bulls shud book profit on upmove. A daily close below 1.7059 wud confirm temporary top is in place n risk wud shift to the downside for subsequent weakness twd 1.6942 (50% r of 1.6693-1.7180).

. Today, as long as said y’day’s 1.7113 low holds, resumption of uptrend to 1.7200 is envisaged but 1.7225/30 shud remain intact. Below 1.7113, 1.7085.

DAILY GBP/USD TECHNICAL OUTLOOK

Last Update At 30 Jul 2014 00:48GMT

Trend Daily Chart
Up

Daily Indicators
Falling

21 HR EMA
1.6953

55 HR EMA
1.6938

Trend Hourly Chart
Down

Hourly Indicators
Bullish convergences

13 HR RSI
69

14 HR DMI
-ve

Daily Analysis
Consolidation b4 marginal fall

Resistance
1.7054 - Last Thur’s high
1.7024 - Last Wed’s low (now res)
1.6995 - Y’day’s high

Support
1.6934 - Y’day’s low
1.6920 - Jun 18 low
1.6884 - 61.8% r of 1.6693-1.7180

. GBP/USD - 1.6946 … Despite cable’s brief drop to 1.6968 ahead of European open on Tue, the pair rebounded briefly to 1.6995 on short-covering in Europe but selling interest quickly emerged n cable tumbled to 1.6933 in NY morning after the release of much stronger-than-expected US consumer confidence.

. Looking at the daily picture, last week’s break of 1.7037 strongly suggests the LT uptrend has formed a temporary top at 1.7192 n y’day’s breach of indicated daily sup at 1.6952 confirms this view n further weakness to 1.6919/20 (61.8% projection of 1.7095-1.6962 measured fm 1.7001 n Jun 18 low respectively) wud be seen, however, as hourly oscillators’ readings have displayed ‘bullish convergences’, steep decline is unlikely to be seen. Going forward, a daily close below 1.6920 wud send cable lower to 1.6845 n then twd 1.6738 in Aug.

. Today, we’re holding a short position in anticipation of marginal weakness to 1.6920 n wud look to sell cable again on subsequent recovery as only abv 1.6995/01 res area (y’day’s n Mon’s high respectively) wud confirm a temp. low is made n risk retracement to 1.7024, break wud bring stronger gain to 1.7054, however, 1.7095/99 res area is expected to remain intact.

[B]WEEKLY GBP/USD TECHNICAL OUTLOOK[/B]
Last Update At [B]11 Aug 2014[/B] [I]00:18GMT[/I]

[B]Trend Daily Chart [/B]
Down

[B]Daily Indicators [/B]
Falling

[B]21 HR EMA [/B]
1.6789

[B]55 HR EMA[/B]
1.6812

[B]Trend Hourly Chart [/B]
Down

[B]Hourly Indicators [/B]
Falling

[B]13 HR RSI [/B]
39

[B]14 HR DMI[/B]
-ve

[B]Daily Analysis[/B]
Consolidation b4 decline resumes

[B]Resistance [/B]
1.6890 - Last Tue’s high
1.6865 - Last Thur’s high
1.6812 - Jul 31 low (now res)

[B]Support[/B]
1.6767 - Last Fri’s low
1.6738 - Jun 11 low
1.6693 - May 29 low

   [B]GBP/USD - [/B]1.6780... Despite staging a minor recovery to 1.6890 last Tue, the British pound continued its recent decent fm Jul's near 6-year peak at 1.7192 to a 7-week low of 1.6767 on Fri due to active selling of gbp vs eur & yen. 

. Looking at the bigger picture, cable’s aforesaid sell off from 1.7192 confirms the LT uptrend fm 1.3500 (2009 bottom) has indeed made a top there n current declining daily technical indicators suggest price is en route to re-test next daily chart obj. at 1.6693 (May’s low), break of this key sup wud pressure price to 1.6655, being 61.8% proj. of said fall fm 1.7192 to 1.6812 measured fm 1.6890, as both daily & hourly oscillators’ readings wud be in o/sold territory on such a move, steep fall is therefore not envisaged n reckon 1.6523, this is the ‘natural’ 50% r of the intermediate rise fm 1.5854 to 1.7192), wud contain weakness n bring correction later. Whilst selling cable again on recovery is the way to go, profit shud be taken on subsequent decline. On the upside, only abv 1.6890 wud confirm a temporary low is made but 1.6933 shud cap upside.

. Today, in view of abv analysis, selling cable on intra-day recovery is recommended but 1.6693 shud remain intact n bring minor correction.

DAILY GBP/USD TECHNICAL OUTLOOK
Last Update At 20 Aug 2014 00:29GMT

Trend Daily Chart
Down

Daily Indicators
Falling

21 HR EMA
1.6641

55 HR EMA
1.6674

Trend Hourly Chart
Down

Hourly Indicators
Rising fm o/s

13 HR RSI
21

14 HR DMI
-ve

Daily Analysis
Resumption of recent decline

Resistance
1.6739 - Mon’s high
1.6680 - Last Fri’s NY low
1.6657 - Last Thur’s low (now res)

Support
1.6611 - Y’day’s 4-month low
1.6584 - 1.618 ext. of 1.7001-1.6812 fm 1.6890
1.6554 - Apr 04 low

. GBP/USD - 1.6720 …Despite Mon’s brief bounce to 1.6739 in NZ following BoE Carney’s hawkish comments in UK Sun Times, the British pound tumbled on Tue after the release of surprise lower-than-expected U.K. CPI data. Price easily penetrated last Thur’s 1.6657 trough to a fresh 4-month low at 1.6611 in NY.

. Looking at the hourly n daily charts, y’day’s selloff confirms MT down-trend fm Jul’s near 6-year peak of 1.7192 resumed n a stronger retracement of the LT uptrend fm 2009 trough at 1.3500 remains in force n as long as 1.6739 res holds, downside bias remains for further weakness to next daily minor sup at 1.6551, however, as hourly oscillators wud display minor bullish convergences on next fall, suggesting downside wud be ltd to 1.6523/10 (50% r of 1.5854-1.7192 n equality proj. of 1.7192-1.6812 fm 1.6890 respectively) n risk fm there has increased for a much-needed rebound.

. In view of current bearish scenario, selling cable again on recovery in anticipation of further weakness is the way to go. On the upside, only a breach of 1.6739 res (Mon’s high) wud violate recent series of lower high n lower lows fm 1.7192 top (Jul) n risk stronger retracement to 1.6780/90.

[B]DAILY GBP/USD TECHNICAL OUTLOOK[/B]
Last Update At [B]26 Aug 2014 [/B] [I]00:38GMT[/I]

[B]Trend Daily Chart [/B]
Down

[B]Daily Indicators[/B]
Falling

[B]21 HR EMA[/B]
1.6575

[B]55 HR EMA[/B]
1.6580

[B]Trend Hourly Chart [/B]
Sideways

[B]Hourly Indicators [/B]
Neutral

[B]13 HR RSI [/B]
45

[B]14 HR DMI[/B]
+ve

[B]Daily Analysis[/B]
Consolidation b4 marginal fall

[B]Resistance [/B]
1.6680 - Last Wed’s high
1.6655 - Last Wed’s NY high
1.6602 - Last Thur’s high

[B]Support[/B]
1.6535 - Y’day’s NZ low
1.6523 - 50% r of 1.5854-1.7192
1.6460 - Mar 24 low

. [B]GBP/USD[/B] - 1.6570… The British pound opened lower in tandem with euro
to 1.6535 in NZ on Mon following Fri’s balanced comments fm Fed Chair Yellen n
Sat’s ‘dovish’ remarks from BOE Dep. Governor Ben Broadbent in Jackson Hole but
short-covering lifted price to 1.6599 ahead of NY open b4 retreating.

. Although cable’s rebound fm said y’day’s fresh 4-1/2 month trough at
1.6535 suggests a temporary low has been been made n choppy consolidation wud be
seen, as daily technical indicators are still pointing hard down, suggesting as
long as 1.6655/57 (being 38.2% r of 1.6850-1.6535 n Aug 14 low, now res respect-
ively) holds, bearishness remains for MT decline fm Jul’s near 6-year peak at
1.7192 to resume n yield a re-test of said sup, below wud extend marginal weak-
ness below 1.6523 (50% r of LT intermediate rise fm 1.5854-1.7192), however,
prominent ‘bullish convergences’ on the hourly oscillators shud limit downside
to 1.6500/10 n yield a much-needed correction later.

. Today, selling cable on further recovery in anticipation of a resumption
of decline is still favoured, however, one may turn cautious buyer on next margi
nal fall for a rebound but reckon 1.6657 (prev. low, now res) shud cap upside.

WEEKLY GBP/USD TECHNICAL OUTLOOK
Last Update At 01 Sep 2014 00:05GMT

Trend Daily Chart
Down

Daily Indicators
Falling

21 HR EMA
1.6589

55 HR EMA
1.6586

Trend Hourly Chart
Sideways

Hourly Indicators
Neutral

13 HR RSI
53

14 HR DMI

+ve

Daily Analysis
Consolidation b4 one more fall

Resistance
1.6680 - Last Wed’s high
1.6657 - Aug 14 low
1.6615 - Last Thur’s high

Support
1.6535 - Last Mon’s low (NZ)
1.6523 - 50% r of 1.5854-1.7192
1.6460 - Mar 24 low

. GBP/USD - 1.6593… Despite a gap-down open to a 4-1/2 month trough of 1.6535 in NZ last Mon, cable swung wildly for rest of the week. Price staged a short-covering rebound to 1.6599 on Mon b4 falling back to 1.6537 at Wed open but only to climb to a 1-week high of 1.6615 Thur, then moved sideways on Fri.

. Looking at the bigger picture, although sterling finally found respite after enduring 6 weeks of losing streak n initial choppy trading abv 1.6535 is envisaged, a daily close abv 1.6657 (prev. low) is needed to confirm MT fall fm 2014 6-year peak at 1.7192 (Jul) has finally made a temporary low, then stronger gain to 1.6680 res wud be seen, a break there wud violate the recent series of lower highs n lower lows n yield corerction twd 1.6864 (50% r of 1.7192-1.6535).

Until then, as dlr is expected to rise vs its major peers, selling the pound in anticipation of resumption of MT downtrend to 1.6523 (50% r of LT intermediate rise fm 1.5854-1.7192) is still favoured, reckon daily up at 1.6460 (Mar low) may hold on 1st testing.

. Today, intra-day weakness in eur/usd shud weigh on cable n as long as 1.6615 holds, decline twd 1.6535 is likely n only abv 1.6555/57 risks 1.6580.

DAILY GBP/USD TECHNICAL OUTLOOK
Last Update At 05 Sept 2014 01:20GMT

Trend Daily Chart
Down

Daily Indicators
Falling

21 HR EMA
1.6365

55 HR EMA
1.6326

Trend Hourly Chart
Down

Hourly Indicators
Rising fm o/s

13 HR RSI
23

14 HR DMI
-ve

Daily Analysis
Resumption of MT downtrend

Resistance
1.6498 - Wed’s high
1.6440 - Wed’s low
1.6395 - Reaction low after ECB rate cut, now res

Support
1.6287 - Intra-day low (AUS)
1.6252 - Feb 04 low
1.6215 - Dec 17 low

. GBP/USD - 1.6306 … Although cable showed muted reaction to BoE’s rate decision, intra-day sharp sell off in euro on surprise ECB rate cuts pushed price lower to 1.6395. Despite a brief bounce to 1.6441 on short-covering, cable tanked to 1.6330 after upbeat U.S.data, price then fell further to 1.6287 in Aust.

. Let’s look at the bigger picture 1st, y’day’s sharp sell off confirms MT downtrend fm 2014 6-year peak at 1.7192 (Jul) to retrace LT intermediate up move fm 1.4814 (Jul 13’) remains in force n weakness to 1.6275 (1.618 times extension of 1.7192-1.6812 measured fm 1.6890) wud be forthcoming soon, then 1.6252 (2014 low on Feb), however, as daily indicators are in o/sold territory, steep fall below 1.6239, being 61.8% projection of 1.7192-1.6535 measured fm 1.6645, may not be seen n risk has increased for a much-needed minor correction to take place next week b4 prospect of another fall. Looking ahead, cable is en route to psychological target at 1.6000 in the latter part of Sept.

. In view of current bearish scenario, selling cable is the way to go. On the upside, only move back abv 1.6395 (y’day’s reaction low after ECB rate cut, now res) wud signal temp. low is made but 1.6440 shud remain intact.

[B]DAILY GBP/USD TECHNICAL OUTLOOK[/B]
Last Update At [B]12 Sep 2014[/B] [I]00:28GMT[/I]

[B]Trend Daily Chart [/B]
Down

[B]Daily Indicators [/B]
Rising fm o/s

[B]21 HR EMA[/B]
1.6232

[B]55 HR EMA[/B]
1.6203
[B]
Trend Hourly Chart[/B]
Near term up

[B]Hourly Indicators[/B]
Turning down
[B]
13 HR RSI[/B]
54

[B]14 HR DMI[/B]
+ve

[B]Daily Analysis[/B]
Marginal rise b4 strg retreat

[B]Resistance [/B]
1.6395 - Prev. hourly sup (now res)
1.6340 - Last Fri’s high
1.6281 - Last Fri’s low, now res

[B]Support[/B]
1.6186 - Y’day’s Asian low
1.6170 - Wed’s NY morning high
1.6052 - Y’day’s fresh near 10-month low

. [B]GBP/USD [/B]- 1.6241 … Despite cable’s retreat fm Wed’s 1.6231 tpp to 1.6186 in Asia on Thur, renewed buying interest contained weakness n price resumed upmove fm Wed’s near 10-month low at 1.6052 fm in Europe. Cable later rose to 1.6270 in NY morning b4 retreating to 1.6215 n then climbed to 1.6277 in Aust.

. Cable’s strg rebound fm 1.6052 to as high as 1.6270 confirms the recent MT downtrend fm Jul’s near 6-year peak at 1.7192 has finally formed a temporary bottom there as this low was accompanied by prominent ‘bullish convergences’ on the hourly oscillators, therefore, a few days of choppy consolidation wud be seen n stronger retracement to 1.6279/81 (‘minimum’ 38.2% r of intermediate fall fm 1.6645-1.6052 n last Fri’s sup, now res respectively) is envisaged, however, reckon res at 1.6340 (last Fri’s high) wud cap upside n yield another fall. On the downside, only a breach of 1.6052 wud extend weakness twd 1.6000 next week.

. Today, as current price is still trading abv 21-hr n 55-hr emas, suggesting near term upside bias remains n buying on dips is favoured in anticipation of marginal rise, however, one can sell on next upmove. On the downside, below 1.6125 sup wud signal correction is over n yield weakness to 1.6080/90.

[B]DAILY GBP/USD TECHNICAL OUTLOOK[/B]
Last Update At [B]17 Sep 2014[/B] [I]00:31GMT
[/I]
[B]Trend Daily Chart [/B]
Down

[B]Daily Indicators [/B]
Turning up

[B]21 HR EMA [/B]
1.6247

[B]55 HR EMA[/B]
1.6257
[B]
Trend Hourly Chart [/B]
Near term up

[B]Hourly Indicators[/B]
Bearish divergences

[B]13 HR RSI [/B]
55

[B]14 HR DMI[/B]
+ve

[B]Daily Analysis[/B]
Consolidation with upside bias

[B]Resistance[/B]
1.6395 - Prev. hourly sup (now res)
1.6340 - Sep 05 high
1.6310 - Y’day’s high

[B]Support[/B]
1.6205 - Last Fri’s low
1.6162 - Y’day’s low
1.6125 - Hourly chart sup

. [B] GBP/USD[/B] - 1.6256… The pound went through a rollar-coaster session on Tue due to market jitters ahead of Thur’s Scottish referendum. Cable penetrated last Fri’s 1.6205 low to 1.6162 in Europe but later jumped to as high as 1.6310 in NY due to dollar’s broad-based weakness but briefly dipped to 1.6240.

. Looking at the hourly n daily charts, y’day’s strg rebound to 1.6310 due to dlr’s broad-based weakness together with active unwinding in cable suggests corrective rise fm last Wed’s low at 1.6052 to retrace MT downtrend fm Jul’s near 6-year peak at 1.7192 remains in progress n abv 1.6310 wud bring stronger gain to 1.6340 res (Sep 05 post-U.S. NFP high), however, high readings on hourly oscillators shud cap price below 1.6415/18 (38.2% r of 1.7001-1.6052 n 61.8% r of 1.6645-1.6052 respectively) n yield decline later. On the downside, below 1.6162 anytime wud confirm said correction fm 1.6052 is over instead n bring weakness to 1.6125 but 1.6052 shud hold until referendum results are known.

. Today, as current price is trading abv 21-hr n 55-hr emas, buying cable on dips in anticipation of further gain is cautiously favoured but profit shud be taken on subsequent rise.

DAILY GBP/USD TECHNICAL OUTLOOK
Last Update At 22 Sep 2014 23:59GMT

Trend Daily Chart
Down

Daily Indicators
Turning up

21 HR EMA
1.6351

55 HR EMA
1.6347

Trend Hourly Chart
Sideways

Hourly Indicators
Rising

13 HR RSI
61

14 HR DMI
+ve

Daily Analysis
Initial rise b4 strg retreat

Resistance
1.6481 - Last Fri’s European high
1.6433 - 61.8% r of 1.6525-1.6284
1.6403 - Hourly chart

Support
1.6322 - Y’day’s low
1.6284 - Last Fri’s NY low
1.6247 - Last Thur’s low (AUS)

. GBP/USD - 1.6371 … The British pound tracked euro’s movement closely on Mon. Despite initial weakness to 1.6287 in NZ, cable rebounded after holding abv last Fri’s 1.6584 low to 1.6666 in European morning. Despite a retreat to 0.6322, cable climbed to 1.6369 near NY close, then 1.6373 ahead of Asian open.

. Looking at the hourly & daily charts, y’day’s rebound suggests the strg retreat fm last Fri’s high at 1.6525 to 1.6284 has formed a temporary low there 1-2 days of choppy consolidation wud be seen with mild upside bias. Although further gain to 1.6403/05 (being hourly res n 50% r of 1.6525-1.6284 respectively) cannot be ruled out, reckon ‘dynamic’ res at 1.6433 (61.8% r) wud cap upside n yield another decline later. Looking ahead, although cable’s strg rebound fm Sep’s near 10-month trough at 1.6052 confirmed MT fall fm Jul’s near 6-year peak at 1.7192 has made a temporary low, last Fri’s sell off signals at least the leg of correction is over n weakness to 1.6233 (61.8% r) is expected, below, 1.6052.

. Today, cable’s intra-day firmness due partly to cross-buying in sterling wud extend marginal gain, indicated res 1.6403/05 shud cap upside n yield subsequent decline. Selling on up move for weakness twd 1.6322 is therefore favoured.

DAILY GBP/USD TECHNICAL OUTLOOK
Last Update At 26 Sep 2014 00:45GMT

Trend Daily Chart
Down

Daily Indicators
Turning up

21 HR EMA
1.6321

55 HR EMA
1.6336

Trend Hourly Chart
Sideways

Hourly Indicators
Turning up

13 HR RSI
54

14 HR DMI
-ve

Daily Analysis
Consolidation b4 one more fall

Resistance
1.6416 - Tue’s high
1.6373 - Wed’s European morning low
1.6353 - Tue’s NY low

Support
1.6276 - Y’day’s low
1.6247 - Last Thur’s low (AUS)
1.6262 - Sep 16 low

. GBP/USD - 1.6330 … The British pound swung wildly y’day. Price briefly penetrated last Fri’s low at 1.6284 to 1.6276 in European morning, price staged a failed rally after mildly hawkish comments fm BOE’s Carney but quickly reteated to 1.6294 in choppy NY session n later ratcheted higher near NY close.

. Although cable’s rebound after y’day’s resumption of decline fm last Fri;s 1.6525 to 1.6276, as this move signals at least the 1st leg of correction fm Sep’s 9-1/2 month trough at 1.6052, downside bias remains for weakness twd 1.6233, this is the ‘dynamic’ 61.8% r of aforesaid rise. Below 1.6233 wud yield subsequent weakness twd 1.6175 (equality proj. of 1.6525-1.6284 measured fm 1.6416) but a daily close of 1.6162 sup is needed to signal correction fm 1.6052 is over. On the upside, only a daily close abv 1.6416 wud risk stronger gain to 1.6433 (61.8% r of 1.6525-1.6284) but reckon 1.6481 (last Fri’s European high) wud cap upside.

. Today, we’re holding a short position in anticipation of further weakness after initial consolidation in Asia but profit shud be taken on subsequent decline. Aabv 1.6373 may risk stronger gain to 1.6413/16 res area.

[B]WEEKLY GBP/USD TECHNICAL OUTLOOK[/B]
Last Update At [B]13 Oct 2014[/B] [I]00:19GMT[/I]

[B]Trend Daily Chart [/B]
Down

[B]Daily Indicators [/B]
Bullish convergences

[B]21 HR EMA [/B]
1.6078

[B]55 HR EMA[/B]
1.6155

[B]Trend Hourly Chart [/B]
Near term down

[B]Hourly Indicators [/B]
Turn up

[B]13 HR RSI [/B]
55

[B]14 HR DMI[/B]
-ve

[B]Daily Analysis[/B]
Consolidation with downside bias

[B]Resistance [/B]
1.6151 - Last Thur’s Asian low (now res)
1.6136 - Last Fri’s high
1.6104 - last Thur’s low
[B]
Support[/B]
1.6009 - Last Fri’s low
1.5960 - Last Mon’s European low
1.5943 - Last Mon’s 11-month low

. [B]GBP/USD[/B] - 1.6091 … Although cable opened lower to an 11-month bottom of 1.5943 in NZ last Mon, price swiftly rallied on broad-based long liquidation in the greenback. The pound continued to ratchet higher to as high as 1.6227 on Thur b4 tumbling partly on cross-selling in sterling to 1.6009 in NY Fri.

. Let’s look at the daily picture 1st, despite cable’s aforesaid strg bounce fm 1.5943 to 1.6227, subsequent fall to 1.6009 signals correction is possibly over n a daily close below 1.6009 wud add credence to this view, then MT downtrend fm Jul’s near 6-year peak wud pressure the pound twd 1.5820, this is 61.8% projection of abovementioned decline fm 1.7192-1.6052 measured fm 1.6525. Having said that, as the daily technical indicators wud display prominent ‘bullish convergences’ on such move, reckon 1.5718 (Aug 2013 high, now sup) wud contain weakness. On the upside, failure to penetrate 1.5943 low n subsequent rise abv 1.6227 wud confirm a temporary low has been made, then risk wud shift to the upsdie for stronger retracement to 1.642 (‘minimum’ 38.2% r of 1.7192-1.5943).

. Today, although Fri’s rebound in NY afternoon signals decline fm 1.6227
has made a low at 1.6009, reckon 1.6136 wud cap upside n yield another decline.