AceTraderforex Aug 28, 2013: DAILY TECHNICAL Market Outlook on Majors GBP/USD

DAILY GBP/USD TECHNICAL OUTLOOK
Last Update At 16 Oct 2014 01:29GMT

Trend Daily Chart
Sideways

Daily Indicators
Bullish convergences

21 HR EMA
1.5965

55 HR EMA
1.5975

Trend Hourly Chart

Sideways

Hourly Indicators
Rising

13 HR RSI
59

14 HR DMI
+ve

Daily Analysis
Consolidation with upside bias

Resistance

1.6127 - Mon’s high
1.6070 - Y’day’s high
1.6021 - Hourly chart

Support
1.5940 - Prev. res, now sup
1.5875 - Y’day’s fresh 11-month in NY
1.5820 - 61.8% proj. of 1.7192-1.6052 fm 1.6525

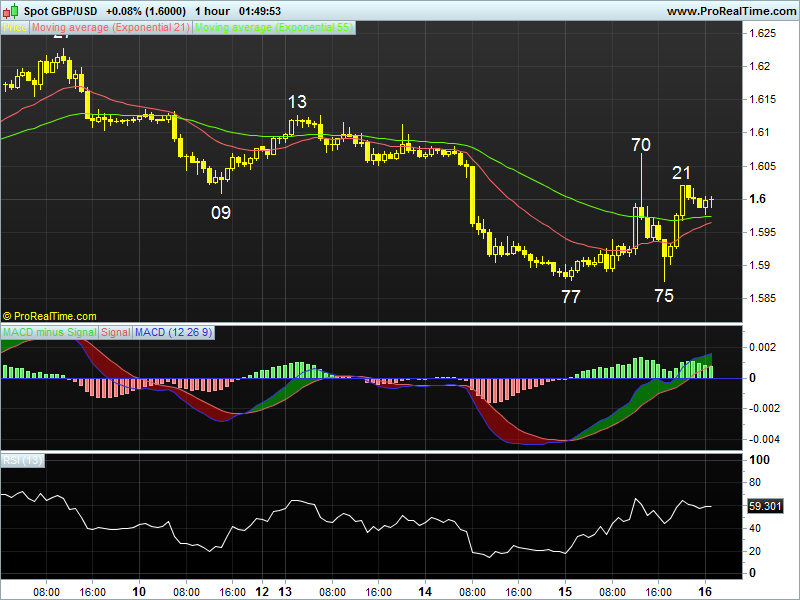
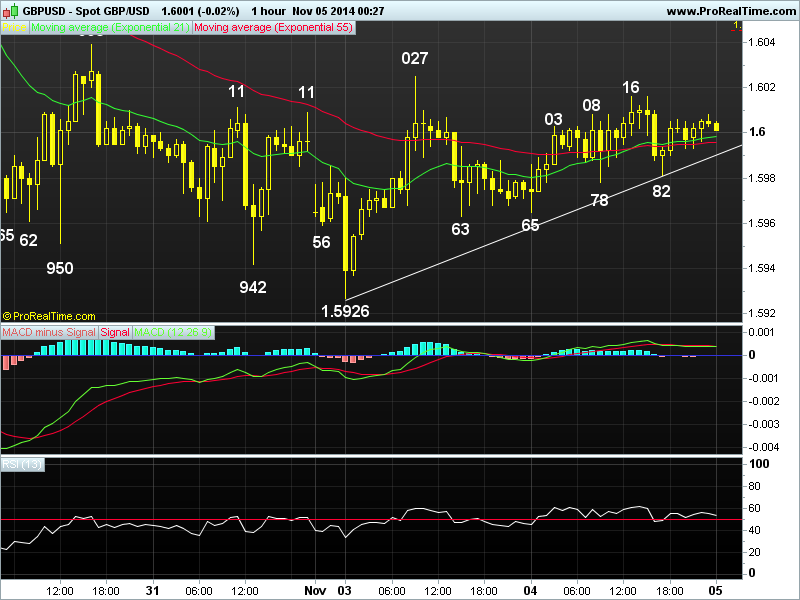
. GBP/USD - 1.5998 … Cable swung wildly on Wed. Despite initial drop to 1.5877 in Asia, short-covering lifted cable n the pair later rallied to as high as 1.6070 due to dlr’s broad-based weakness on downbeat U.S. retail sales. Price tumbled to fresh 11-month low at 1.5875 b4 rebounding to 1.6021 at NY close.

. Looking at the hourly n daily charts, y’day’s strg rebound fm 1.5875 to 1.6021 suggests MT downtrend fm Jul’s near 6-year peak at 1.7192 has possibly formed a temporary low there n few days of choppy consolidation with mild upside bias wud be seen, a breach of 1.6070 (y’day’s high in NY morning) anytime wud confirm this view n stronger retracement to 1.6123/27, being min. 38.2% r of intermediate fall of 1.6525-1.5875 n Mon’s high respectively, n then 1.6050/60 wud follow, however, hourly oscillators wud be in o/bot territory on such a move n price wud falter below 1.6200 (50% r fm 1.6525) n yield another fall next week.

. In view of abv analysis, buying cable on dips is recommended today n only a daily close below 1.5900 wud confirm aforementioned recovery is over n yield resumption of decline fm 1.7192 to re-test 1.5875, break wud extend to next downside obj. at 1.5820, this is 61.8% proj. of 1.7192-1.6052.

[B]DAILY GBP/USD TECHNICAL OUTLOOK[/B]
Last Update At [B]21 Oct 2014[/B] [I] 00:35GMT[/I]
[B]
Trend Daily Chart[/B]
Sideways

[B]Daily Indicators [/B]
Bullish convergences

[B]21 HR EMA [/B]
1.6141

[B]55 HR EMA[/B]
1.6106

[B]Trend Hourly Chart[/B]
Near term up

[B]Hourly Indicators[/B]
Rising

[B]13 HR RSI[/B]
65

[B]14 HR DMI[/B]
+ve

[B]Daily Analysis[/B]
Consolidation with upside bias

[B]Resistance [/B]
1.6227 - Oct 09 high
1.6200 - 50.0% r of 1.6525-1.5875
1.6179 - Y’day’s high

[B]Support[/B]
1.6127 - Hourly chart
1.6080 - Y’day’s low
1.6030 - Last Fri’s low

. [B]GBP/USD [/B]- 1.6164 … Despite y’day’s brief retreat to session low at 1.6080 at European open, the British pound pared intra-day loss n rose to 1.6151 at NY open, helped by active cross-buying of sterling vs euro. Price continued to trade with a firm bias n climbed to a high of 1.6179 in NY afternoon.

. Looking at the hourly n daily charts, y’day’s rally abv last Fri’s high at 1.6126 suggests MT downtrend fm Jul’s near 6-year peak at 1.7192 has formed a temporary low at last Wed’s fresh 11-month trough at 1.5875 n consolidation with upside bias wud be seen for a stronger retrace. to 1.6200, being the ‘natural’ 50% r of intermediate fall fm 1.6525. Having said that, as hourly oscillators wud wud display bearish divergences on next rise, reckon res at 1.6227 (Oct 09 high) shud remain intact n bring a much-needed retreat later. On the downside, only below last Fri’s low at 1.6030 wud indicate said recovery has ended instead n turn outlook bearish for weakness twds 1.5940.

. Today, in view of abv analysis, we’re trading cable on both sides of the market n buy on intra-day retreat for marginal gain twd 1.6200 or sell if price
climbs to there 1st for a much-needed retracement. Below 1.6080, 1.6030/40.

WEEKLY GBP/USD TECHNICAL OUTLOOK
Last Update At 27 Oct 2014 00:11GMT

Trend Daily Chart
Sideways

Daily Indicators
Bullish convergences

21 HR EMA
1.6073

55 HR EMA
1.6064

Trend Hourly Chart
Near term up

Hourly Indicators
Rising

13 HR RSI
59

14 HR DMI
+ve

Daily Analysis
Consolidation with upside bias

Resistance
1.6186 - Last Tue’s high
1.6131 - Wed’s high
1.6104 - Mon’s high (Aust.)

Support
1.6017 - Last Fri’s low
1.5995 - Y’day’s low
1.5966 - 70.7% r of 1.5875-1.6186

. GBP/USD - 1.6089 … Although the pound extended previous week’s up move fm Oct’s 11-month trough at 1.5875 to 1.6186 last Tue, release of ‘dovish’ BoE minutes sent cable tanking to 1.6012, then 1.5995 Thur. Price managed to stage a short-covering rebound to 1.6099 due to usd’s weakness in in NY morning on Fri.

. Let’s look at the bigger picture 1st, cable’s aforesaid rebound fm 1.5875 to 1.6186 signals MT downtrend fm Jul’s near 6-year peak at 1.7192 has made a temporary low at 1.5875 n subsequent retreat fm 1.6186 suggests consolidation with downside bias is envisaged this week, a daily close below 1.5995 wud signal correction is over, then weakness twd 1.5875 wud be seen, however, as both the hourly & daily indicators wud display ‘bullish convergences’ on next decline, reckon projected sup at 1.5820, being 61.8% proj. of MT fall fm 1.7192-1.6052 measured fm 1.6525, wud contain weakness. On the upside, abv 1.6186 (reaction high fm 1.5875) wud confirm MT decline fm 1.7192 has indeed made a temporary low, the gain to 1.6379 wud be seen, this is 38.2% r fm 1.7192.

. Today, w/end’s hawkish comments by BoE’s McCafferty sent cable briefly to 1.6104, n gain to 1.6140 may be seen but 1.6186 shud hold n yield retreat.

DAILY GBP/USD TECHNICAL OUTLOOK
Last Update At 31 Oct 2014 00:40GMT

Trend Daily Chart
Sideways

Daily Indicators
Bullish convergences

21 HR EMA
1.6006

55 HR EMA
1.6039

Trend Hourly Chart
Dow

Hourly Indicators
Bullish convergences

13 HR RSI
43

14 HR DMI
-ve

Daily Analysis
Consolidatin b4 one more fall

Resistance
1.6103 - Y’day’s NY morning low
1.6089 - Tue’s low
1.6038 - Y’day’s high

Support
1.5950 - Y’day’s low
1.5875 - Oct 15 low
1.5820 - 61.8% proj. of 1.7192-1.6052 fm 1.6525

. GBP/USD - 1.5993…Cable weakened to 1.5967 in Asia on Thur n then 1.5762 in Europe on Thur following Wed’s FOMC selloff. Despite a minor bounce to .6009, price later briefly tumbled to session lows of 1.5950 after release of robust U.S. GDP but short-covering lifted price to 1.6038 b4 easing.

. Let’s look at the bigger picture 1st, Wed’s sharp sell off to 1.6003 n then 1.5950 Thur suggests the correction fm Oct’s 11-month low at 1.5875 has ended earlier at 1.6186 last Tue n consolidation with downside bias remains for weakness to 1.5940/50 sup area (Oct 16 n y’day’s low respectively), a daily close below there wud signal MT downtrend fm Jul’s near 6-year peak at 1.7192 has once again resumed n yield re-test of Oct’s 11-month low at 1.5875 next week. Looking ahead, below 1.5875 wud send cable lower to 1.5820, this is 50% proj. of the entire fall fm 1.7192-1.6052 measured fm 1.6525. Therefore, selling cable on recovery is the way to go n only abv 1.6088/89 (prev. sup, now res) wud dampen present bearish scenario on cable.

. Today, we’re holding a short position in anticipation of marginal fall but ‘bullish convergences’ on hourly indicators wud keep cable abv 1.5900/10.

[B]DAILY GBP/USD TECHNICAL OUTLOOK[/B]
Last Update At [B]05 Nov 2014[/B] [I]03:06GMT[/I]

[B]Trend Daily Chart[/B]
Sideways

[B]Daily Indicators[/B]
Bullish convergences

[B]21 HR EMA [/B]
1.5998

[B]55 HR EMA[/B]
1.5999

[B]Trend Hourly Chart[/B]
Sideways

[B]Hourly Indicators [/B]
Neutral

[B]13 HR RSI[/B]
54

[B]14 HR DMI[/B]
+ve

[B]Daily Analysis[/B]
Consolidation with downside bias

[B]Resistance [/B]
1.6103 - Hourly sup (now res)
1.6055 - 50% r of 1.6183-1.5926
1.6038 - Last Thur’s high

[B]Support[/B]
1.5963 - Reaction low fm 1.6027 (Mon)
1.5926 - Mon’s low
1.5875 - Oct 15 low

. [B]GBP/USD [/B]- 1.6001…The British pound found renewed buying at 1.5965 at Asian open Tue n continued to trade with a firm undertone in Asia. Price gained to 1.6008 in early European morning b4 retreating to 1.5978. Later, cable rose to session high of 1.6016 at NY open b4 retreating on cross-selling vs euro.

. Looking at the daily picture, although price has staged a recovery after Mon’s sharp retreat to 1.5926 n further choppy consolidation is envisaged for 1-2 days, as aforesaid move signals early correction fm 2014 trough at 1.5875 has indeed ended earlier at 1.6186 in Oct, reckon last Thur’s high at 1.6038 wud cap upside n bring another fall twd said sup. Below ther wud signal the MT downtrend fm Jul’s near 6-year peak at 1.7192 has possibly resumed n yield a re-test of 1.5875 later next week. On the upside, only abv 1.6055 (50% r of 1.6183-1.5926) wud indicate the pullback fm 1.6186 has ended instead n risk stronger gain twd 1.6103 (prev. sup, now res).

. Today, we are looking to sell cable on recovery to 1.6020 for weakness twd 1.5935 n only abv res 1.6038 wud prolong choppy trading n risk marginal gain but res at 1.6055 shud remain intact today n yield retreat.

DAILY GBP/USD TECHNICAL OUTLOOK

Last Update At 12 Nov 2014 00:48GMT

Trend Daily Chart

Down

Daily Indicators
Bullish convergences

21 HR EMA
1.5890

55 HR EMA
1.5880

Trend Hourly Chart
Near term up

Hourly Indicators
Rising

13 HR RSI
64

14 HR DMI
+ve

Daily Analysis
Consolidation with initial upsdie bias

Resistance
1.6004 - Nov 8 high
1.5962 - 100% proj. of 1.5790-1.5918 fm 1.5835
1.5945 - Y’day’s high

Support
1.5877 - Y’day’s hourly res, now sup
1.5835 - Y’day’s low
1.5790 - Last Fri’s 1-year low

. GBP/USD - 1.5912… The British pound tracked intra-day movements in the euro closely again on Tue. Despite initial weakness to 1.5836 in subdued European trading, price ratcheted higher on short-covering n the pair later jumped to as high as 1.5945 in thin NY afternoon b4 easing ahead of Asian open today.

. Y’day’s strg rebound fm 1.5835 to as high as 1.5945 suggests further volatile consolidation abv last Fri’s 1-year low of 1.5790 wud continue with upside bias n abv 1.5945 wud bring further gain to 1.5987 (50% r of 1.6183-1.57 90), however, only a daily close abv previous strg res at 1.6023/27 wud confirm MT downtrend fm 2014 peak at 1.7192 (Jul) has made a temporary low, then stronger gain to 1.6071 wud be seen, this is a ‘minimum’ 38.2% r of the MT intermediate fall fm 1.6525, however, reckon 1.6158 (50% r) shud cap upside. On the downside, failure to penetrate 1.5945 n subsequent break of 1.5835 wud signal aforesaid MT downtrend has resumed n weakness to 1.5770 wud follow, however, ‘bullish convergences’ on hourly & daily indicators shud keep price abv 1.5710.

. Today, in view of abv analysis, buying cable on dips is favoured but pay attention to release of official U.K. data as well as BoE Inflation Report.

DAILY GBP/USD TECHNICAL OUTLOOK
Last Update At 17 Nov 2014 00:31GMT

Trend Daily Chart
Down

Daily Indicators
Bullish convergences

21 HR EMA
1.5774

55 HR EMA
1.5614

Trend Hourly Chart
Sideways

Hourly Indicators
Turning up

13 HR RSI
54

14 HR DMI
-ve

Daily Analysis
Consolidation with a neutral bias

Resistance
1.5790 - Nov 09 low (now res)
1.5760 - Last Thur’s Aust. low
1.5695 - Last Fri’s NY high

Support
1.5632 - 61.8% r of 1.5593-1.5695
1.5593 - Last Fri’s fresh 14-month low
1.5536 - 100% proj. of 1.6525-1.5875 fm 1.6186

. GBP/USD - 1.5689… Despite trading initially abv its previous week’s 1-year low of 1.5790 last week n recovering to 1.5945 Tue, the British pound tumbled on Wed after dovish BoE Inflation Report. Cable remained under pressure due to active cross-selling in sterling n weakened to 1.5593 Fri b4 recovering.

. Let’s look at the bigger picture 1st, Fri’s sello ff to a fresh 14-month trough of 1.5593 suggests MT downtrend fm May’s near 6-year peak remains in progress n expect initial consolidation b4 extending further weakness to next projected downside target at 1.5536, this is equality measurement of intermediate fall fm 1.6525-1.5875 projected fm 1.6186. Having said that, as both hourly & daily technical indicators wud display ‘bullish convergences’ on such move, reckon 1.5456 (1.236 times extension of 1.6186-1.5790 fm 1.5945) wud contain weakness n bring correction later this week. On the upside, abv 1.5780/90 confirms a temporary low is made, then correction to 1.5835, 1.5877/82 wud follow.

. Today, although Fri’s rebound fm 1.5593 signals a minor low is made n buying on dips is favoured, one can later sell the pound on further intra-day gain as 1.5750/60 wud cap upside n yield subsequent retreat.

DAILY GBP/USD TECHNICAL OUTLOOK
Last Update At 20 Nov 2014 00:42GMT

Trend Daily Chart
Down

Daily Indicators
Bullish convergences

21 HR EMA
1.5666

55 HR EMA
1.5660

Trend Hourly Chart
Near term up

Hourly Indicators
Neutral

13 HR RSI
55

14 HR DMI
+ve

Daily Analysis
Choppy consolidation to continue

Resistance
1.5760 - Last Thur’s Aust. low
1.5737 - Mon’s high
1.5720 - Y’day’s NY high

Support
1.5647 - Y’day’s NY low
1.5620 - Mon’s low
1.5590 - Y’day’s fresh 14-mth low

. GBP/USD - 1.5674 … Despite cable’s brief drop below last Fri’s 1.5593 low to 1.5590 (1.55895 to be exact) in Europe, price jumped n later rallied to 1.5701 at European midday after MPC minutes showed 2 policy makers supported a rate rise. Price later climbed to 1.5720 after FOMC minutes b4 retreating.

. Looking at the hourly & daily charts, cable’s rally fm y’day’s fresh 14-month trough at 1.5590 to as high as 1.5720 signals MT downtrend fm Jul’s near 6-year peak at 1.7192 has made a temporary low there as aforesaid low was accompanied by prominent ‘bullish convergences’ on the hourly oscillators, subsequent macd’s rise abv the zero line adds credence to this view, suggesting a few days of choppy consolidation with upside bias wud be seen n abv 1.5737 res (this week’s high) wud bring stronger gain to 1.5768, this is a ‘natural’ 50% r of the intermedaite fall fm 1.5945-1.5590.
On the downside, a daily close below 1.5620 wud signal correction is over, then one more fall twd 1.5636 wud follow.

. Today, intra-day softness following y’day’s retreat fm 1.5720 suggests consolidation is in store with initial downside bias, however, reckon NY low at 1.5647 wud contain weakness n bring another rebound, abv 1.5720, 1.5737.

DAILY GBP/USD TECHNICAL OUTLOOK
Last Update At 24 Nov 2014 23:59GMT

Trend Daily Chart
Down

Daily Indicators
Bullish convergences

21 HR EMA
1.5685

55 HR EMA
1.5676

Trend Hourly Chart
Sideways

Hourly Indicators
Rising

13 HR RSI
56

14 HR DMI
+ve

Daily Analysis
Consolidation with mild downside bias

Resistance
1.5790 - Nov 07 low
1.5768 - 50% r of 1.5945-1.5590
1.5737 - Last Mon’s n Thur’s high

Support
1.5672 - Y’day’s NY hourly sup
1.5626 - Last Fri’s low
1.5590 - Last Wed’s fresh 14-mth low

. GBP/USD - 1.5695 … Despite opening lower to 1.5633 in New Zealand on Mon, the British pound rebounded to 1.5673 at European open, however, price briefly retreated to 1.5629 in tandem with eur/usd before rising to 1.5694 in NY morning. Cable later climbed to session high of 1.5715 b4 easing.

. Y’day’s strg rebound fm 1.5630 to 1.5715 suggests ‘choppy’ trading abv last Wed’s 14-month trough of 1.5590 wud continue, however, as long as res at 1.5737 (last Mon’s n Thur’s high) holds, downside bias remains for MT downtrend fm Jul’s near 6-year peak at 1.7192 to resume after consolidation, yield re-test of 1.5590 sup later, however, break needed to extend weakness to 1.5560, then 1.5518 (being 50% & 61.8% proj. respectively of 1.5945-1.5590 measured fm 1.5737), however, a daily technical indicators wud display ‘bullish convergences’ on such move, reckon 1.5346 wud contain weakness, this is the ‘dynamic’ 61.8% r of entire LT rise fm 1.3500 (2009 multi-decade low) to 1.7192.

. Today, we’re cautiously holding a short position in anticipation of a retreat to 1.5630. On the upside, a daily close abv 1.5737 wud risk stronger retracement to 1.5818 (38.2% r of 1.6186-1.5590) b4 prospect of another decline.

WEEKLY GBP/USD TECHNICAL OUTLOOK
Last Update At 01 Dec 2014 00:07GMT

Trend Daily Chart
Sideways

Daily Indicators
Turning up

21 HR EMA
1.5660

55 HR EMA
1.5795

Trend Hourly Chart
Down

Hourly Indicators
Falling

13 HR RSI
32

14 HR DMI
-ve

Daily Analysis
Possible resumption of MT downtrend

Resistance
1.5778 - Last Thur’s Asian low
1.5725 - Last Fri’s European high
1.5680 - Last wed’s low

Support
1.5603 - Intra-day low low
1.5590 - Nov 19 14-month low
1.5528 - 50% proj. of 1.6186-1.5590 fm 1.5826

. GBP/USD - 1.5617… Cable went through a roller-coaster session last wk. Although renewed buying at 1.5629 on Mon lifted price n continued short-covering helped price penetrate prev. week’s high at 1.5737 on Wed. Cable climbed to 1.5826 Thur but only to tumble 1.5614 on Fri due to 2-day sell off in the Brent.

. Looking at bigger picture, cable’s foresaid decline from 1.5826 signals the correction from November’s 14-month bottom at 1.5590 has ended there n price is en-route to re-test said temporary low soon, break wud confirm the MT downtrend fm Jul’s near 6-year peak at 1.7192 has once again resumed n yield further weakness to 1.5528, then 1.5458, being 50% & 61.8% projections respectively of intermediate fall fm 1.6186-1.5590 measured fm 1.5826. Having said that, as hourly & daily technical indicators wud display ‘bullish convergence’ on such move, reckon 1.5385 (100% proj. of 1.7192-1.6052 measured fm 1.6525) wud remain intact. On the upside, only abv 1.5826 wud confirm low is made n yield stronger correction twd next chart obj. at 1.5945 later this month.

. Today, price has fallen after meeting renewed selling at 1.5659 (AUS) n re-test of 1.5590 is envisaged, break wud extend to 1.5550/60 later today


DAILY GBP/USD TECHNICAL OUTLOOK
Last Update At 04 Dec 2014 00:17GMT

Trend Daily Chart
Sideways

Daily Indicators
Turning up

21 HR EMA
1.5679

55 HR EMA
1.5678

Trend Hourly Chart

Sideways

Hourly Indicators
Neutral

13 HR RSI
57

14 HR DMI
+ve

Daily Analysis
Choppy consolidation to continue

Resistance
1.5826 - Last Thur’s high
1.5763 - Mon’s high
1.5719 - Y’day’s high

Support
1.5619 - Y’day’s low
1.5585 - Mon’s fresh 14-1/2 month low
1.5528 - 50% proj. of 1.6186-1.5590 fm 1.5826

. GBP/USD - 1.5690… Cable swung wildly on Wed, despite a euro-led brief drop fm 1.5656 to 1.5619 in Europe, cross-buying in sterling lifted price n cable rebounded on short covering after upbeat U.K. services PMI n the upgrade of U.K. growth forecasts fm OBR. Price rose to 1.5719 in NY b4 retreating.

. Looking at the hourly n daily charts, despite cable’s strg decline after Mon’s rally fm a fresh 14-1/2 month trough at 1.5585 to 1.5763, y’day’s rebound fm 1.5619 suggests further choppy trading abv said temporary bottom wud continue . Although consolidation with near term upside bias is seen, as long as 1.5763 res (reaction high) holds, prospect of another fall later today or tom still remains. Looking ahead, a breach of 1.5619 wud signal MT downtrend fm Jul’s near 6-year peak at 1.7192 has resumed n bring re-test of 1.5585, break wud extend subsequent weakness to 1.5528, this is the 50% projection of intermediate fall fm 1.6186-1.5590 measured fm 1.5826.

. On the upside, abv 1.5763 wud confirm a temporary low is made instead n stronger retracement to 1.5826 wud follow. We are standing aside initially today n investors shud pay attention to the release of BoE rate decision at 12:00GMT.

WEEKLY GBP/USD TECHNICAL OUTLOOK
Last Update At 14 Dec 2014 23:46GMT

Trend Daily Chart
Down

Daily Indicators
Bullish convergences

21 HR EMA
1.5718

55 HR EMA
1.5708

Trend Hourly Chart
Sideways

Hourly Indicators
Neutral

13 HR RSI
56

14 HR DMI
+ve

Daily Analysis
Choppy consolidation to continue

Resistance
1.5791 - 61.8% r of 1.6145-1.5541
1.5763 - Last Mon’s high
1.5557 - Y’day’s high

Support
1.5652 - Y’day’s low
1.5648 - Wed’s low
1.5626 - Tue’s low

. GBP/USD - 1.5728… Although cable opened lower in tandem with eur/usd last Mon n fell to a fresh 14-month trough at 1.5541, however, rebound in the single ccy quickly led to short-covering in sterling, the pound ratcheted higher to 1.5757 on Thur b4 retreating to 1.5652. Price rebounded to 1.5746 Fri in NY.

. On the bigger picture, as cable’s aforesaid 2014 low at 1.5541 was accompanied by prominent ‘bullish convergences’ on the daily indicators, suggesting the MT downtrend fm Jul’s near 6-year peak at 1.7192 has possibly formed a temporary low there, a daily close abv 1.5757 wud add credence to this view, then price wud be en route to next chart obj. at 1.5826, break wud encourage for further headway twd 1.5875 (Oct’s low), then 1.5826. On the downside, only a failure to penetrate 1.5757 res n subsequent break below 1.5626/30 sup wud signal correction is over n yield re-test of 1.5541, then one more fall to 1.5500/10, however, reckon 1.5360 (equality measure. of 1.7192-1.6052 fm 1.6525) wud hold.

. Today, expect initial sideways move in Asia n as long as Fri’s low at 1.5696 holds, intra-day upside bias for re-test of 1.5757 1st, abv wud encourage for subsequent gain to 1.5770 , then 1.5785/87. Only below 1.5752 risks 1.5626.

DAILY GBP/USD TECHNICAL OUTLOOK
Last Update At 19 Dec 2014 00:06GMT

Trend Daily Chart
Down

Daily Indicators
Bullish convergences

21 HR EMA
1.5648

55 HR EMA
1.5654

Trend Hourly Chart
Nr term up

Hourly Indicators
Rising

13 HR RSI
58

14 HR DMI
+ve

Daily Analysis
Consolidation with upside bias

Resistance
1.5738 - Wed’s European high
1.5699 - Post-FOMC high Wed
1.5676 - Y’day’s high

Support
1.5605 - Y’day’s NY morning sup
1.5539 - Thur’s fresh 14-month low
1.5500 - Pychological sup

. GBP/USD - 1.5667… Although cable tracked euro’s intra-day move closely in Asia n early Europe on Thur n fell fm 1.5594 to 1.5551, buying interest abv Wed’s fresh 14-month low at 1.5539 lifted price fm there n cable later rallied to 1.5666 after upbeat U.K. retail sales n then 1.5676 in NY b4 easing.

. Looking at the hourly n daily charts, y’day’s rally after holding abv Wed’s fresh 14-month trough at 1.5539 strongly suggests the MT downtrend fm Jul’s near 6-year peak at 1.7192 has formed a temporary low there n as long as 1.5605 (y’day’s NY low) holds, stronger gain twd 1.5691/99 (being the ‘dynamic’ 61.8% r of 1.5785-1.5539 n post FOMC high respectively), abv there wud add credence to this view n further headway to 1.5738 (chart obj.) n then 1.5755 wud follow, however, as hourly oscillators wud be in o/bot territory on such a move, reckon 1.5755 (Wed’s high) wud cap upside n yield strg retreat later.

. In view of abv analysis, buying cable on dips is cautiously favoured today. On the downside, only below 1.5539 wud revive early bearishness n
risk subsequent weakness twd 1.5500 (psychological sup) but 1.5463 (50% proj. of 1.6186-1.5541 measured fm 1.5785) shud remain intact.

WEEKLY GBP/USD TECHNICAL OUTLOOK
Last Update At 28 Dec 2014 23:44GMT

Trend Daily Chart
Down

Daily Indicators
Bullish convergences

21 HR EMA
1.5556

55 HR EMA
1.5557

Trend Hourly Chart
Sideways

Hourly Indicators
Neutral

13 HR RSI
46

14 HR DMI
-ve

Daily Analysis
Consolidation with downside bias

Resistance
1.5682 - Dec 19 high
1.5608 - Last Tue’s high
1.5574 - Last Fri’s (Asia) high

Support
1.5686 - Last Tue’s 14-1/2 month low
1.5430 - Equality proj. of 1.5785-1.5539 fm 1.5682
1.5386 - 61.8% proj. of 1.6186-1.5541 fm 1.5785

. GBP/USD - 1.5551… The pound fell in tandem with euro at the start of last week n tanked to a fresh 14-1/2 month bottom of 1.5486 after the release of sharply higher revised U.S. Q3 GDP, however, short covering quickly lifted cable n price later ratcheted higher to 1.5574 in holiday-thinned Fri session.

. Looking at bigger picture, cable’s weakness to 1.5486 signals MT down-trend fm 2014 near 6-year peak at 1.7192 (Jul) has resumed n outlook remains mildly bearish for further weakness to 1.5463 n then 1.5386 after consolidation, this is 50% of the intermediate fall fm 1.6186-1.5541 measured fm 1.5785. Having said that, as daily technical indicators wud display prominent ‘bullish convergences’ on such move, reckon 1.5346, being a ‘natural’ 61.8% r of the entire LT rise fm 1.3500 (2009 multi-decade low) to 1.7192 wud remain intact. On the up-side, abv 1.5682 anytime wud confirm a temporary low is in place n risk stronger correction twd 1.5785 later.

. Today, the horizontal movement in the 21-hr & 55-hr emas suggests initial range trading is in store n as long as 1.5600/08 res area holds, downside bias remains but below 1.5486 needed to extend marginally to 1.5450/60.

DAILY GBP/USD TECHNICAL OUTLOOK
Last Update At 06 Jan 2015 00:40GMT

Trend Daily Chart
Down

Daily Indicators
Bullish convergences

21 HR EMA
1.5267

55 HR EMA
1.5345

Trend Hourly Chart
Down

Hourly Indicators
Turning up

13 HR RSI
45

14 HR DMI
-ve

Daily Analysis
Consolidation b4 one more fall

Resistance
1.5386 - Hourly sup (now res)
1.5352 - 38.2% r of 1.5621-1.5185
1.5320 - Y’day Asian high

Support
1.5203 - Y’day’s NY morning sup
1.5185 - Y’day’s fresh 16-month low (Reuters)
1.5137 - 1.618 times extn of 1.5785-1.5486 fm 1.5621

. GBP/USD - 1.5263… Cable tracked euro’s intra-day move closely on Mon. Despite falling sharply below Fri’s low of 1.5326 to a fresh 16-month trough at 1.5185 (Reuters) in thin Aust., short-covering lifted pound to 1.5320 in Asia b4 dropping to 1.5203 in NY morning. Cable later recovered to 1.5270 near NY close.

. Looking at the bigger picture, as mentioned previously, cable’s break of Dec’s 1.5486 to on 1.5326 Fri signals MT downtrend fm 2014 peak at 1.7192 (Jul) has once again resumed n a re-test of said Mon’s low wud be seen after consolidation, break wud extend weakness to 1.5137 (1.618 times extension of 1.5785-1.5486 measured fm 1.5621) n then 1.5100. Having said that, as the daily technical indicators wud display ‘bullish convergences’ on such move, reckon psychological sup at 1.5000 wud hold on 1st testing this week n risk a minor correction later. On the upside, only a daily close abv 1.5486 wud signal a temporary low is made, then retracement to 1.5555 n possibly twd 1.5621 is likely b4 down.

. Today, as 1.5320 has capped rebound fm 1.5185, selling cable on intra-day recovery is recommended. On the upside, only abv 1.5352 (38.2% r of 1.5621-1.5185) risks retracement twd 1.5403 (50% r) but 1.5454 (61.% r) shud hold.

DAILY GBP/USD TECHNICAL OUTLOOK
Last Update At 15 Jan 2015 01:17GMT

Trend Daily Chart
Down

Daily Indicators
Falling

21 HR EMA
1.5214

55 HR EMA
1.5187

Trend Hourly Chart
Sideways

Hourly Indicators
Rising

13 HR RSI
61

14 HR DMI
+ve

Daily Analysis
Consolidation with mild upside bias

Resistance
1.5397 - 61.8% r of 1.5621-1.5034
1.5320 - Last Mon’s high
1.5270 - Y’day’s high

Support
1.5195 - Mon’s high (AUS)
1.5145 - Y’day’s low in Asia
1.5077 - Tue’s low

. GBP/USD - 1.5239… Cable moved in a choppy fashion on Wed as despite cross-inspired rally fm Asian low at 1.5145 to 1.5225 in European morning, price retreated sharply to 1.5150 b4 climbing to a fresh 1-week high of 1.5270 in NY morning on broad-based weakness in greenback n then retreated to 1.5202.

. Looking at the hourly n daily charts, cable’s rallied abv Mon’s high of 1.5195 to 1.5270 y’day signals erratic rise fm last Thur’s 17-month low at 1.5034 to retrace recent decline remains in progress n upside bias is seen for stronger gain twds 1.5328/37, being the ‘natural’ 50% r of intermediate fall of
1.5621-1.5034 n 1.618 times extension of 1.5034-1.5195 measured fm 1.5077, after consolidation, however, 1.5397 (61.8% r of 1.5621-1.5034) shud hold n yield another fall later. Looking ahead, below 1.5034 wud signal MT downtrend fm 2014 peak at 1.7192 to correct the LT rise fm 1.3500 (2009 low in Jan) has resumed n price is en route to 1.5000 n then 1.4910, this is the 61.8% r of aforesaid rise.

. In view of abv analysis, trading fm long side is recommended today n only below 1.5145 (y’day’s low) wud indicate aforesaid correction has ended
instead n risk weakness twd 1.5077 but 1.5034 shud hold on 1st testing.

DAILY GBP/USD TECHNICAL OUTLOOK
Last Update At 20 Jan 2015 00:25GMT

Trend Daily Chart
Down

Daily Indicators
Turning up

21 HR EMA

1.5127

55 HR EMA
1.5149

Trend Hourly Chart
Sideways

Hourly Indicators
Falling

13 HR RSI
31

14 HR DMI
-ve

Daily Analysis
Choppy consolidation to continue

Resistance
1.5235 - Last Fri’s high
1.5180 - Y’day’s high
1.5137 - Hourly sup (now res)

Support
1.5075 - Last Fri’s low
1.5034 - Jan 08 17-month low
1.5000- Psychological sup

. GBP/USD - 1.5085… Cable moved in a choppy fashion on Mon as despite a rebound fm Asian 1.5117 low to 1.5180 in European morning, price retreated to 1.5137 in N. America morning n then rebounded to 1.5174. Later, cross-selling in sterling pressured price lower to 1.5109 near Mon close.

. Looking at bigger picture, despite aforesaid decline to 1.5075 last Fri, subsequent rebound suggests volatile trading abv Jan’s 17-month trough wud continue but abv 1.5270 (reaction high) needed to bring stronger gain to 1.5328, this is 50% r of intermediate fall fm 1.5621. On the downside, below 1.5075 wud signal MT downtrend fm 2014 peak at 1.7192 (Jul) to correct the LT rise fm 1.3500 (2009 low in Jan) has resumed n price wud be en route to ‘psychological’ target at 1.5000, then 1.4910 (61.8% r of 1.3500-1.7192). Therefore, selling the pound on recovery in anticipation of test of 1.5000 is favoured n only a daily close abv 1.5328 signals temporary low is made, risks stronger retrace. to 1.5390/00.

. Today, as cable has remained under pressure in early Asian trading after penetrating o/n low at 1.5109, below 1.5075 wud bring re-test of 1.5034. Therefore, in view of said downside risk, we’ve exited long. Abv 1.5137, 1.5170/80.

DAILY GBP/USD TECHNICAL OUTLOOK
Last Update At 23 Jan 2015 00:40GMT

Trend Daily Chart
Down

Daily Indicators
Bullish convergences

21 HR EMA
1.5070

55 HR EMA
1.5107

Trend Hourly Chart
Down

Hourly Indicators
O/sold

13 HR RSI
28

14 HR DMI
-ve

Daily Analysis
Resumption of MT downtrend

Resistance
1.5123 - Y’day’s Asian low
1.5076 - Wed’s low
1.5034 - Prev. Jan’s low

Support
1.4973 - Y’day’s fresh 17-month low
1.4952 - 2.23 times extn of 1.5785-1.5486 fm 1.5621
1.4910- 61.8% r of 1.3500-1.7192

. GBP/USD - 1.5014… Despite cable’s rebound fm Asian low at 1.5076 to 1.5213 ahead of NY open, the British pound tumbled in tandem with intra-day sharp sell off in eur/usd after ECB unleashed massive bound buying programme. The pound nosed dived below Jan’s 1.5034 to a fresh 17-month trough of 1.4973.

. Looking at bigger picture, y’day’s firm breach of prev. bottom at 1.5034 confirms MT downtrend fm 2014 peak at 1.7192 (Jul) to correct the LT rise fm 1.3500 (2009 low in Jan) has resumed n price wud be en route to to 1.4910 (61.8% r of 1.3500-1.7192) soon, however, reckon 2013 bottom at 1.4814 wud hold. Today, as price is currently trading below both 21-hr n 55-hr emas, suggesting downside bias remains for further weakness to 1.4952, this is 2.236 times extension of 1.5785-1.5486 measured fm 1.5621, however, oversold readings on the hourly oscillators wud keep price abv 1.4910 n yield minor correction later.

. In view of abv analysis, selling the pound on intra-day recovery is the way to go but profit shud be taken on subsequent decline. On the upside, only a daily close abv 1.5034 wud indicate a temporary low is made n risk stronger retracement to 1.5076 but 1.5123 (prev. sup, now res) shud cap upside.

DAILY GBP/USD TECHNICAL OUTLOOK
Last Update At 28 Jan 2015 00:29GMT

Trend Daily Chart
Down

Daily Indicators
Bullish convergences

21 HR EMA
1.5157

55 HR EMA
1.5110

Trend Hourly Chart
Near term up

Hourly Indicators
Rising

13 HR RSI
59

14 HR DMI
+ve

Daily Analysis
Consolidation with upside bias

Resistance
1.5320 - Jan 05 high
1.5270 - Jan 14 high
1.5235 - Jan 16 high

Support
1.5117 - Y’day’s European morning high (now sup)
1.5060 - Y’day’s low
1.5045 - Mon’s European morning high (now sup)

. GBP/USD - 1.5174… Although cable moved sideways after marginal gain abv Mon’s NY high of 1.5103 to 1.5107 in Asia on Tue n then climbed to 1.5117 in European morning, price dipped to 1.5060 after release of downbeat U.K. GDP b4 b4 rallying in tandem with euro to as high as 1.5223 in NY morning b4 easing.

. Looking at the bigger picture, despite last Fri’s fall to a fresh 17-mth trough of 1.4952, y’day’s rally to 1.5223 confirms MT decline fm 2014 peak at 1.7192 (Jul) to correct the LT rise fm 1.3500 (2009 low in Jan) has finally made a temporary low there as aforesaid low was accompanied by ‘bullish convergences’ on hourly & daily oscillators, suggesting choppy consolidation with upside bias remains for further subsequent gain. A ‘natural’ 50% r of intermediate fall fm 1.5621 wud send cable higher twd 1.5286, this is just abv the daily chart res or upside chart obj. at 1.5270. Therefore, buying cable on dips in anticipation of such move is favoured but abv 1.5270 is needed to extend to 1.5320/30.

. Today, in view of abv analysis, buying cable on dips for further corrective up move twd 1.5270 is recommended. On the downside, nly below 1.5060 (Tue’s sup in Europe) wud abort near term bullish scenario n risk weakness twd 1.5088.

DAILY GBP/USD TECHNICAL OUTLOOK
Last Update At 30 Jan 2015 00:43GMT

Trend Daily Chart
Down

Daily Indicators
Bullish convergences

21 HR EMA
1.5094

55 HR EMA
1.5117

Trend Hourly Chart
Near term down

Hourly Indicators
Rising fm o/s

13 HR RSI
39

14 HR DMI
-ve

Daily Analysis
Consolidation with downside bias

Resistance
1.5223 - Tue’s high
1.5163 - Y’day’s high
1.5111 - Y’day’s European low, now res

Support
1.5018 - Y’day’s low
1.4952 - Last Fri’s 17-month
1.4910- 61.8% r of 1.3500-1.7192

. GBP/USD - 1.5074… Cable traded sideways in Asia Thur, despite staging a recovery to 1.5163 at European open, renewed selling emerged n knocked price to 1.5111. Intra-day decline accelerated in NY morning after 1.5111 sup was penetrated n cable tanked to as low as 1.5018 b4 staging a short-covering rebound.

. Looking at the hourly n daily charts, despite the pound’s rally fm last Fri’s fresh 17-mth trough of 1.4952 to 1.5223 Wed, subsequent sell off to 1.5018 y’day signals said correction has ended n consolidation with downside bias is seen for a re-test of said sup next week after consolidation. Looking ahead, a breach of 1.4952 wud confirms MT decline fm 2014 peak at 1.7192 (Jul) to correct the LT rise fm 1.3500 (2009 low in Jan) has resumed n further weakness to 1.4910 wud be seen, this is the 61.8% r of 1.3500-1.7192 wud follow, however, reckon 2013 bottom at 1.4814 wud hold. Failure to penetrate 1.4952 n subsequent rise back abv 1.5223 wud bring another leg of correction to upside chart objectives at 1.5270 n then 1.5320 (Jan 14 n Jan 5 highs respectively).

. Today, although intra-day rebound suggests initial consolidation is seen , selling on recovery for one more fall is favoured. Abv 1.5163 aborts, 1.5523.