DAILY GBP/USD TECHNICAL OUTLOOK
Last Update At 05 Feb 2015 01:04GMT
Trend Daily Chart
Down
Daily Indicators
Bullish convergences
21 HR EMA
1.5184
55 HR EMA
1.5147
Trend Hourly Chart
Near term up
Hourly Indicators
Bearish divergences
13 HR RSI
49
14 HR DMI
+ve
Daily Analysis
Consolidation with upside bias
Resistance
1.5320 - Jan 03 high
1.5270 - Jan 14 high
1.5251 - Y’day’s high
Support
1.5139 - Y’day’s low in Europe
1.5101 - Mon’s high, now sup
1.5083 - Hourly chart
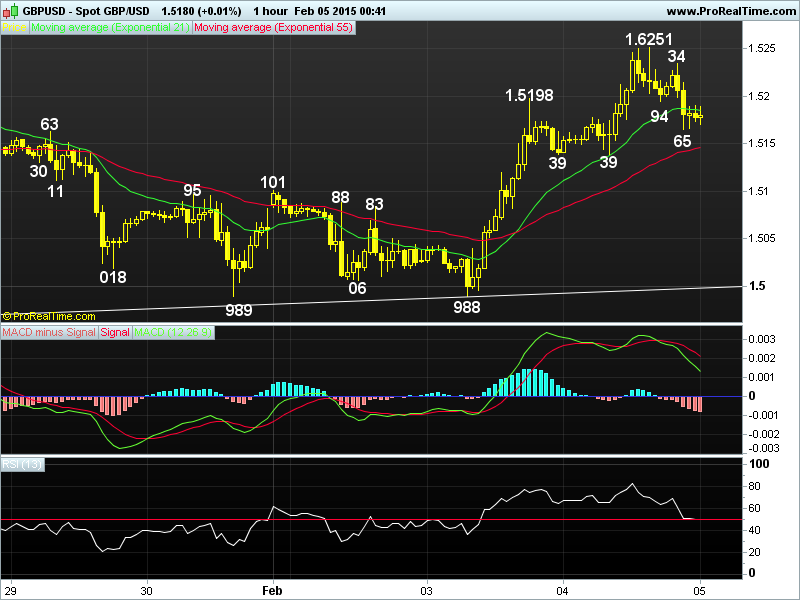
. GBP/USD - 1.5179… Although cable rallied in European morning after release of robust U.K. services PMI. Price met renewed buying at 1.5139 in Europe n jumped after the data n later ratcheted higher to a near 3-week high of 1.6251 in NY b4 retreating to 1.5165 due to selloff in euro in NY afternoon.
. Looking at the hourly n daily charts, cable’s breach of last Wed’s high of 1.5223 to a fresh near 3-week peak of 1.5251 y’day confirms MT downtrend fm 2014 peak at 1.7192 (Jul) has indeed made a temporary low at Jan’s 17-month trough at 1.4952, however, as price has faltered below chart res at 1.5270, subsequent retreat suggests consolidation with downside bias wud be seen, below 1.5139 wud signal correction has at least made a temporary top n yield weakness to 1.5066 (being ‘dynamic’ 61.8% r of 1.4952-1.6251). Therefore, selling cable on recovery for such a decline is favoured but a daily close below there needed to bring subsequent weakness twd 1.4952 next week. On the upside, only abv 1.6251 wud bring stronger correction to 1.5270 n possibly twd 1.6320.
. Today, selling cable on recovery is therefore favoured but profit shud be taken on subsequent fall as 1.5066 shud hold fm here.
DAILY GBP/USD TECHNICAL OUTLOOK
Last Update At 24 Feb 2015 00:28GMT
Trend Daily Chart
Down
Daily Indicators
Rising
21 HR EMA
1.5428
55 HR EMA
1.5412
Trend Hourly Chart
Up
Hourly Indicators
Rising
13 HR RSI
63
14 HR DMI
+ve
Daily Analysis
Resumption of upmove fm 1.4952
Resistance
1.5569 - 50% r of 1.6186-1.4952
1.5480 - Last Wed’s high
1.5475 - Y’day’s high
Support
1.5333 - Y’day’s low
1.5317 - Last Tue’s low
1.5278 - 38.2% r of 1.4952-1.5480
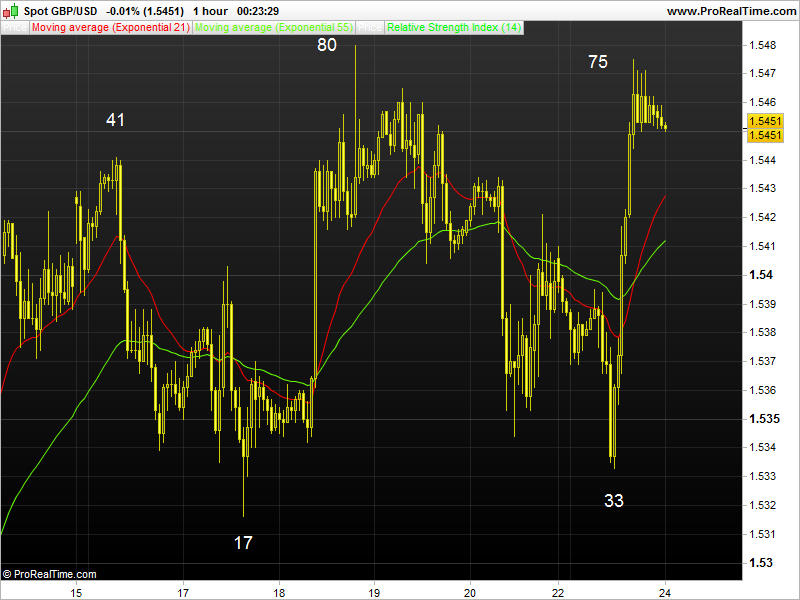
. GBP/USD - 1.5450 … Despite cable’s brief breach of last Fri’s 1.5343 low to 1.5333 in Europe on Mon, the British pound rallied on renewed cross buying in sterling (eur/gbp fell to a fresh 7-year trough at 0.7326) n cable strengthened to as high as 1.5475 (just below last Wed’s 1.5480 high).
. Looking at the hourly n daily charts, cable’s firmness after y’day’s rally fm 1.5333 to 1.5475 suggests the pullback fm last Wed’s high at 1.5480 has ended at 1.5333 n recent erratic upmove fm Jan’s fresh 17-month trough at 1.4952 shud resume after minor consolidation n abv said res wud confirm aforesaid upmove fm 1.4952 to retrace MT fall fm 1.7192 (2014 peak) has once again resumed n yield further gain to 1.5569 (50% r of 1.6186-1.4952) later. On the downside, only a breach of 1.5333 wud bring a stronger retracement to 1.5278 (38.2% r of 1.4952-1.5480), however, reckon 1.5216 (50% r) shud contain downside n yield a much-needed rebound later.
. In view of near term bullish scenario, buying cable on dips in anticipation of further gain to 1.5500 1st, however, high readings on hourly oscillators shud cap price at 1.5569 today. Below 1.5333 risks 1.5278.
DAILY GBP/USD TECHNICAL OUTLOOK
Last Update At 27/02/2015 00:36 GMT
Trend Daily Chart
Down
Daily Indicators
Rising
21 HR EMA
1.5448
55 HR EMA
1.5467
Trend Hourly Chart
Down
Hourly Indicators
Rising fm o/s
13 HR RSI
37
14 HR DMI
-ve
Daily Analysis
Consolidation with downside bias
Resistance
1.5554 - Y’day’s 8-week high
1.5517 - Y’day’s Euroepan morning low
1.5467 - Wed’s European low (now res)
Support
1.5395 - Y’day’s low
1.5376 - 50% r of 1.5197-1.5554
1.5333 - Mon’s low
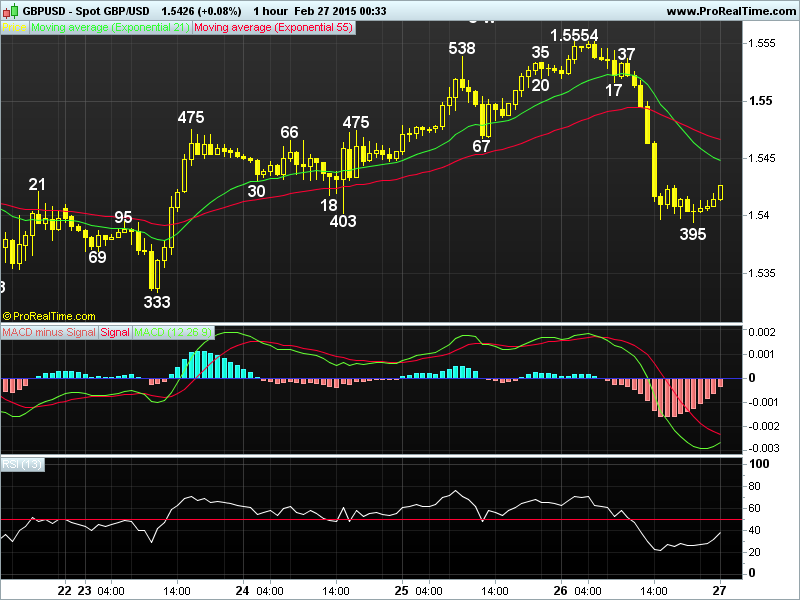
. GBP/USD - 1.5425 … Although cable continued its recent winning streaks on Thur n climbed briefly abv previous day’s 1.5538 top to a fresh 8-week peak of 1.5554 in Asia, price retreated to 1.5517 in European morning n later tumbled in NY session to as low as 1.5395 on hawkish Fed comments plus upbeat U.S. data.
. Y’day’s near term ‘reversal’ fm 1.5554 confirms recent erratic upmove fm Jan’s fresh 17-month bottom has made a temporary top there n consolidation with downside bias is seen in the coming days. A ‘minimum’ 38.2% of aforesaid upmove fm 1.4952 wud pressure the pound to 1.5324, this is just below this week’s low at 1.5333 (Mon), Looking ahead, a daily close below 1.5333 wud bode ill for sterling n price wud be en route twd 1.5233 (50% r fm 1.4952) n then twd chart obj. at 1.5197. Therefore, in view of abv bearish scenario, selling cable on recovery in anticipation of resumption of decline is recommended n only abv 1.5500/10 wud dampen bearishness, risk possible re-test of 1.5554.
. Today, although intra-day recovery at Asian open suggests initial consolidation is in store, reckon 1.5467 shud cap upside n yield another fall to 1.5376/80, however, reckon 1.5333 sup wud remain intact.
WEEKLY GBP/USD TECHNICAL OUTLOOK
Last Update At 08 Mar 2015 23:49GMT
Trend Daily Chart
Sideways
Daily Indicators
Falling
21 HR EMA
1.5110
55 HR EMA
1.5188
Trend Hourly Chart
Down
Hourly Indicators
Rising fm o/s
13 HR RSI
27
14 HR DMI
-ve
Daily Analysis
Resumption of recent decline
Resistance
1.5225 - Last Fri’s NY high
1.5162 - Last Fri’s European low (now res)
1.5117 - Minor hourly sup (now res)
Support
1.5025 - Intra-day low (NZ)
1.4988 - Feb 03 low
1.4952 - Jan 17-month low (23)
. GBP/USD - 1.5061 … Cable continued its recent losing streak in tandem with eur/usd last week n fell to 1.5215 on Thur, the pound then tumbled to a 1-month trough of 1.5032 after a surprise sharp jump U.S. payrolls on Fri.
. On the bigger picture, as mentioned previously, cable’s ‘reversal’ fm Feb’s 8-week peak at 1.5554 confirms recent erratic upmove fm Jan’s fresh 17-month bottom at 1.4952 has ended there n price is en route to re-test this sup lvl this week, a break there wud extend MT downtrend fm 2014 near 6-year peak at 1.7192 (Jul) to 1.4768, being 50% proj. of the MT intermediate fall fm 1.6525-1.4952 measured fm 1.5554. Having said that, as the daily technical indicators wud display prominent ‘bullish convergences’ on such move, reckon 1.4582 (61.8% proj.) wud remain intact this week n risk has increased for a correction to take place later this month. So whilst selling cable on recovery is favoured, profit shud be taken on decline. On the upside, only a daily close abv 1.5270 confirms temporary low is made n risks stronger retracement to 1.5393/98.
. Today, intra-day rebound fm 1.5025 (NZ) suggests initial choppy consolidation wud be seen in Asia b4 prospect of another decline later today.
DAILY GBP/USD TECHNICAL OUTLOOK
Last Update At 17 Mar 2015 00:27GMT
Trend Daily Chart
Down
Daily Indicators
Falling
21 HR EMA
1.4810
55 HR EMA
1.4826
Trend Hourly Chart
Sideways
Hourly Indicators
Rising
13 HR RSI
57
14 HR DMI
+ve
Daily Analysis
Consolidation with mild downside bias
Resistance
1.4952 - Jan 23 low (now res)
1.4902 - Hourly chart
1.4853 - Y’day’s high
Support
1.1799 - Y’day’s European morning high (now sup)
1.4770 - Y’day’s NY low
1.4730 - Y’day’s low (NZ)
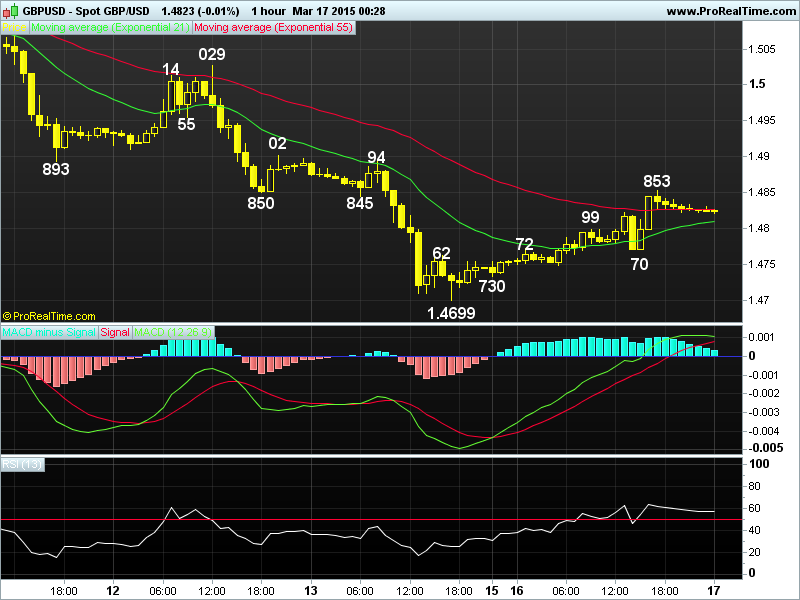
. GBP/USD - 1.4823… Although cable opened lower to 1.4730 in tandem with eur/usd in NZ on Mon, intra-day rally lifted the pound n price ratcheted higher to 1.4799 in Europe, then later to 1.4853 in NY afternoon b4 easing.
. Let’s look at bigger picture 1st, as mentioned in prev. update, the pound finally caught up with recent strg downtrend in eur/usd n penetrated Jan’s low at 1.4952, then 2013 bottom at 1.4814, suggesting LT fall fm 2014 near 6-year peak at 1.17192 has once again resumed n price is now en route to 1.4582 later this week, being 61.8% proj. of MT intermediate decline fm 1.5554, however, as daily technical indicators’ readings wud be in oversold territory on such move, reckon 1.4228 (2010 trough) wud hold this month n bring a much-needed correction. Therefore, selling cable in anticipation of further weakness is the way to go n only abv 1.4952 (previous low, now res) wud signal a temporary low is made.
. Today, although y’day’s strg rebound to 1.4853 confirms recent downtrend has indeed formed a minor bottom at 1.4699 n 1-2 days of consolidation is seen, intra-day retreat suggests nr term downside bias remains for weakness to 1.4770, however, reckon said Mon’s low at 1.4730 wud hold n yield another rebound.
WEEKLY GBP/USD TECHNICAL OUTLOOK
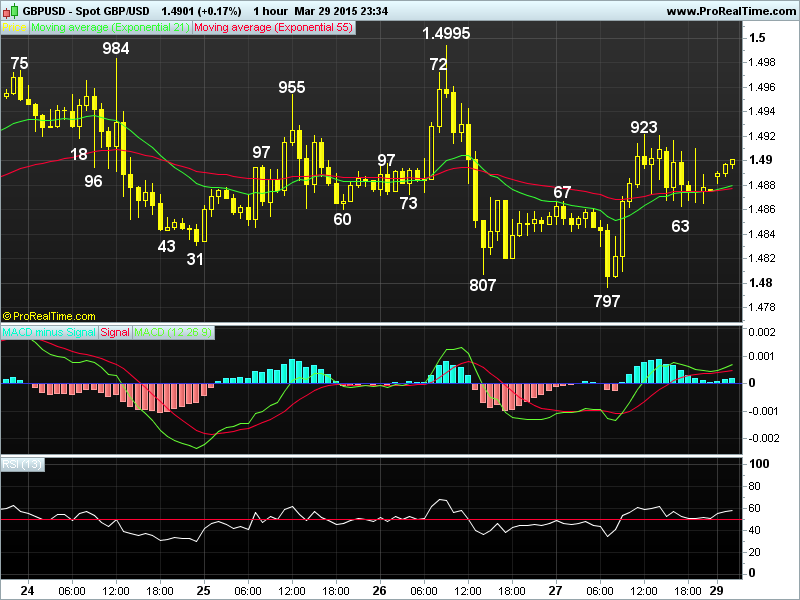
Last Update At 29 Mar 2015 23:35GMT
Trend Daily Chart
Sideways
Daily Indicators
Rising fm o/s
21 HR EMA
1.4880
55 HR EMA
1.4878
Trend Hourly Chart
Sideways
Hourly Indicators
Neutral
13 HR RSI
58
14 HR DMI
+ve
Daily Analysis
Consolidation with a neutral bias
Resistance
1.4995 - Last Thur’s high
1.4955 - Last Wed’s high
1.4923 - Last Fri’s high
Support
1.4831 - Last Wed’s low
1.4797 - Last Fri’s low
1.4777 - Last Fri’s Asian high (now sup)
. GBP/USD - 1.4901… Trading the pound proved me tricky last week as price went through several roller-coaster sessions.Cable ratcheted lower fm 1.4990 to 1.4839 in tandem with euro on Mon n rebounded to 1.4984 the next day n fell back to 1.4831 Wed b4 rising to 1.4995 Thur n then tumbled to 1.4797 Fri.
. On the bigger picture, although cable’s rally fm Mar’s 40-month trough of 1.4635 to 1.5166 (post-FOMC peak) confirms the LT fall fm 2014 near 6-year peak at 1.7192 has finally made a temporary low there, the sharp retreat to 1.4689 suggests choppy trading inside aforesaid 1.4635-1.5166 broad range wud continue for rest of this week. On the upside, abv 1.5166 wud bring stronger retracement to 1.5357, this is a ‘minimum’ 38.2% of intermediate fall fm 1.6525 to 1.4635. Failure to re-test 1.5166 res n subsequent breach of 1.4635 wud risk one more fall to 1.4598/1.4582 area (61.8% proj. of 1.5554-1.4635 n 61.8% proj. of 1.6525-1.4952 fm 1.5554 respectively), however, as hourly & the daily indicators wud display ‘bullish convergences’ on such move, 1.4500 wud hold.
. Today, Fri’s rebound fm 1.4797 to 1.4923 after hawkish comments by BoE’s Gov Carney suggests consolidation with upside bias is in store.
DAILY GBP/USD TECHNICAL OUTLOOK
Last Update At 08 Apr 2015 01:04GMT
Trend Daily Chart
Sideways
Daily Indicators
Turning up
21 HR EMA
1.4850
55 HR EMA
1.4872
Trend Hourly Chart
Near term down
Hourly Indicators
Rising fm o/s
13 HR RSI
38
14 HR DMI
-ve
Daily Analysis
Consolidation with downside bias
Resistance
1.4981 - Mon’s high
1.4920 - Y’day’s high
1.4871 - Mon’s low
Support
1.4803 - Y’day’s low
1.4775 - Last Thur’s low
1.4740 - Last Wed’s low
. GBP/USD - 1.4826… Although the British pound traded with a firm bias in Asia y’day n rose to session high at 1.4920 at European open, price tumbled in tandem with euro to 1.4830. However, cable staged a shortcovering rebound to 1.4912 in NY morning b4 tumbling to session lows of 1.4803.
. Mon’s retreat fm 1.4981 signals choppy trading below last week’s top at 1.4995 wud continue n looking at the bigger picture 1st, although early rally fm Mar’s 40-month trough of 1.4635 to 1.5166 (post-FOMC peak) confirms the LT fall fm 2014 near 6-year peak at 1.7192 has made a temp. low there, the sharp retreat to 1.4689 n subsequent 2-week long choppy trading inside aforesaid 1.4635-1.5166 broad range suggests consolidation with downside wud continue this week. Having said that, as long as last Tue’s low at 1.4740 shud hold, prospect of another rebound remains. On the upside, abv 1.4981 wud revive bullishness for another rise twd 1.4990 (23 Mar high), then 1.5045/55.
. Today, as current price is trading below the 21-hr & 55-hr emas, selling cable on intra-day recovery is recommended but reckon 1.4775 sup wud hold. Abv 1.1912/20 res area anytime aborts bearish view n risks gain twd 1.4981.
DAILY GBP/USD TECHNICAL OUTLOOK
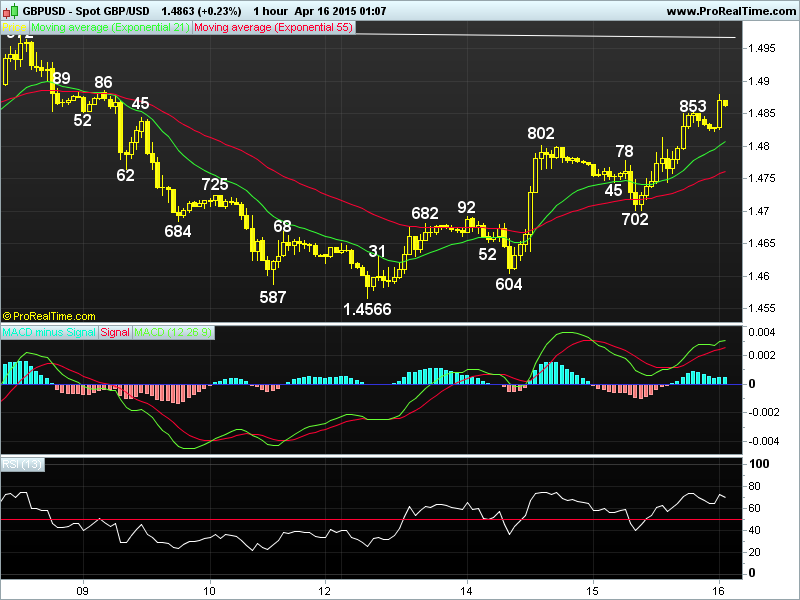
Last Update At 16 Apr 2015 01:17GMT
Trend Daily Chart
Down
Daily Indicators
Bullish convergences
21 HR EMA
1.4807
55 HR EMA
1.4762
Trend Hourly Chart
Near term up
Hourly Indicators
Rising
13 HR RSI
69
14 HR DMI
+ve
Daily Analysis
Consolidation with upside bias
Resistance
1.4981 - Apr’s high (06)
1.4943 - 38.2% r of 1.5554-1.4566
1.4886 - Last Thur’s high
Support
1.4802 - Tue’s high (now sup)
1.4745 - Hourly chart
1.4701 - Y’day’s low
. GBP/USD - 1.4864… Although the British pound retreated fm Tue’s NY high at 1.4802 to 1.4701 in European morning on Wed in tandem with euro’s weakness. Cable rose to 1.4814 on weak U.S. data in NY n then retreated to 1.4745 b4 rallying to session highs of 1.4853 near NY close b4 easing to 1.4825 in Australia.
. On the daily picture, cable’s rebound fm Mon’s near 5-year trough of 1.4666 n then y’day’s rally to 1.4853 confirms a temp. low is in place as aforesaid low was accompanied by ‘bullish convergences’ on the hourly indicators n as long as 1.4701 (y’day’s low) holds, upside bias remains for gain twd 1.4943, this is a ‘minimum’ 38.2% r of intermediate fall fm 1.5554-1.4566, however, reckon prev. res at 1.5009 wud cap upside n yield decline later next week. On the downside, a daily close below 1.4702 wud be the 1st signal aforesaid correction has ended, then re-test of 1.4566 wud be seen, then twd 1.4500.
. Today, cable has penetrated y’day’s 1.4853 high at 1.4853 after meeting renewed buying at 1.4825 n as current price is trading abv 21-hr & 55-hr emas, buying the pound on dips is favoured n only below 1.4743/45 sup wud signal temp. top is made, risk stronger retracement twd 1.4701.
WEEKLY GBP/USD TECHNICAL OUTLOOK
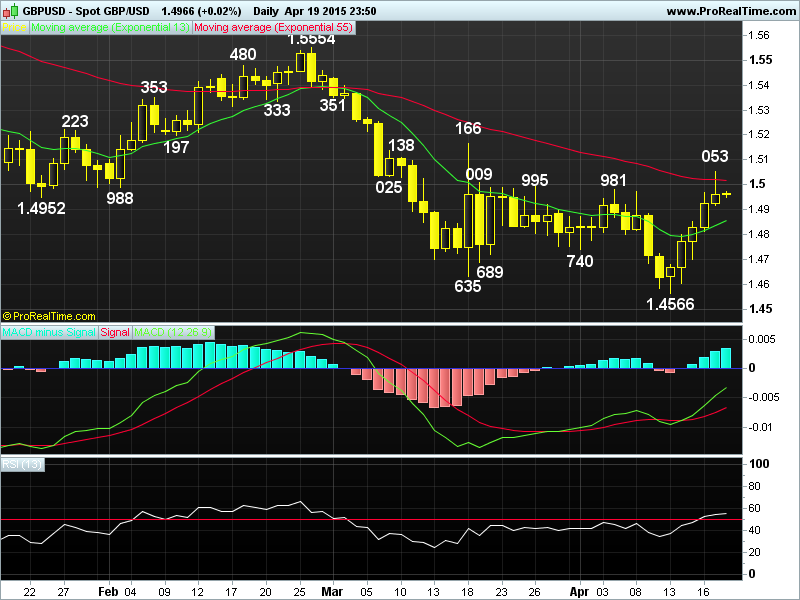
Last Update At 19 Apr 2015 23:52GMT
Trend Daily Chart
Sideways
Daily Indicators
Turning up
21 HR EMA
1.4960
55 HR EMA
1.4915
Trend Hourly Chart
Near term up
Hourly Indicators
Turning down
13 HR RSI
53
14 HR DMI
+ve
Daily Analysis
Consolidation with upside bias
Resistance
1.5097 - 50% proj. of 1.4701-1.5053 fm 1.4921
1.5053 - Last Fri’s high
1.5008 - Mar 19 high
Support
1.4916 - Last Fri’s low
1.4880- Last Thur’s Asian high (now sup)
1.4812 - Last Thur;s low
. GBP/USD - 1.4967… Although cable resumed MT downtrend to a near 5-year low of 1.4566 at the start of last week as market jitter of a hung parliament after May 7 U.K. election weighed on the sterling. Cable rallied in tandem with eur/usd n climbed for 5 consecutive days to 1.5053 in Europe Fri b4 retreating.
. On the daily chart, cable’s aforesaid surprise rally fm 1.4566 to as high as 1.5053 confirms downtrend fm 2014 near 6-year peak at 1.7192 has indeed formed a temporary low there as this lvl was accompanied by ‘bullish convergences’ on both hourly & daily indicators n consolidation with upside bias is in store this week. A daily close abv 1.5166 wud retain bullish prospect for further headway to 1.5314 n possibly twd 1.5545, being a ‘minimum’ 38.2% r n 50% r respectively of intermediate decline fm 1.6525-1.4566. In view of abv analysis, buying cable on dips is recommended in anticipation of subsequent resumption of near upmove to 1.5166. On the downside, below 1.4802 wud signal 1st leg of correction is over n may risk stronger retracement twd 1.4701 b4 rebound.
. Today, Fri’s retreat fm 1.5053 suggests consolidation is in store, reckon 1.4880/84 wud contain weakness n abv 1.5083 wud yield upmove to 1.5090/00.
DAILY GBP/USD TECHNICAL OUTLOOK
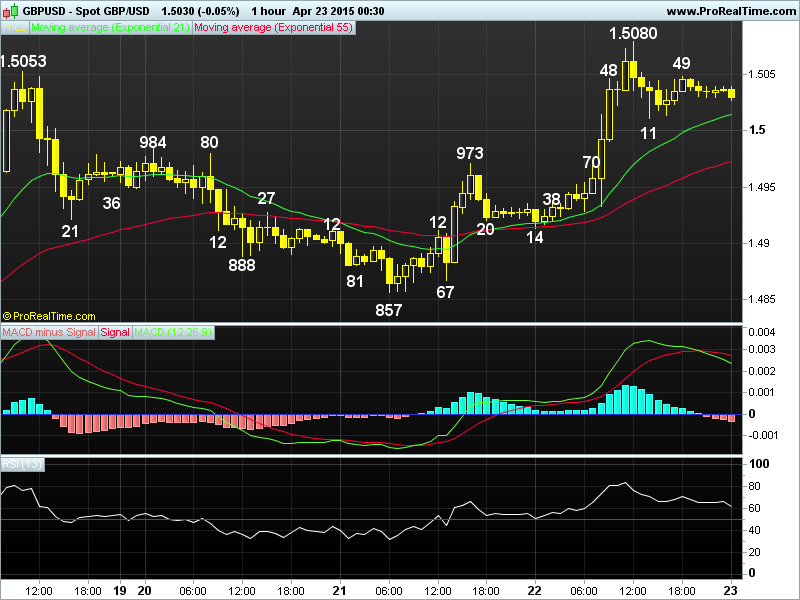
Last Update At 23/04/2015 00:32 GMT
Trend Daily Chart
Sideways
Daily Indicators
Turning up
21 HR EMA
1.5014
55 HR EMA
1.4973
Trend Hourly Chart
Up
Hourly Indicators
Turning down
13 HR RSI
61
14 HR DMI
+ve
Daily Analysis
Consolidation b4 marginal rise
Resistance
1.5166 - Mar 18 high
1.5101 - 50% proj. of 1.4566-1.5053 fm 1.4857
1.5080 - Y’day’s high
Support
1.5011 - Reaction low fm 1.5080
1.4973 - Tue’s high, now sup
1.4914 - Y’day’s low
. GBP/USD - 1.5030… Cable found renewed buying interest at 1.4914 in Asia y’day n jumped to 1.5047 in Europe after release of upbeat MPC minutes. Sterling later rallied to session high of 1.5080 at NY open b4 retreating to 1.5011.
. Looking at the bigger picture 1st, cable’s rally fm last Mon’s near 5- year trough of 1.4566 to as high as 1.5080 y’day confirms downtrend fm 2014 near 6-year peak at 1.7192 has indeed made a low there as this lvl was accompanied by ‘bullish convergences’ on both hourly & daily indicators n consolidation with upside bias remains. A daily close abv 1.5166 wud retain bullish prospect for further headway to 1.5314 n possibly twd 1.5545, being a ‘minimum’ 38.2% r n 50% r respectively of intermediate decline fm 1.6525-1.4566 next month. Wed’s cross-inspired rally abv last Fri’s low of 1.5053 to 1.5080 signals aforesaid upmove fm 1.4566 has resumed n despite subsequent retreat to 1.5011, as long 1.4973(prev. res, now sup) holds, outlook remains bullish for gain twd 1.5166. A daily close below 1.4973 signals 1st leg of correction over n risk retrace. to 1.4857.
. Today, as current price is trading abv the 21-hr & 55-hr emas, buying cable again on dips is the way to go but abv 1.5080 needed to yield 1.5100/10.
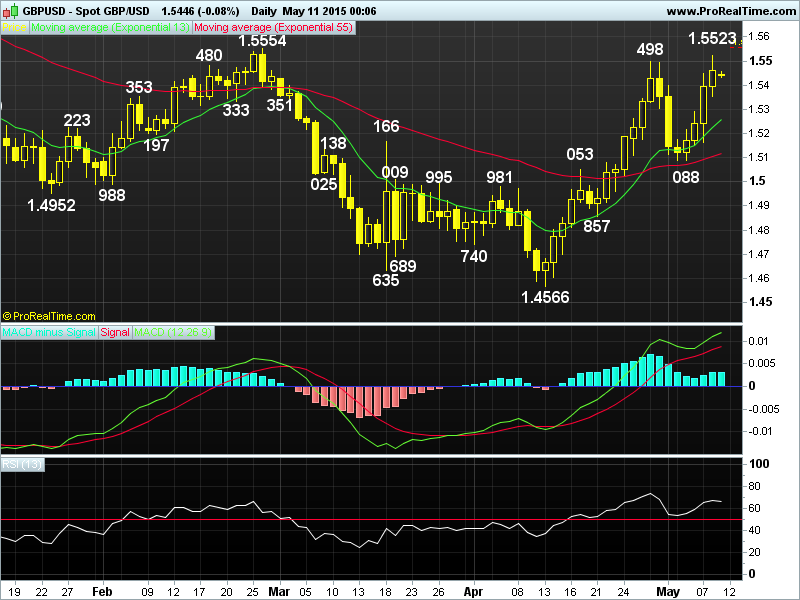
WEEKLY GBP/USD TECHNICAL OUTLOOK
Last Update At 11 May 2015 00:07GMT
Trend Daily Chart
Sideways
Daily Indicators
Rising
21 HR EMA
1.5433
55 HR EMA
1.5366
Trend Hourly Chart
Up
Hourly Indicators
Turning down
13 HR RSI
56
14 HR DMI
+ve
Daily Analysis
Consolidation with a neutral bias
Resistance
1.5554 - Feb 2015 peak (26th)
1.5523 - Last Fri’s 10-week high
1.5498 - Apr’s high (29th)
Support
1.5355 - Last Fri’s low
1.5292 - Wed’s high (now sup)
1.5240 - Last Fri’s low (AUS)
. GBP/USD - 1.5445…. The British pound made spectacular gain vs its peers last week. Price met renewed buying at 1.5088 on Tue n ratcheted higher to 1.5292 Wed. News of a strong Conservative lead fm exit poll at Thur’s NY close triggered a ‘relief rally’ fm 1.5240 to as high as 1.5523 on Fri b4 retreating.
. Looking at the daily chart, cable’s rally abv Apr’s 1.5498 high last Fri to a 2-month peak of 1.5523 confirms MT rise fm Apr’s near 5-year trough at 1.4566 has once again resumed n price is en route to 2015 peak at 1.5554 (Feb). As the daily technical indicators are rising, a daily close abv said 1.5544 res wud encourage for further headway twd 1.5664, being a 61.8% proj. of the entire rise fm 1.4566-1.5498 measured fm 1.5088. Therefore, buying cable on dips is favoured n only a daily close below 1.5292 (previous res, now sup) wud be the 1st signal temporary top is in place n risk would shift to the downside for weakness twd 1.5165 but reckon sup at 1.5088 should remain intact.
. Today, although cable has risen again in Fri’s post-NFP session in NY after intra-day strg retreat fm 1.5523 to 1.5355, abv said res needed to ring re-test of 1.5523, bearish divergences shud cap price below res at 1.5621.
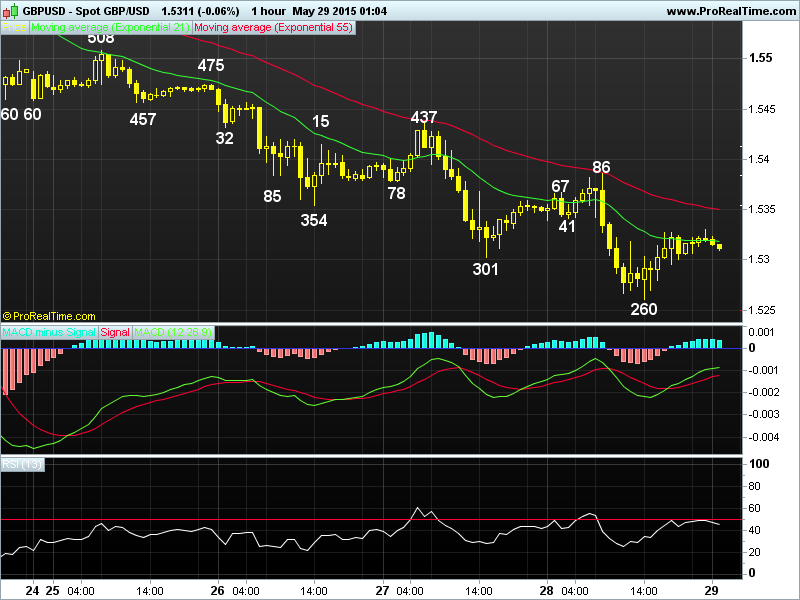
DAILY GBP/USD TECHNICAL OUTLOOK
Last Update At 29 May 2015 01:10GMT
Trend Daily Chart
Sideways
Daily Indicators
Turning down
21 HR EMA
1.5350
55 HR EMA
1.5319
Trend Hourly Chart
Down
Hourly Indicators
Bullish convergences
13 HR RSI
46
14 HR DMI
-ve
Daily Analysis
Consolidation b4 marginal fall
Resistance
1.5475 - Tue’s high
1.5437 - Wed’s high
1.5386 - Y’day’s high
Support
1.5260 - Y’day’s low
1.5240 - May 07 hourly sup
1.5191 - 50% r of 1.4566-1.5815
. GBP/USD - 1.5311… Despite staging a brief bounce to 1.5386 in European morning on Thur, the British pound tumbled after the release of weaker-than-expected UK GDP data (2nd reading) n weakened to as low as 1.5260 in NY morning b4 rebounding to 1.5327 in tandem with eur/usd near NY close on short-covering.
. On the daily chart, although cable’s rally abv Apr’s 1.5498 peak at 1.5498 to as high as 1.5815 in May confirms MT downtrend fm 2014 peak at 1.7192 has indeed formed a temporary low at 1.4566, last week’s sharp retreat to 1.5445 signals aforesaid upmove has formed a top there. Y’day’s selloff to 1.5260 adds credence to this view n looking ahead, the 3-legged decline fm 1.5815 indicates aforesaid correction fm 1.4566 has ended n cable is en route to 1.5191, then twd 1.5043 next week, being 50% r & 61.8% r respectively of the entire of said rise fm 1.4566. Therefore, selling the pound on recovery in anticipation of further weakness to abovementioned targets is favoured. Only abv 1.5437 (Wed’s high wud signal a temporary bottom is made n risk gain twd 1.5508 (Mon’s high).
. Today, although y’day’s rebound fm 1.5260 suggests consolidation wud be seen initially, reckon 1.5386 res wud cap upside n may yield one more fall.
DAILY GBP/USD TECHNICAL OUTLOOK
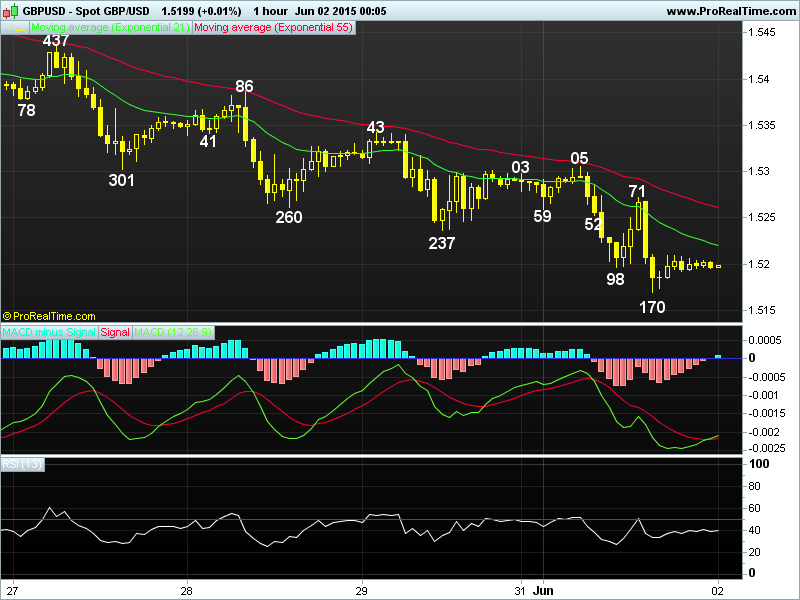
Last Update At 02 Jun 2015 00:11GMT
Trend Daily Chart
Sideways
Daily Indicators
Turning down
21 HR EMA
1.5221
55 HR EMA
1.5261
Trend Hourly Chart
Down
Hourly Indicators
Rising fm o/s
13 HR RSI
40
14 HR DMI
-ve
Daily Analysis
Consolidation b4 further fall
Resistance
1.5386 - May 28 high
1.5343 - Last Fri’s high
1.5272 - Y’day’s hourly res
Support
1.5170 - Y’day’s low
1.5165 - May 07 low
1.5088 - May 05 low
. GBP/USD - 1.5200.. Despite staging a brief bounce fm Asian low at 1.5259 to 1.5305 on Mon, the pound tumbled in Europe after release of downbeat U.K. mfg PMI. Cable dropped to 1.5197/98 b4 staging a short-covering rebound to 1.5272 but only to fall again to session lows of 1.5171 after upbeat U.S. mfg ISM.
. On the bigger picture, although cable’s rally abv Apr’s 1.5498 peak at 1.5498 to as high as 1.5815 in May confirms MT downtrend fm 2014 peak at 1.7192 has formed a temporary low at 1.4566, subsequent retreat n y’day’s selloff to 1.5170 strongly suggests aforesaid corrective rise fm 1.4566 has ended n the 3-legged decline fm 1.5815 is en route to 1.5043 (being 61.8% r of the entire said rise fm 1.4566) later this week. Therefore, selling the pound on recovery in anticipation of further weakness to abovementioned target is favoured. Only abv y’day’s high at 1.5305 wud violate recent series of lower highs n lower lows, then risk is seen for stronger rebound to 1.5343 n 1.5386 but last Wed’s high at 1.5437 shud cap upside.
. Today, as current price is trading below the 21-hr n 55-hr emas, selling cable on recovery is recommended. Only abv 1.5305 signals low, 1.5343 n 1.5386.
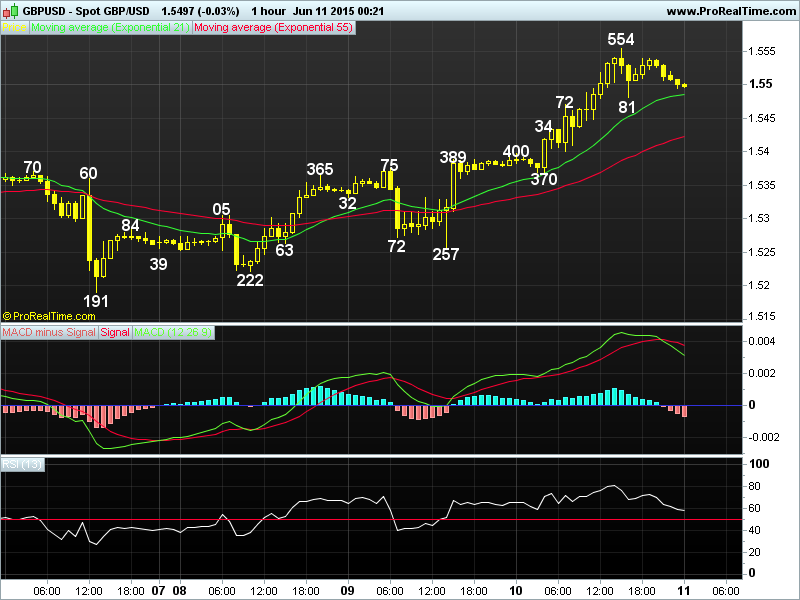
DAILY GBP/USD TECHNICAL OUTLOOK
Last Update At 11 Jun 2015 00:22GMT
Trend Daily Chart
Sideways
Daily Indicators
Neutral
21 HR EMA
1.5485
55 HR EMA
1.5422
Trend Hourly Chart
Up
Hourly Indicators
Easing fm o/bot
13 HR RSI
57
14 HR DMI
+ve
Daily Analysis
Consolidation b4 marginal rise
Resistance
1.5645 - May 21 sup, now res
1.5569 - 61.8% r of 1.5815-1.5170
1.5554 - Y’day’s high
Support
1.5481 - Y’day’s hourly sup
1.5441 - Last Thur’s high
1.5370 - Y’day’s low
. GBP/USD - 1.5497 … The British pound was the star performance vs its European peers y’day. Cable found renewed buying 1.5370 n then ratcheted higher due to active cross buying in sterling (eur/gbp tumbled fm 0.7365 to 0.7266). Price rallied to as high as 1.5554 in NY b4 retreating briefly to 1.5481.
. Let’s look at the bigger picture 1st, cable’s selloff fm May’s 1.5815 peak to 1.5170 last Mon confirms early strong upmove fm Apr’s near 5-year trough
at 1.4566 has made a top there, however, subsequent rally abv 1.5441 res (last Thur’s high, now sup) to 1.5554 signals an upside break of 1.5170-1.5441 broad range has occured n suggests aforesaid fall has ended at 1.5170, further headway to 1.5569 (being 61.8% r of decline fm 1.5815-1.5170) n then 1.5629 (1.618 times extension of 1.5170-1.5441 measured fm 1.5191) wud be seen. On the downside, only a daily close below 1.5441 (last Thur’s high, now sup) wud signal the said upmove fm 1.5170 has formed a temporary top n risk wud shift to downside for a pullback to 1.5370 (y’day’s low).
. Today, as current price is trading well abv the 21-hr & 55-hr emas, suggesting buying cable on dips is favoured n only below 1.5441 risks 1.5400.
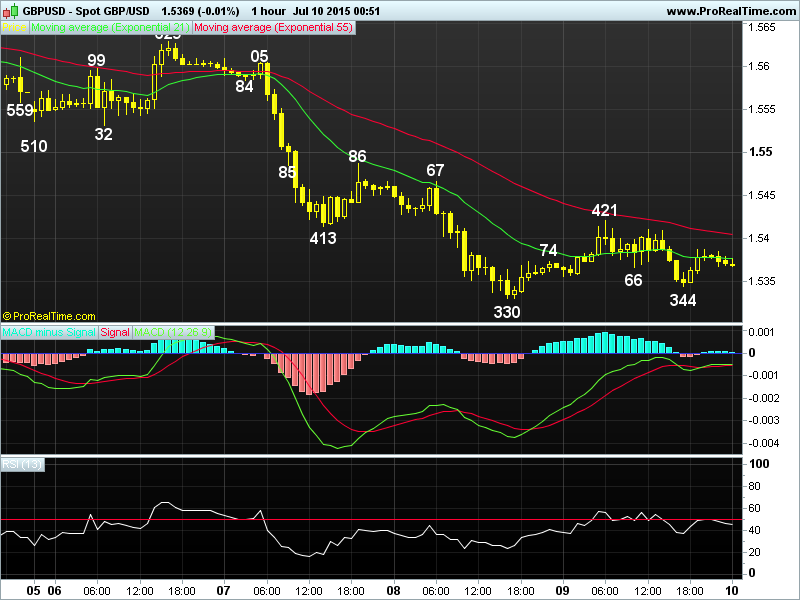
DAILY GBP/USD TECHNICAL OUTLOOK
Last Update At 10 Jul 2015 00:56GMT
Trend Daily Chart
Sideways
Daily Indicators
Falling
21 HR EMA
1.5376
55 HR EMA
1.5405
Trend Hourly Chart
Sideways
Hourly Indicators
Turning up
13 HR RSI
44
14 HR DMI
-ve
Daily Analysis
Consolidation b4 one more fall
Resistance
1.5510 - Jul 5 low, now res
1.5467 - Wed’s high
1.5421 - Y’day’s high
Support
1.5330 - Wed’s low
1.5305 - Jun 08 high, now sup
1.5257 - Jun 09 low
. GBP/USD - 1.5368… Cable tracked euro’s moves closely on Thur. Despite staging a brief bounce to 1.5421 at European open, price ratcheted lower n later dropped to 1.5344 in NY b4 staging a minor recovery.
. Looking at the bigger picture, as mentioned in previous updates, this week’s selloff due partly to active selling of sterling vs eur & yen confirms MT rise fm Apr’s near 5-year trough at 1.4566 has indeed formed a top at 1.5930 in Jun as this high was accompanied by prominent ‘bearish divergences’ on the daily technical indicators. As cable has already reached our indicated ‘minimum’ 38.2% retrace. obj. at 1.5409 on Wed, price is en route to 1.5248 n later twd 1.5087, being 50% n 61.8% r respectively of the aforesaid rise fm 1.4566. Therefore, selling the pound on recovery in anticipation of decline to indicated targets is recommended. On the upside, only a daily close abv 1.5510 (mon’s low, now res) wud be the 1st signal temporary low is made n risk gain twd 1.5629 b4 down.
. Today, as long as y’day’s 1.5421 high holds, outlook remains mildly bearish for recent decline to extend marginal weakness, however, as hourly indicators wud displayed ‘bullish convergences’ on next fall, 1.5272 shud hold.
DAILY GBP/USD TECHNICAL OUTLOOK
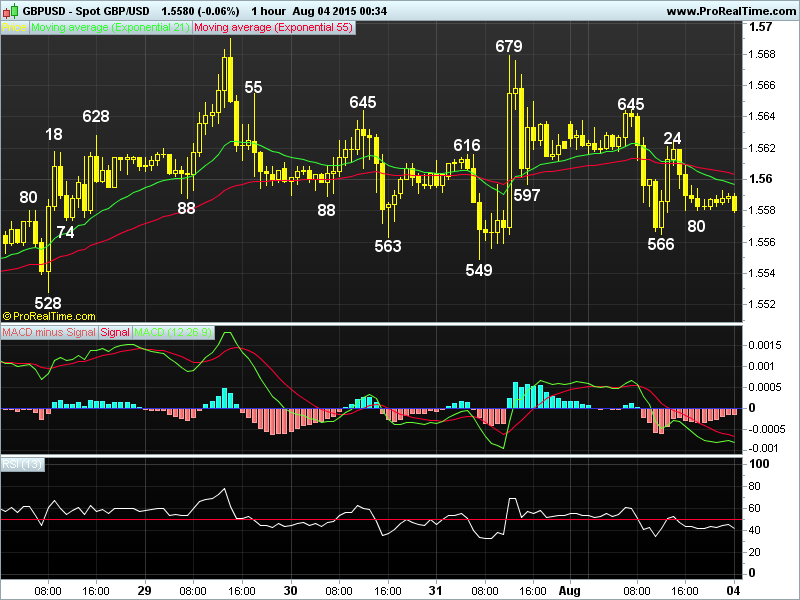
Last Update At 04 Aug 2015 00:39GMT
Trend Daily Chart
Sideways
Daily Indicators
Neutral
21 HR EMA
1.5596
55 HR EMA
1.5603
Trend Hourly Chart
Sideways
Hourly Indicators
Falling
13 HR RSI
39
14 HR DMI
-ve
Daily Analysis
Choppy consolidation to continue
Resistance
1.5691 - Wed’s high
1.5679 - Last Fri’s high
1.5645 - Y’day’s high
Support
1.5549 - Last Fri’s low
1.5528 - Last Tue’s low
1.5490 - Last Mon’s low
. GBP/USD - 1.5580… Cable went through a roller-coaster session y’day following Fri’s strg bounce fm 1.5549 to 1.5679. Despite staging a recovery to 1.5645 in Europe, price fell to 1.566 b4 rebounding to 1.5624 in NY morning.
. On the bigger picture, despite cable’s erratic rise fm 2015 near-5 year bottom at 1.4566 to 1.5930 in Jun, subsequent retreat to 1.5330 last month signals a temporary high has been made. Having said that, the pound’s strg rebound to 1.5676, then 1.5691 last week suggests ‘choppy’ sideways move is in store n gain to 1.5701 (61.8% r of 1.5930-1.5330) can’t be ruled out, as long as pivotal res at 1.5789 holds, downside bias remains for another fall. A daily close below 1.5467 indicates recovery fm 1.5330 is over n re-test of this level would follow but break there needed to turn outlook bearish for resumption of aforesaid decline fm 1.5930 to 1.5170 in late Aug. Abv 1.5789 any time aborts this bearish scenario on cable n risks gain twd 1.5930.
. Today, although y’day’s intra-day gyrations inside indicated Fri’s 1.5549-1.5679 range suggests choppy sideways trading would continue, below 1.5549 would bring stronger retracement of early rise fm 1.5330 to 1.5490/00 later.
DAILY GBP/USD TECHNICAL OUTLOOK
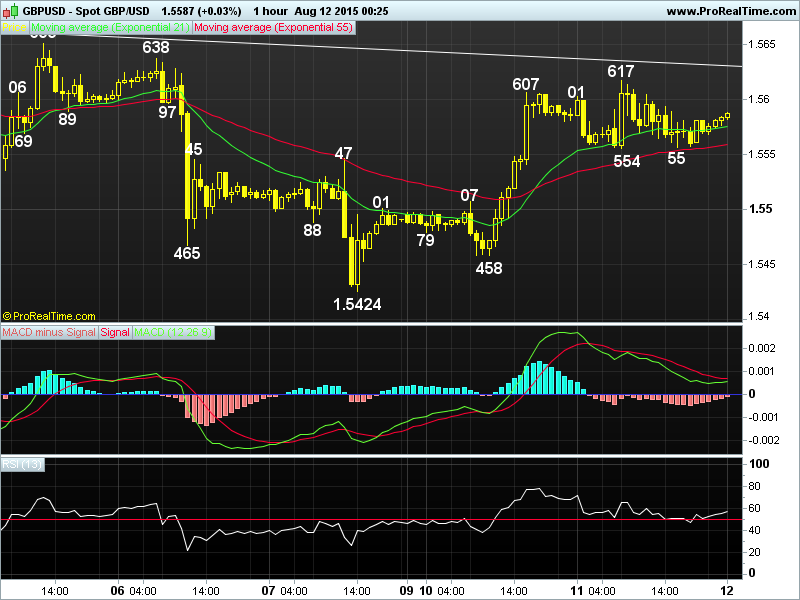
Last Update At 12 Aug 2015 00:27GMT
Trend Daily Chart
Sideways
Daily Indicators
Neutral
21 HR EMA
1.5575
55 HR EMA
1.5559
Trend Hourly Chart
Near term up
Hourly Indicators
Bearish divergences
13 HR RSI
57
14 HR DMI
+ve
Daily Analysis
One more rise b4 retreat
Resistance
1.5691 - Jul’s 29 high
1.5653 - Last Wed’s high
1.5617 - Y’day’s high
Support
1.5554 - Y’day’s low
1.5507 - Y’day’s European high (now sup)
1.5458 - Y’day’s low
. GBP/USD - 1.5588… Despite cable’s retreat fm 1.5602 to 1.5559 in Asia after China’s devaluation of yuan n then marginally lower to 1.5554 in Europe, price jumped abv Mon’s 1.5607 high to 1.5617 b4 retreating to 1.5555 in NY.
. On the daily picture, despite extending early erratic rise fm 1.5330 low to 1.5691 in Jul, subsequent retreat n a brief selloff to 1.5465 on BoE’s Super Thur, then the weakness to 1.5424 in NY Fri suggests aforesaid upmove has made a top there. However, Mon’s surprise rally to 1.5607 n then to 1.5617 Tue suggests further choppy sideways trading is in store. A daily close abv last wk’s 1.5653 high would signal correction fm 1.5691 has ended at 1.5424, then price would retest 1.5691 where a break there would extend aforesaid erratic rise fm 1.5330 to retrace cable’s early fall fm 2015 peak at 1.5930 (Jun) to 1.5701, then 1.5754, being 61.8% r n 70.7% r respectively of 1.5930-1.5330. On the downside, below 1.5424 confirms top is made n yields re-test of 1.5330 later this month.
. Today, as long as 1.5554 holds, said nr term rise fm 1.5424 may extend gain to 1.5638, as hourly indicators would display ‘bearish divergences’ on such move, res 1.5653 should hold. Below 1.5547/54 would yield 1.5520 b4 rebound.
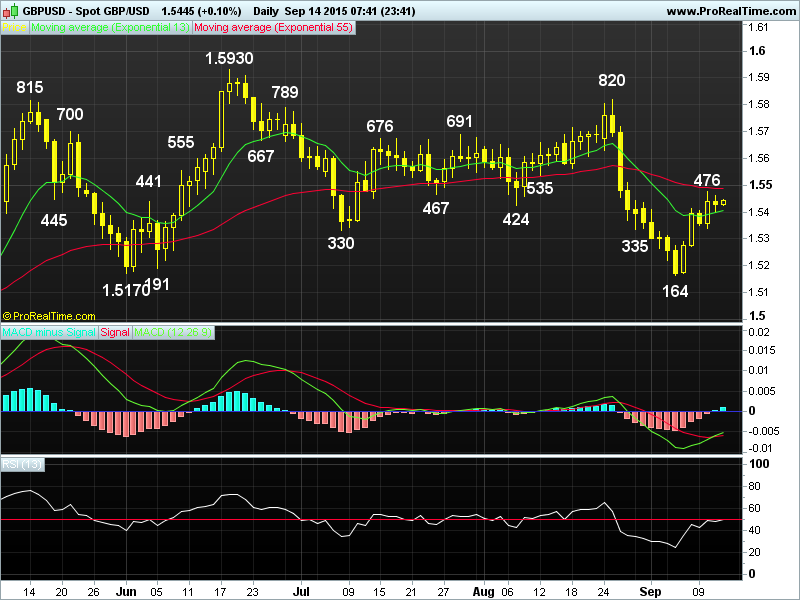
WEEKLY GBP/USD TECHNICAL OUTLOOK
Last Update At 13 Sep 2015 23:38GMT
Trend Daily Chart
Sideways
Daily Indicators
Turning up
21 HR EMA
1.5431
55 HR EMA
1.5414
Trend Hourly Chart
Sideways
Hourly Indicators
Neutral
13 HR RSI
59
14 HR DMI
+ve
Daily Analysis
Consolidation with upside bias
Resistance
1.5547 - 50% r of 1.5930-1.5164
1.5509 - Aug 27 Asian high
1.5476 - Last Thur’s high
Support
1.5400 - Last Fri’s low
1.5377 - Last Thur’s European midday low
1.5339 - Last Thur’s low
. GBP/USD - 1.5445… Despite cable’s weakness in early Sep, the pound met renewed buying abv previous week’s 1.5164 low last Mon n climbed to 1.5413 Tue, then 1.5476 after MPC minutes on Thur b4 retreating to 1.5400 in NY Fri.
. Looking at the bigger picture 1st, cable’s rally fm Sep’s 1.5164 trough to as high as 1.5476 last week confirms decline fm Jun’s 7-month peak at 1.5930 has made a low there n consolidation with upside bias remains for further headway to twd 1.5547, this is a ‘natural’ 50% r of 1.5930-1.5164. Having said that, as hourly oscillators’ readings would display prominent ‘bearish divergences’ on such rise, reckon ‘dynamic’ res at 1.5637 (61.8% r) would cap upside n may yield another decline later this month. So buying the pound on dips is favoured n only a daily below 1.5339 would be the 1st signal top is in place n risk weakness twd 1.5283 (61.8% r of 1.5164-1.5476).
. Today, as Sun’s hawkish remarks by another MPC member has kept price firm ahead of Asian open, intra-day upside bias is retained. We’re holding a long position for resumption of recent upmove twd 1.5509 res later n only firm break of 1.5400 may risk stronger retrace. to 1.5350/60 later.
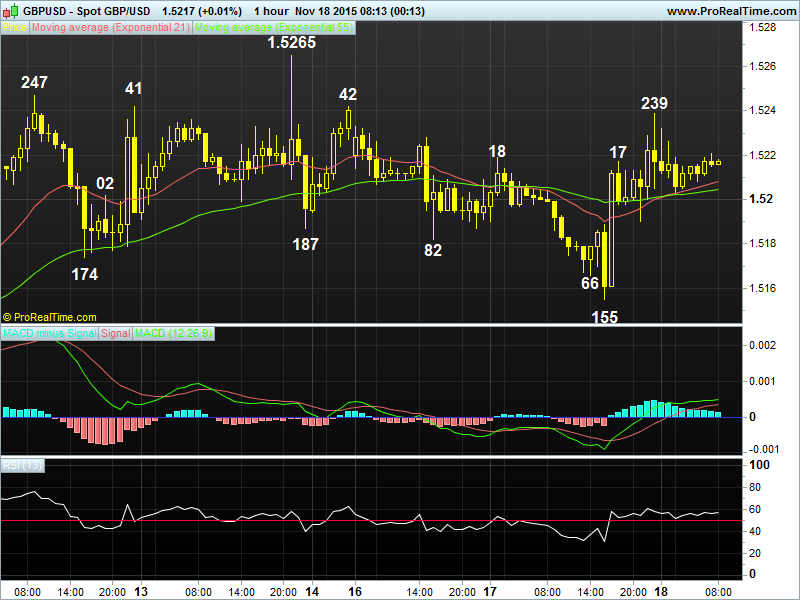
 DAILY GBP/USD TECHNICAL OUTLOOK
Last Update At 18 Nov 2015 00:17GMT
Trend Daily Chart
Down
Daily Indicators
Bullish convergences
21 HR EMA
1.5208
55 HR EMA
1.5205
Trend Hourly Chart
Sideways
Hourly Indicators
Rising
13 HR RSI
56
14 HR DMI
+ve
Daily Analysis
One more rise b4 strg retreat
Resistance
1.5302 - 61.8% proj. of 1.5027-1.5265 fm 1.5155
1.5265 - Last Fri’s high
1.5247 - Last Thur’s high
Support
1.5182 - Mon’s low
1.5155 - Y’day’s low
1.5133 - Last Wed’s European low
. GBP/USD - 1.5217… The British pound fell in tandem with euro to session lows of 1.5155 in European morning on Tue b4 rebounding to 1.5217 after inline UK inflation data, price later climbed to 1.5239 n NY b4 retreating.
. On the bigger picture, although cable’s break of Sep/Oct’s low at 1.5107 to 1.5027 in the 1st week of Nov signals correction fm 2015 near 5-year low at 1.4566 (Apr) has ended earlier at 1.5930 (May) n weakness to 1.4966, then 1.4827
would be seen, being 70.7% n 80.9% retracements respectively of aforesaid upmove fm 1.4566 to 1.5930. Having said that, last week’s stronger-than-expected rise to 1.5265 suggests decline fm 1.5930 (Jun) has made a temporary low n 1.5295/00 needs to hold for prospect of another fall. Abv 1.5300 would risk stronger correction to 1.5335 but 1.5372 (38.2% r of 1.5930 to 1.5027) should remain intact.
. Today, cable’s rally fm y’day’s 1.5155 to as high as 1.5239 suggests pull back fm 1.5265 (Fri) has ended n said corrective rise fm 1.5027 may resume, abv 1.5242/47 would confirm this view, however, as hourly indicators would display ‘bearish divergences’ on next rise, reckon 1.5302 would cap upside n yield strg retracement of indicated upmove fm 1.5027 later.
AceTraderFx Jun 13: Daily Recommendations on Major -GBP/USD
 DAILY MARKET OUTLOOK on Major
Update Time 13 Jun 2017 07:30GMT
DAILY GBP/USD OUTLOOK - 1.2685
Cable’s cross-inspired break of 1.2702/07 sup to 1.2639 Monday confirms correction from last Friday’s 8-week low at 1.2636 has ended at 1.2780 (New York) and recent decline from May’s 7-1/2 month peak at 1.3048 would head towards 1.2615, ‘loss of momentum’ would keep GBP above 1.2575.
Sell on recovery for 1.2615 and only above 1.2720/25 prolongs consolidation, risks 1.2770/80 before down.