Yeah I read those Muthusai thanks.
Tryin to find the PCI stop on dealbook at the mo…not having much luck:mad:
Yeah I read those Muthusai thanks.
Tryin to find the PCI stop on dealbook at the mo…not having much luck:mad:
Ha, I am an MT4 Addict so can’t help much on deal book SL. We have other deal book users here who might be of help. Ok its getting late here and the market is dead. Time to Crash ! Gn
Muthu.
Anyone willing to share how they have their GFT charts setup? I gather that most of us watch a tab with 4-6 pairs (5 min) and switch to a pair specific tab when we see a pattern forming? Any little tips are much appreciated.
Toka,
In order to establish a predetermined stop loss in dealbook, you should right click on your chart, then choose enter stop sell for protecting your long positions, or enter limit buy, for your short positions. There’s no PCI stop loss option as such.
These orders you can put them in advance way before you set your entry. Just be careful that you use the same number of lots in your PCI as in your market order.
If you hit profit, then don’t forget cancelling manually your stop loss because if you don’t, and price reaches that point, then you’ll have a position that you didn’t want to enter in the first place.
If your stop loss is hit, then it automatically will cancel your entry order.
Another option you have in dealbook, is, (but I don’t think this is a recommendation for this method, but either way it is easier) one you’ve made your entry, right click on your position (in the main screen, not in you chart) and then select protect position with OCO (Order cancel order). With this option you assign a stop loss and a take profit target in once step, and whatever gets filled, the other order will be canceled automatically.
Hope this helps 
Here is what my setup looks like. I have eight pairs and every 15-20 minutes I flip through every tab and see if any patterns are deveopling. If I see a pattern or a possible pattern I draw a circle around it so I can reference it later. If I enter a trade I maximize the five minute chart. When I am done I click restore to resume my normal layout.
You also want to go to FILE > CONFIGURE > PARAMETERS and preset the amount of lots you want per trade.
Hi Mutu,
I wanted to ask u whether u r using the multiple amount method?
I mean if u do normaly 2 entries one at a time or u enter the whole amount at once. in case you r using the multiple amount method, can u kindly mark the entries in your charts?
your charts are my bread and butter for my learning, and I guess not just for me. previously u were asked to post your loosing trades. I hope its not too much. BTW i think that we can learn from loosing trades mostly when its not a good pattern…so u caqn show us what not to trade. but pls only if its not too much bother.
tnx
and namaste
Ilan
Hi Ilan,
Namaste & Vanakkam !
I see your point. It will be of help to see losers off bad patterns that will help us learn. I did post few of them in the previous thread (losers). They were few as compared to the winners except for the first week of november where it was not going my way. Moving forward i will post trades (both winners and losers) so we get a better idea. I trade one lot. And since i work i am not able to catch much patterns these days as compared to last few months where i had time to devote as i was doing some home based work. I also encourage readers to post charts off this method so we all can learn from each other. This strategy is very effective and we must all thank Tymen for helping us.
Regards,
Muthu.
Chennai.
India.
Ah I did miss that example you posted, I am still learning to recogonize the patterns. They are easy when it’s textbook, but looks like sometime it needs a judgment call. Speaking on that, what about this chart. What do you do with a long engulfing pattern where the wicks are exactly the same length. I have not been taking them but they look profitable.

Hi BlackSwan
your example of an engulfing pattern is valid, imho. Some people will also call this pattern a tweezer pattern, when the o & c are the same and the wicks are the same also. If you could super impose one candle onto the other it will give you the net result of the two periods and in your example the net result is almost a doji
best regards
Dave
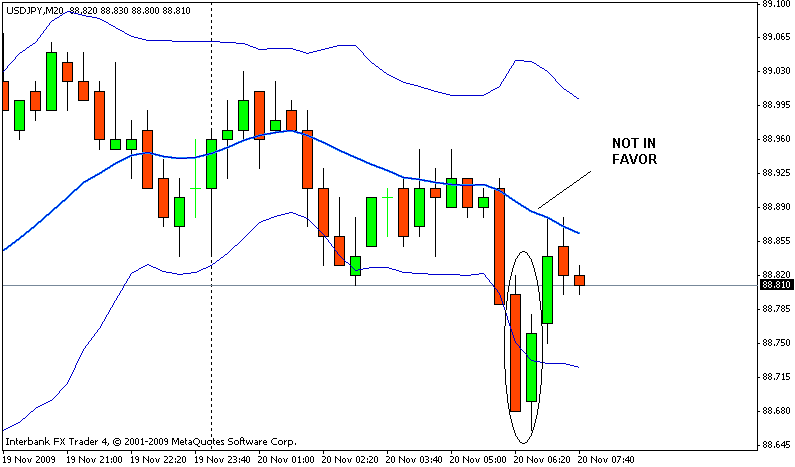
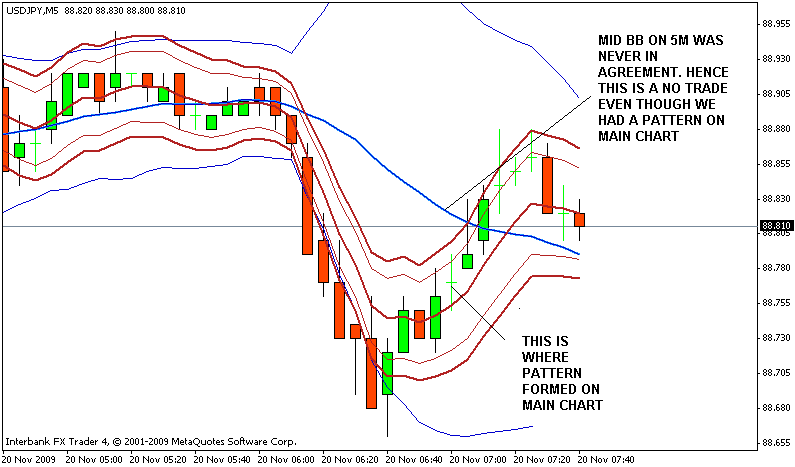
Hi,
I am posting a pattern which is not tradeable even though it went in our favor. Let have a look.
So why it is non tradeable ? Yes, the trade was risky looking at the main chart as the midd bb was going down while we are looking to go long. However, when we watch the 5m chart, we see that there was NEVER an agreement between midd bb and starcs (midd bb was going down). Hence no entry was possible. I would avoid such trades. Also we can see that it did not move much up and started its downward journey afterwards.
Regards,
Muthu.
Chennai.
India.
Also on the main chart there was no sustained down trend
Hi,
This pattern looks good enough for me to dive in. Ok i am off to work now. My request to the members following this thread. Please post charts. Thats the only way we learn from each other.
Regards,
Muthu.
Chennai.
India.
Thats great thanks, so there isn’t a PCI stop… no wonder I couldn’t find it…DOH :o
I will start practicing opening and closing for a while, see how I go.
I feel really odd at the moment cos I feel like I know the UM inside out but when it comes to it, I can’t even open a trade:o:
Here is a demo trade I am currently in.

When the pattern formed both the lower and mid BB were sloped down, which is not good. However, the bottom BB starts turning in within a few candles. Top BB is turned in nicely.

Here is the five minute chart. My entry was late, should have entered as soon as the mid-BB went flat. Should have exited when the price broke the top-BB. Could of had 10+ pips, ended up with 3 pips. Still learning…
Well spotted on the pattern. I would not take the trade because of the BB
The charts on only 1 of my workspaces are updating, all the rest will not update.
Anyone got any ideas please?
Yeah, I have the same problem.
If that does not do it there is a program they can give you that deletes your chart history. Go to the GFT homepage and click on the live chat and tell them your charts will not update. They will send the link to the program you need and the instructions.
Is this a new thing or have they never updated ?