Trade Alert – NZDUSD
↓ Buy Limit: 0.6020
 Take Profits:
- TP1: 0.6050
- TP2: 0.6070
- TP3: 0.6085
- TP4: 0.6100
 Stop Loss: 0.5995
Trade Alert – NZDUSD
↓ Buy Limit: 0.6020
Take Profits:
Stop Loss: 0.5995
Just a suggestion, Aryan (because you seem to start a new thread almost every time you post, in different parts of the forum), but why don’t you keep all your trades together, in one “Journal” thread.
I’m sure people would be a lot more interested, and able to follow much more easily, if you wouldn’t mind doing that instead of what you’re doing at the moment? 
(And as a couple of other members have mentioned, it would be really good to see some suggest6ion of the the reasons for your trades?  )
)
Thanks for your suggestion, I thought that may be somebody find in other topic < I did it. But I try to post in same topic.
moreover, some times it is live trade I post it in live trade but some of my idea are not live , I post in other topic
Suggest6ions would be great. Even suggest5ions would be helpful.
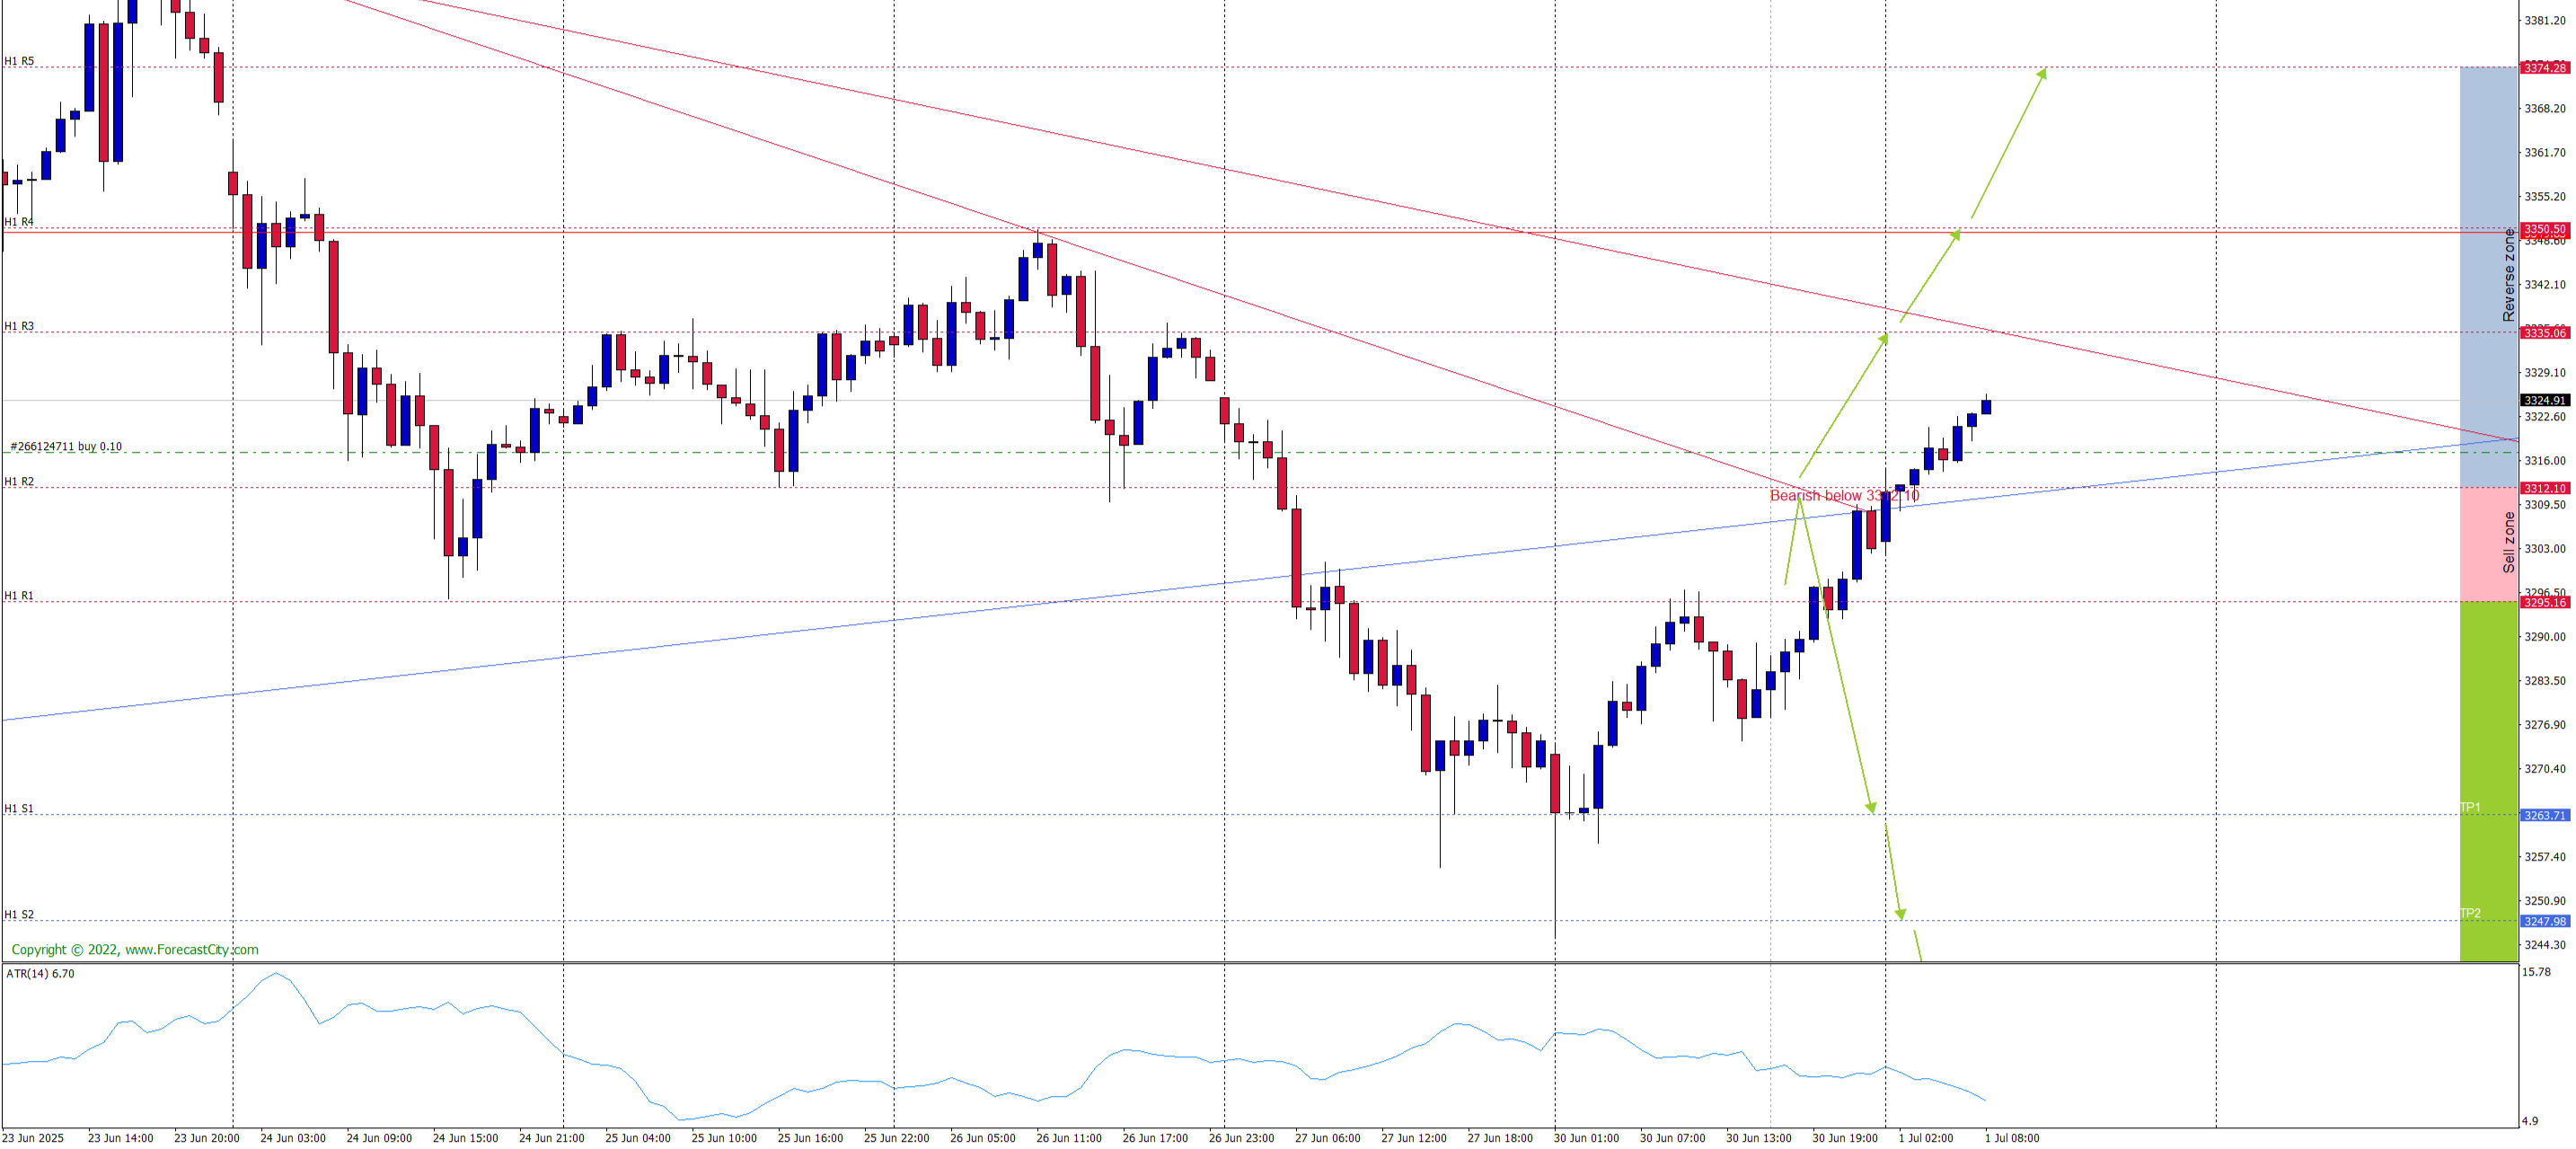
Gold bounced from the 3220 support zone and is now testing a confluence of descending trendlines and horizontal resistance at 3312–3320.
Key Notes:
• Price is attempting to break short-term bearish structure.
• Resistance at 3312–3320 is critical.
• Support remains strong around 3220.
Bullish above 3320 → targets: 3333, 3360+
Bearish below 3295 → targets: 3264, 3247
Price is at a decision zone—wait for confirmation.
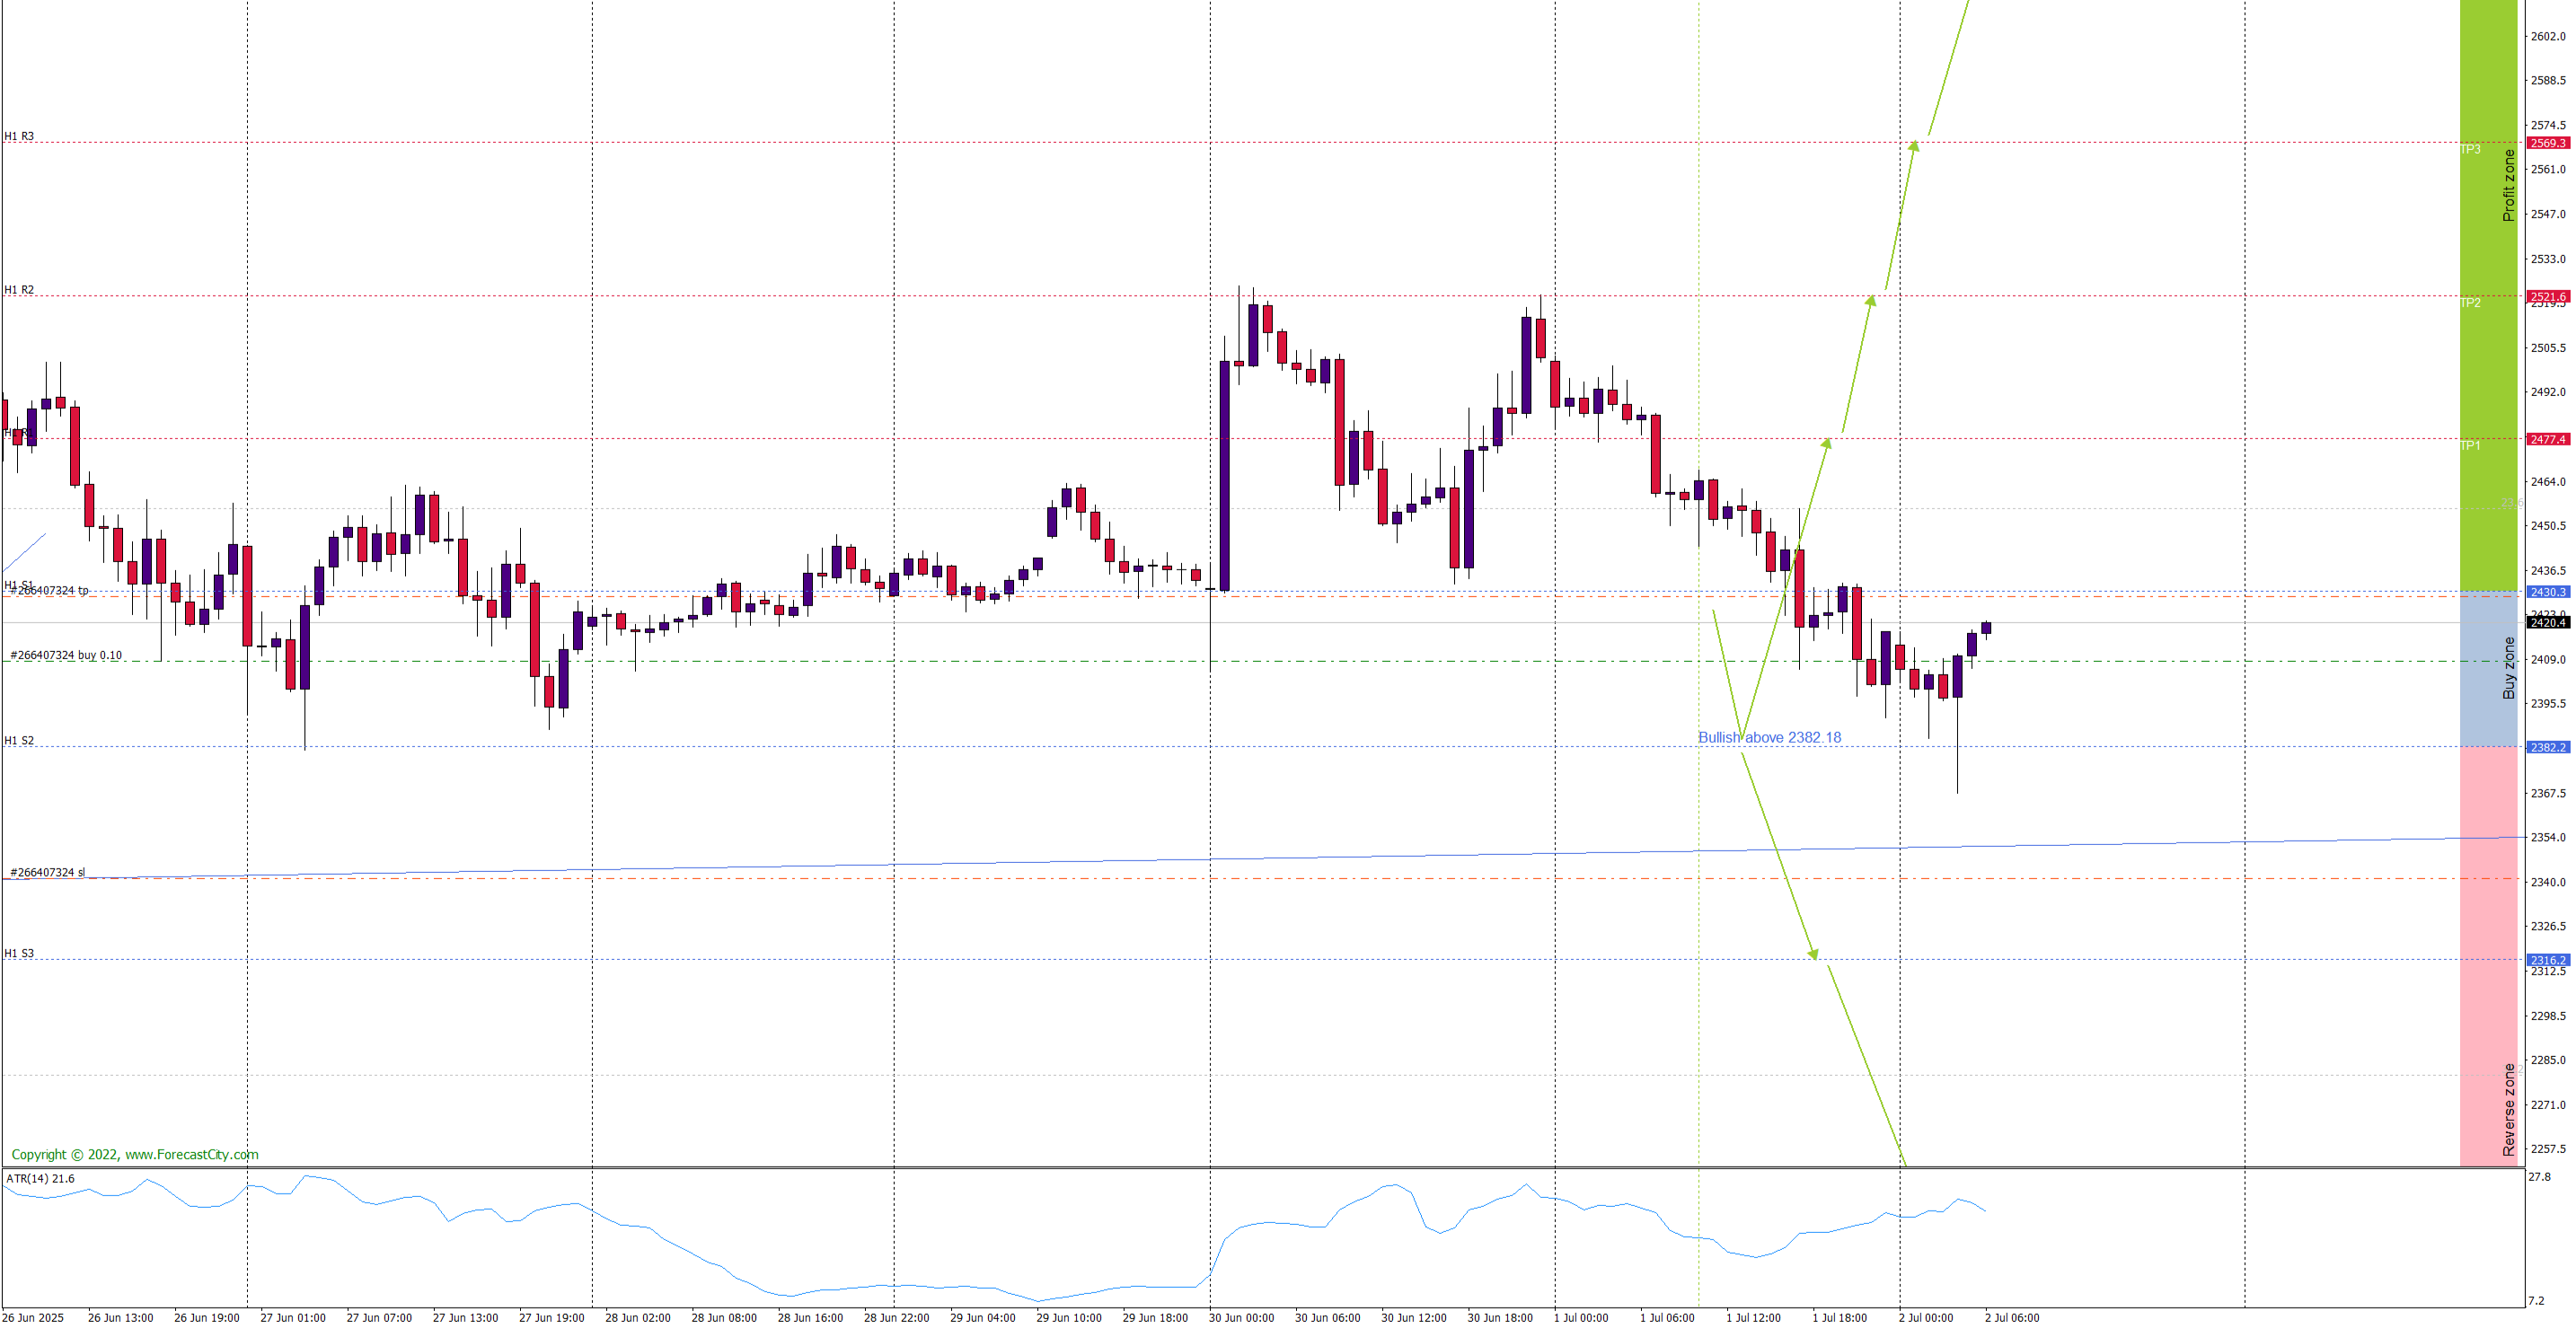
 ETHUSD Quick Analysis – H1
 Ethereum is testing support near 2402–2375 (Support Zone & H4 S1)
 If bulls hold this level, a bounce toward 2435, then 2475–2524 is possible
 Break below 2347 could drag price down to 2315 → 2280
 I’m in buy from support
#ETH #Ethereum #CryptoTrading #BuyZone #ETHUSD
Gold Technical Analysis
 Momentum Weakness After Channel Breakout
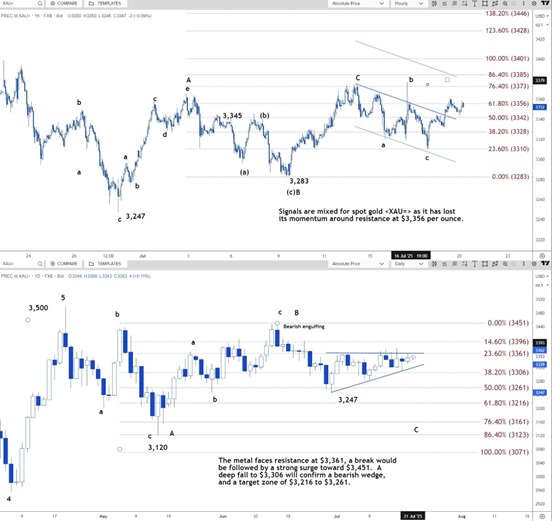
After breaking out of the falling channel, gold failed to surpass the $3356 resistance, showing weakening momentum.
 Technical Target: $3373–$3385
If gold breaks above $3356, it could rise towards the $3373–$3385 range.
 Possible Pullback to $3342
Failure at resistance may trigger a price pullback to $3342.
Key Resistance at $3361
Breaking $3361 on the daily chart could lead to a strong rally toward $3451.
 Watch for Bearish Breakdown
If price drops to $3306, a bearish wedge pattern would be confirmed, targeting the $3216–$3261 zone.
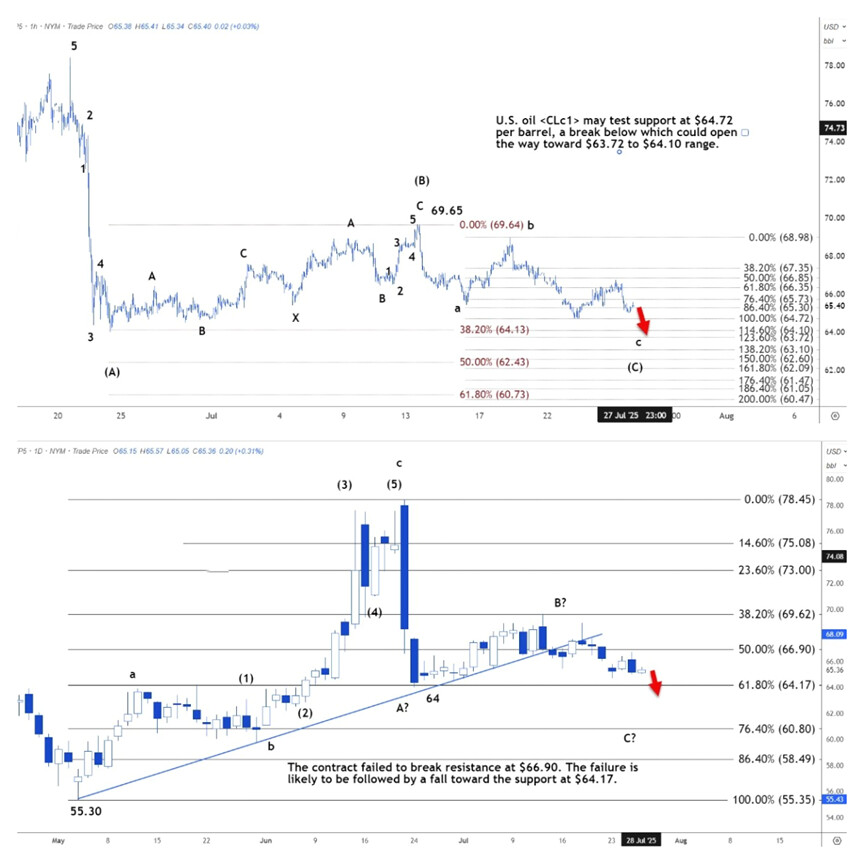
 WTI Crude Oil Technical Analysis: Testing Key Support – Will the Downtrend Resume?
WTI crude oil is approaching the key support level at $64.72.
A confirmed breakdown below this level could trigger a deeper pullback toward the $63.72–$64.10 range.
The sharp decline on July 25 appears to confirm the end of the previous rebound, which had originated near this support.
This also signals the continuation of the corrective wave C, which began from the $68.98 level.
 Immediate resistance: $65.73
A break above this level may pave the way for a rise toward the $66.35–$66.85 zone. 
On the daily chart, the failure to break through $66.90 resistance highlights weakening bullish momentum.
This may initiate a new leg down, with support seen at $64.17.
Currently, the market is range-bound between $64.17 and $66.90.
Only a decisive breakout from this range can provide a clearer directional signal. 
Source: Reuters Commodity & Energy Analysts
After two consecutive doji candles on the monthly chart, there is a possibility of a third doji forming in July. This pattern indicates that neither buyers nor sellers have fully taken control. Considering the sharp rise in gold prices over recent quarters and new historical highs, this price pattern seems logical and natural.
Although there was a slight rebound on Tuesday, after four days of decline, New York gold futures are still trying to hold the 50-day moving average support at $3,365.
 This support level is expected to break today, as the US dollar index remains strong after rising more than 1% on Monday.
This week’s candle isn’t very strong, indicating potential selling pressure that could start with a break below the $3,357 support, triggering a new selling wave.
On the other hand, if the price breaks the $3,402 resistance, the upward trend may continue, as the price is currently below the 9-day moving average resistance at $3,381.
WTI Crude Oil Technical Analysis
WTI pressured by weak jobs data; price below 6X remains vulnerable
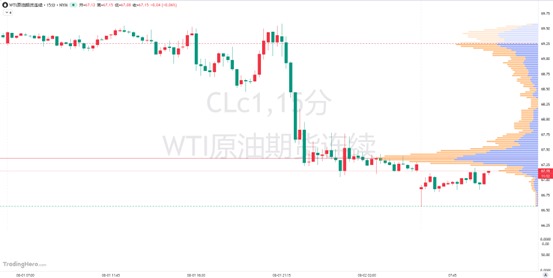
Weak U.S. employment data has dragged WTI prices down . After a bearish move, the current volume structure shows a double peak, indicating selling pressure. On Monday, crude opened with a downside gap and remains suppressed by lower volume resistance . If this pressure isn’t broken, the weakness is expected to continue.
Bull/Bear Line (Key Level): $67.8
Resistance Levels: 67.8 – 68.2 – 69.2
Support Levels: 66.3 – 65.3 – 64.7
(This analysis is for informational purposes only and does not constitute investment advice)
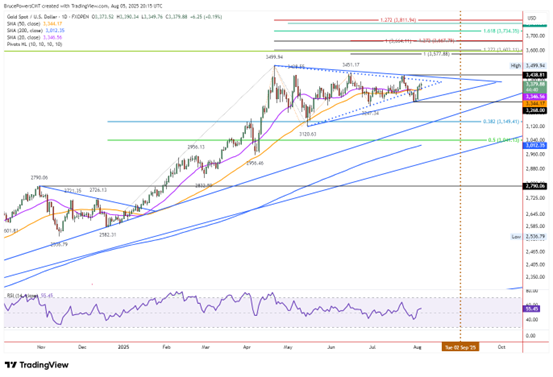
Gold – Expanding Triangle Flag Pattern
Strong buying entered the gold market on Friday  . While the price had dropped to $3268 earlier in the week, it rebounded by the end of the week, breaking through the $3345 resistance level.
If gold holds above Friday’s high, it may re-enter the expanding triangle flag pattern, with moving averages turning into support . The recent higher low at $3268 keeps the bullish structure intact, suggesting the previous flag pattern has simply expanded.
Key levels in this pattern:
Resistance: $3438
Support: $3268
The weekly candle closed as a bullish hammer, signaling that buyers may be gaining the upper hand  .
.
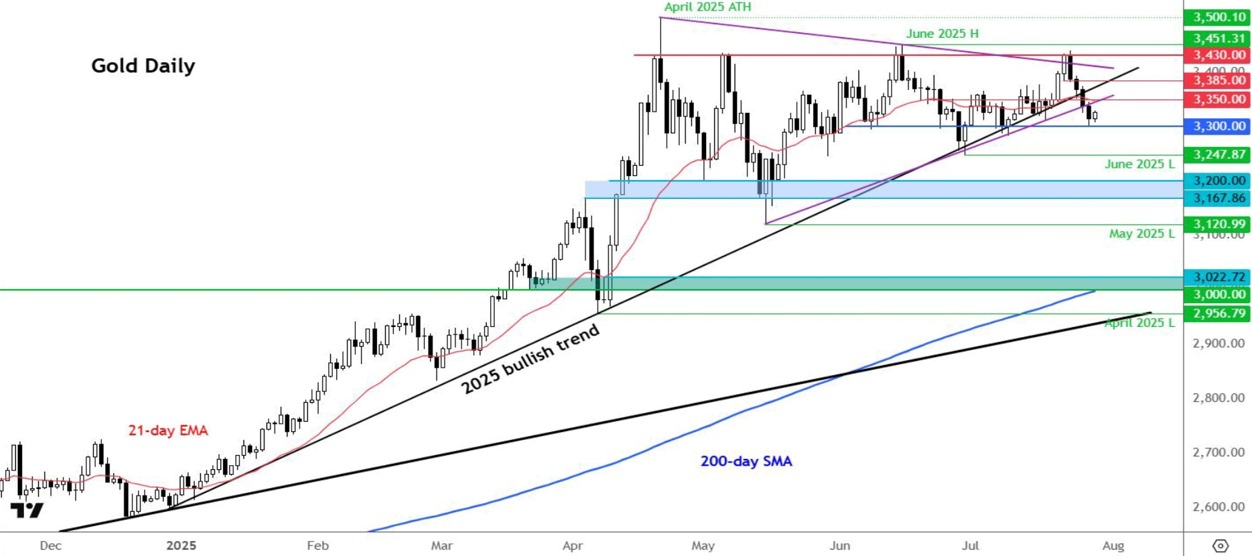
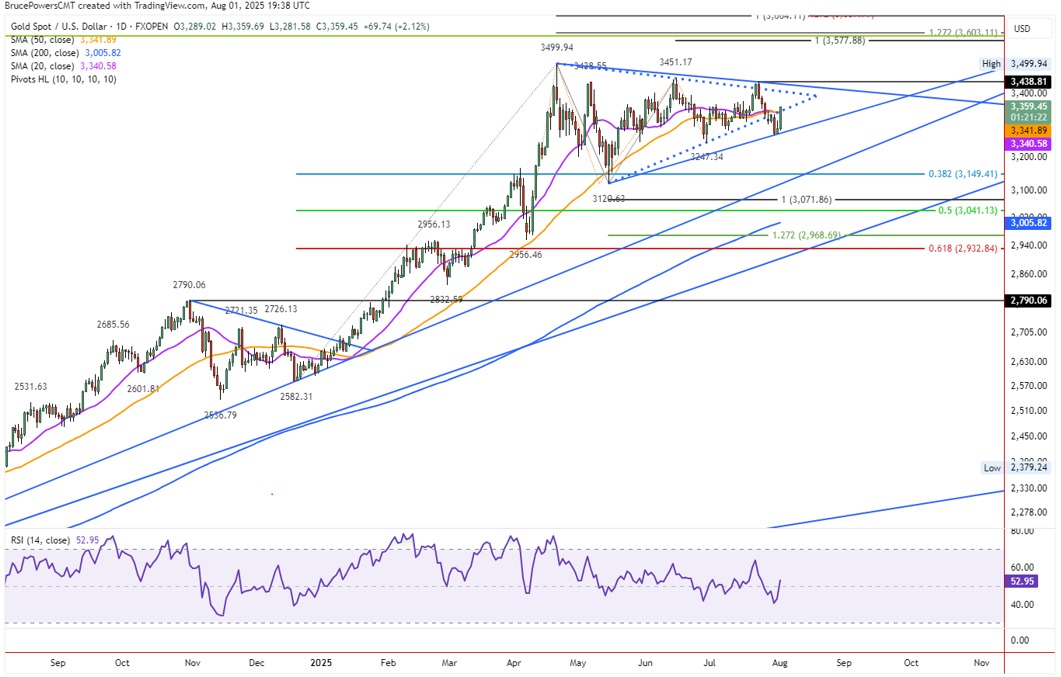
Gold Technical Outlook – Price Compression Continues Within Triangle PatternThe symmetrical triangle on the gold chart continues to tighten, and price action is approaching a decision point for a potential breakout or extended consolidation. 
On Tuesday, gold extended its upward movement within a developing consolidation pattern, forming both higher highs and higher lows. The price slightly broke above Monday’s high, reaching a new 8-day peak at $3,390. The daily low at $3,350 successfully retested the confluence area of the 20-day and 50-day moving averages, confirming strong support within the $3,344–$3,347 zone.
As long as gold remains within the triangle, further range-bound movement is expected. The narrowing of this range has reduced overall volatility, which often signals that a sharp move could be imminent.
The immediate upside target is the upper boundary of the triangle. A bullish breakout would first be signaled by a move above $3,439. A confirmed breakout requires a clean move through the key resistance at $3,451, which also represents the previous monthly high — thus marking a potential breakout on the monthly timeframe.
If the breakout sustains, the next target zone lies between $3,578 and $3,603. However, this scenario depends on strong momentum following the breakout. Without it, the risk of a pullback remains.
Gold Swing Technical Briefing: Bullish Momentum Remains Dominant – Watch This Key Support
Swing Strategy:
Suggested long entry at 3345.00,
Target: 3550.27,
 Stop-loss: Below 3268.18
Market Commentary:
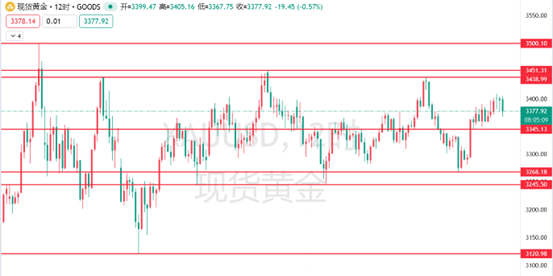
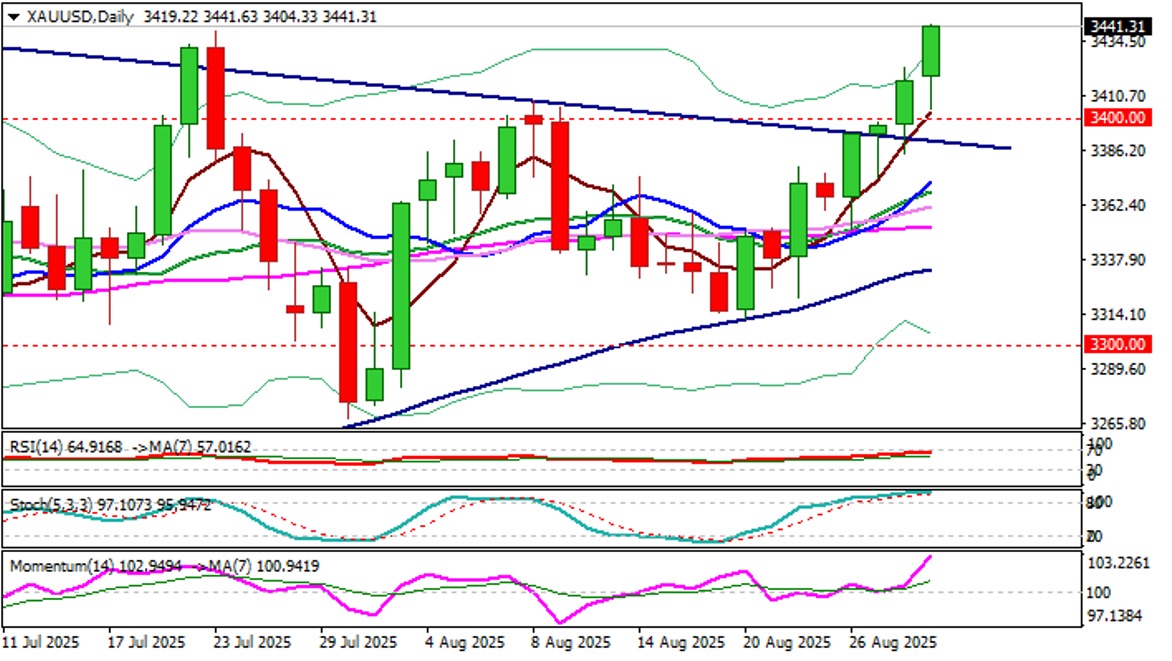
Gold continues to trade within a wide range, with bullish momentum currently in control. After finding support at 3345.13 (August 4 low), price returned to around 3400, though it has yet to test the upper boundary.
Keep a close eye on 3345.13 as a key support level.
If price breaks above 3451.31 (June 16 high) and the all-time high at 3500.10, it could extend gains toward 3550.27 and 3589.57 (Fibonacci extension level).
 Resistance levels:
3438.99, 3451.31, 3500.10, 3550.27, 3589.57
 Support levels:
3345.13, 3268.18, 3245.50, 3120.98, 3022.73
For informational purposes only and does not constitute investment advice.
Outlook for Global Gold Trends: Two Scenarios After the CPI Report
Current Situation:
July’s NFP (jobs report) came in weaker than expected
Markets have priced in a 90% chance of a rate cut in September
Some analysts even expect 3 rate cuts in total for this year
 Trump fired the head of the Bureau of Labor Statistics
Also nominated a new member for the Fed Board of Governors
These moves raise concerns about increased political influence on Fed policy
Main Focus:
July CPI report = key data for the Fed’s September policy decision
 Scenario 1 – CPI comes in lower than expected:
 Lower inflation = higher chance of rate cut
Gold likely to break above $3409.43
Next target: $3451.53
 With further positive catalysts → potential test of all-time highs
Scenario 2 – CPI comes in higher than expected:
US bond yields rise
Stronger US dollar
Downward pressure on gold, target: $3310.48
If that breaks → next targets: $3268.12 and $3244.41
For informational purposes only and does not constitute investment advice
Gold Faces Breakdown Risk Near Key Support
Stronger USD and Treasury yields weigh on gold. Traders are bracing for Powell’s Jackson Hole speech, expecting resistance to September rate cut hopes. Talks of Trump pushing to end the Ukraine war also dampen safe-haven demand.
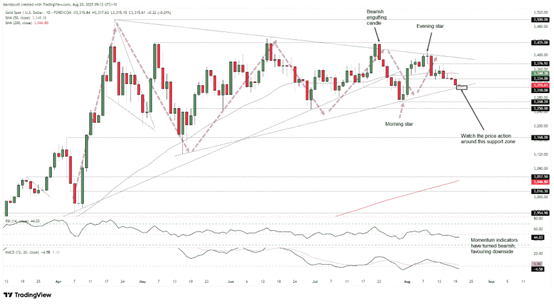
Technically, gold is testing $1,310 support. Bearish candles like the Evening Star and Bearish Engulfing confirm downside pressure. A break below opens room to $1,268 and key support at $1,250. Rebound targets lie at $1,344 and $1,376, with wedge breakout potentially pushing toward $1,500.
Momentum has turned bearish — caution warranted.
Gold Technical Outlook (Aug 20, 2025)
Topping Formation in Gold – $3,120 Target in Play
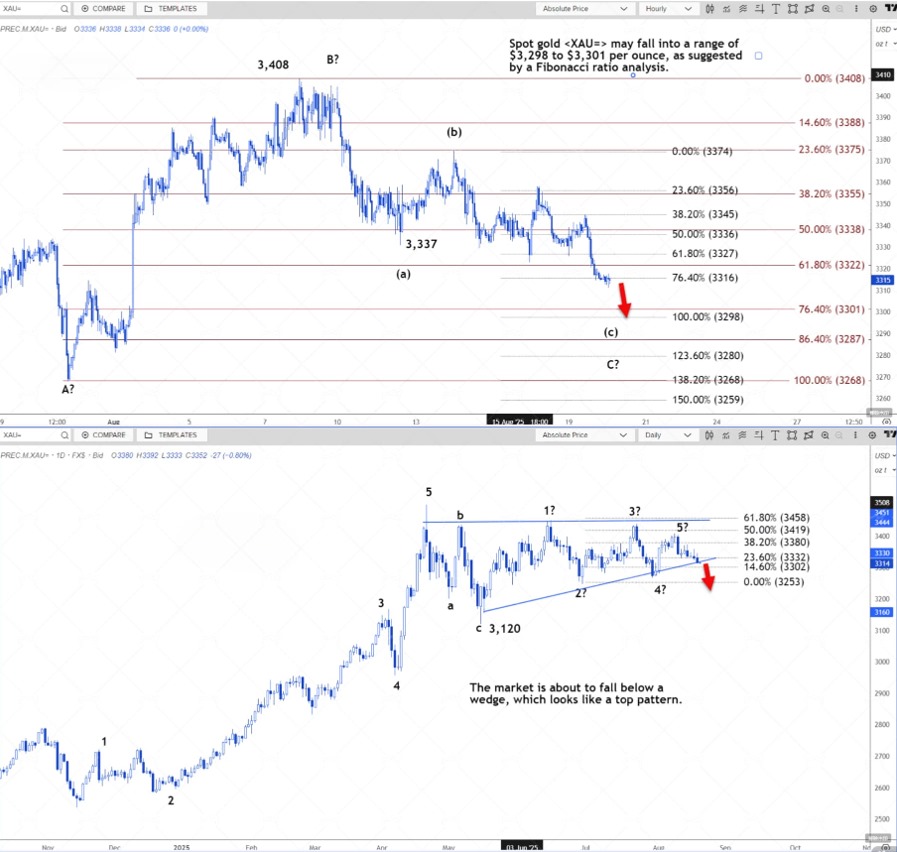
Fibonacci projections suggest a possible drop to $3,298–$3,301.
Wave (c) is underway and has broken the 61.8% level at $3,327. The 100% extension target sits at $3,298.
Retracement from $3,408 to $3,268 shows gold breaking the 61.8% fib at $3,322 — opening path to $3,301.
Resistance: $3,322. If broken, short-term rebound to $3,327–$3,336 is possible.
Daily chart shows price nearing a wedge breakdown. The pattern resembles a top formation.
A small 5-wave cycle from $3,120 may have ended, with wave 5 failing to extend. This supports a potential drop back toward $3,120.
 Source: Reuters Commodity Technical Analysis | Not investment advice.
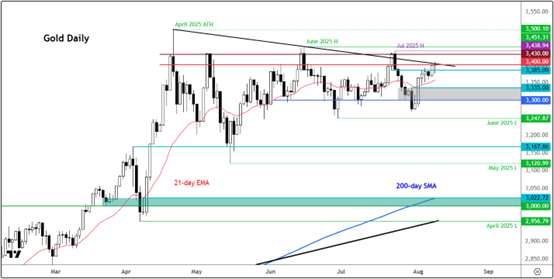
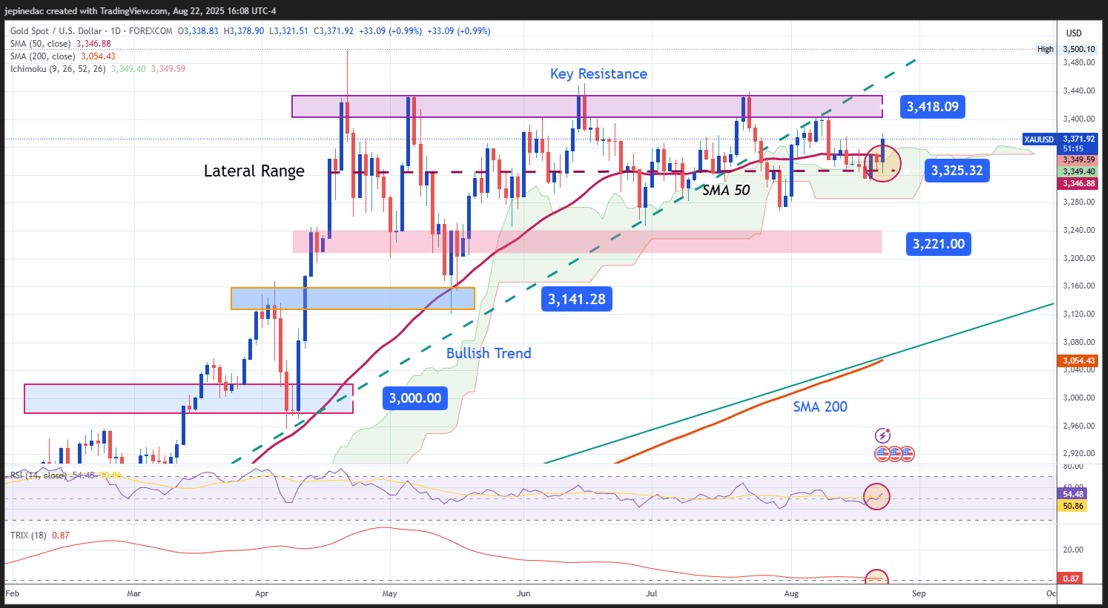
Powell’s speech lifted gold over 1%, nearing $3400. Markets expect rate cuts to weaken the USD, boosting gold’s appeal. Though short-term trend remains neutral, RSI above 50 signals growing bullish momentum, while TRIX stays flat. Key resistance is $3400 — a breakout confirms a long-term uptrend. Support lies at $3300 and stronger at $3200. A break below $3200 may trigger heavier selling and shift the market outlook.
Bitcoin has broken below the 50-day EMA with falling volume, signaling weakening bullish momentum. This key support held in past bull markets but now acts as resistance — buyers lack strength to reclaim it.
Volume drop adds pressure and reflects cautious sentiment. If BTC fails to recover above the 50-day EMA soon, the next key support is near $111,000 (100-day EMA). Breaking that may signal a broader trend reversal.
Key resistance is now at $116,000. Without breaking it, the bull market narrative remains fragile.
Official Gold Market Analysis | A Move Toward $4000?
After five months of consolidation, gold has broken out of a compressed technical pattern and entered a bullish trend.
Independent analyst Jesse Colombo believes the end of summer and the return of trading volume have triggered this upward momentum.
Softer-than-expected PCE inflation data has boosted expectations of a Fed rate cut in September — a bullish driver for gold.
A firm close above $3500 could pave the way for a move toward $4000 in the coming months.
Western investors are now joining the rally, following earlier demand from Asian investors and central banks.
If gold holds current levels, a mid-term bull market looks increasingly likely.
(Source: Jesse Colombo)
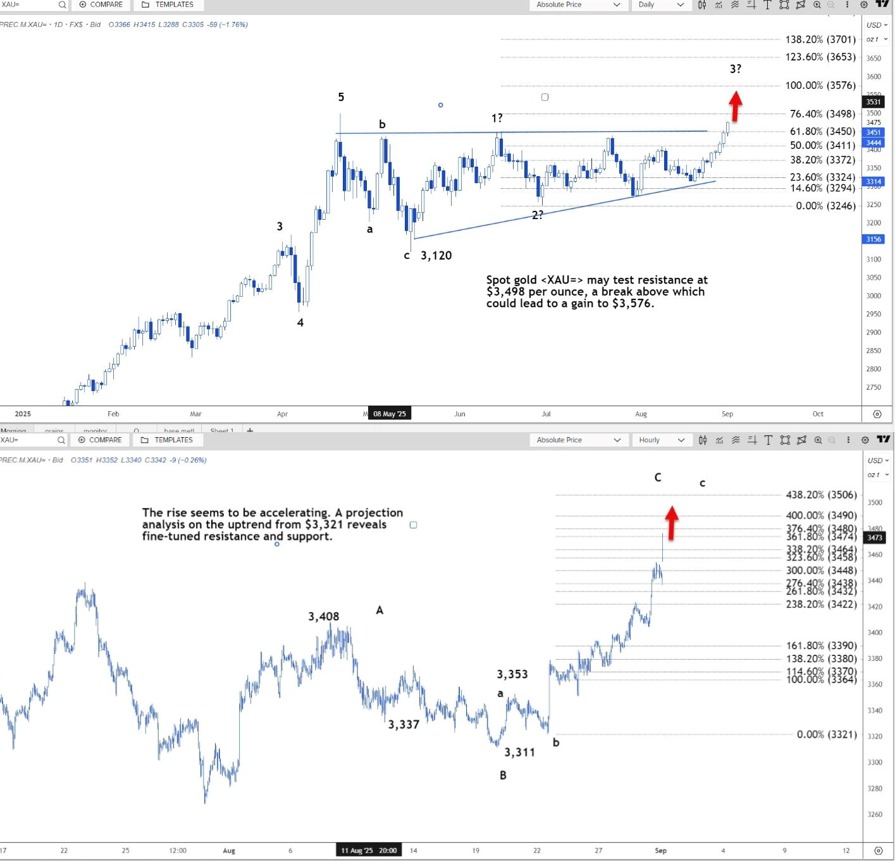
Spot gold price has entered a bullish trend after breaking the $3450 resistance and is likely to test $3498 next. If broken, targets are $3576 and $3701.
A bullish wedge pattern is confirmed with low chances of deep correction. Support lies at $3450 and if price falls, it may reach the $3372-$3411 range. 
(Source: Reuters Commodities and Energy Technical Analysts)