Silver: Strong Resistance Around $41
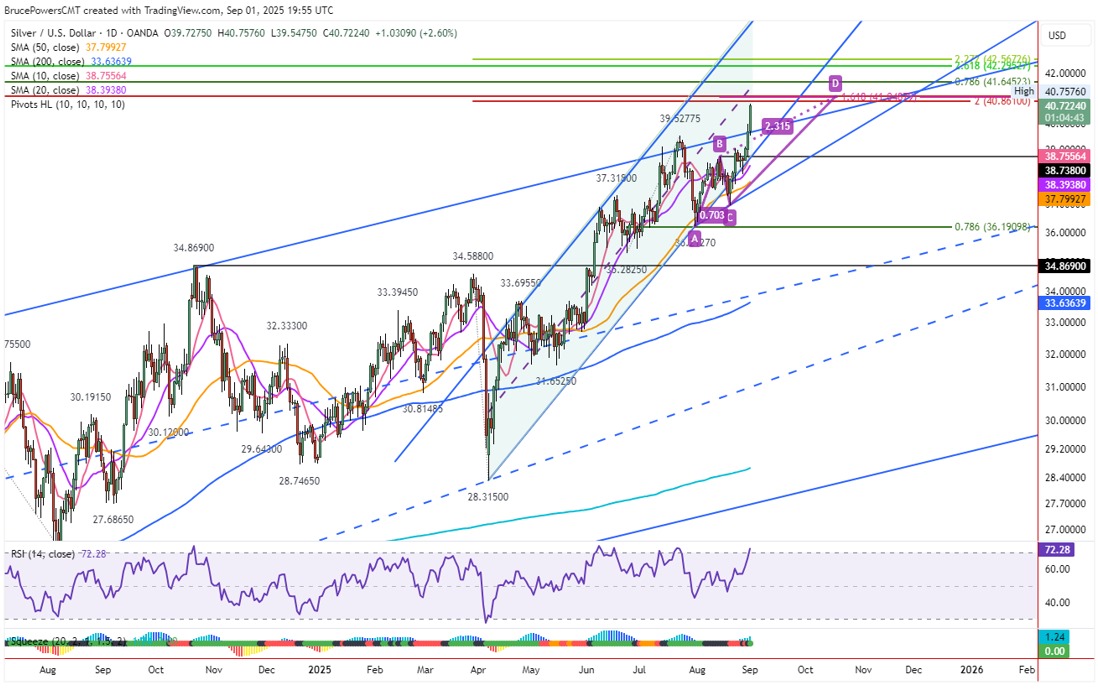
On Monday, during shortened U.S. trading hours, silver hit a new high at $40.76, breaking above last week’s $39.97 peak. It even moved beyond the upper edge of a long-term ascending channel, confirming continued bullish momentum.
 But the $40.86–41.09 zone holds key resistances:
200% extension of a recent pullback
127.2% Fibonacci extension of 2021 drop
161.8% target of a short-term ABCD pattern
 This zone may act as a pause or consolidation area. Still, the broader uptrend remains intact. August’s monthly close above July’s peak confirms strength in the larger time frame.

 Gold: Rally Continues, But Eyes on U.S. Jobs
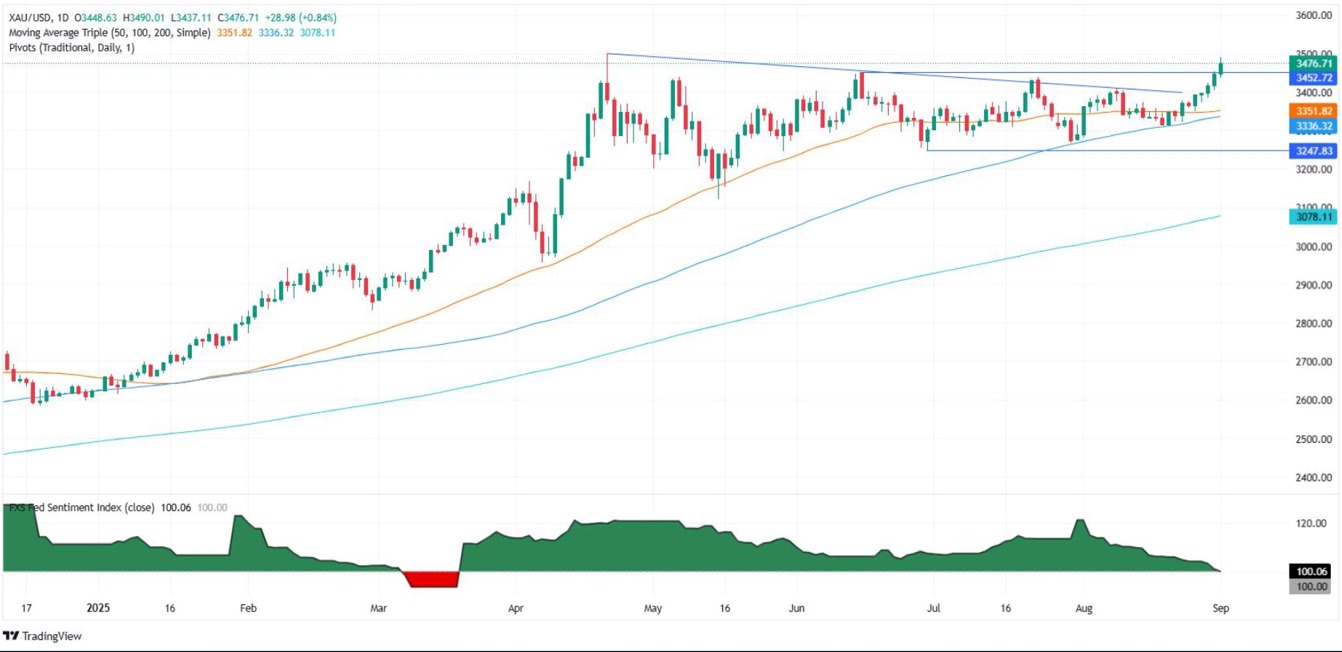
Gold broke above $3450 last week, briefly touching $3500. Weak USD, Fed concerns, and geopolitical risks drive demand — but all eyes are now on U.S. jobs data.

 Key Levels & Technicals
Next resistances: $3550, $3600, $3657.
Below $3400, a pullback is likely. RSI is near 70 but the trend remains strong.

 U.S. Jobs: Key to Fed Policy and Gold’s Path
Friday’s NFP is critical. July revisions matter more than August’s new data. Forecast: only +68K jobs.
Weak results may trigger a Fed rate cut cycle (up to 100bps) — bullish for gold. Strong data may slow the rally.
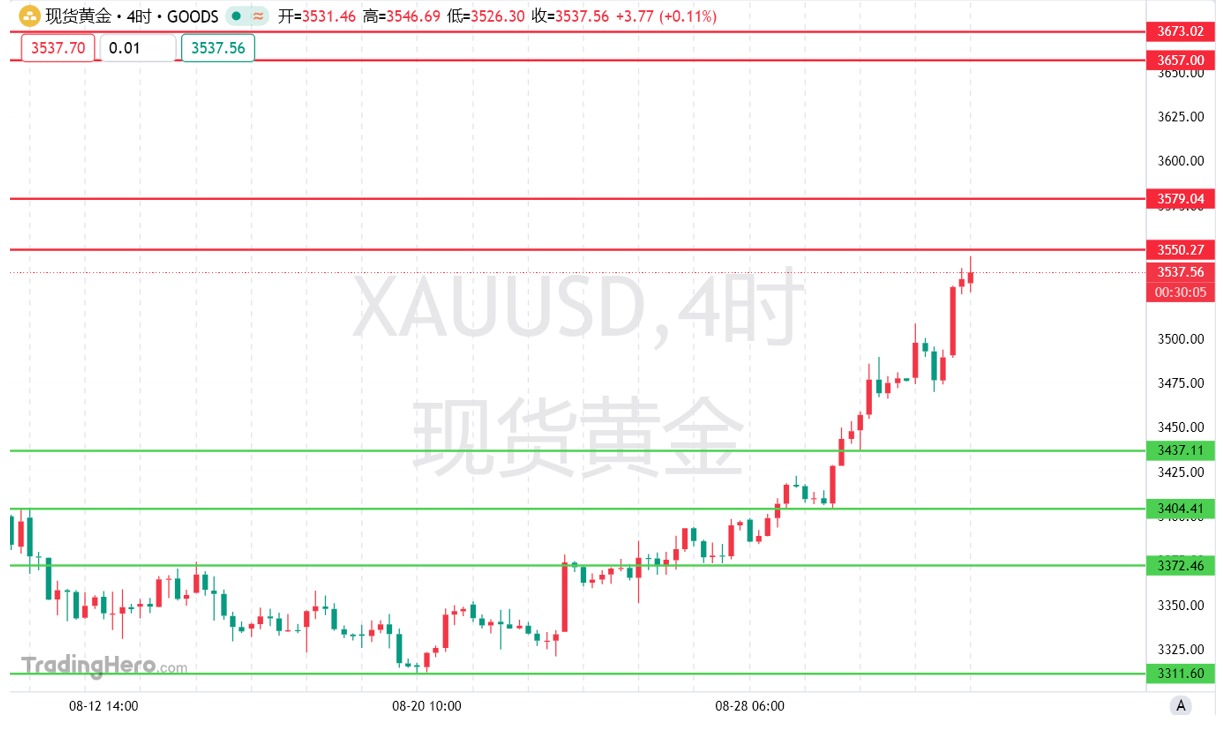
Gold broke above the key $3500 resistance and set a new record high. With strengthening technical indicators and 88% market bullish sentiment, the uptrend appears sustainable. Next targets are $3550–$3579, with potential extension toward $3657.
 In case of a pullback, key support lies at $3404. A break below may open the path to $3351. However, current corrections are shallow, indicating strong upward momentum.
On the macro side, economic growth is slowing, the labor market is weakening, and stagflation risks are rising. Gold continues to benefit as both an inflation hedge and a crisis hedge.
 Resistance levels: 3550, 3579, 3657, 3673, 3705
Support levels: 3437, 3404, 3351, 3311, 3268
Barclays has reiterated its “hold” rating for Meta (NASDAQ: META) shares, citing the potential revenue growth from the WhatsApp and Threads platforms as the main reason. The investment firm forecasts that by 2026 and 2027, WhatsApp and Threads could generate an additional $6 billion and $19 billion in advertising revenue, respectively. These projections are based on Meta’s impressive current financial performance, with revenue of $178.8 billion, reflecting a 19.37% year-over-year growth.
 Advertising in WhatsApp Status, which has over 1.5 billion daily active users, generates a large volume of ad inventory with lower user acquisition costs,
  while Threads, although smaller, has higher revenue potential due to its user base in higher-income regions, and the analyst recommends buying META shares around the $727 price level.
 Trading Product: Google NASDAQ: GOOG
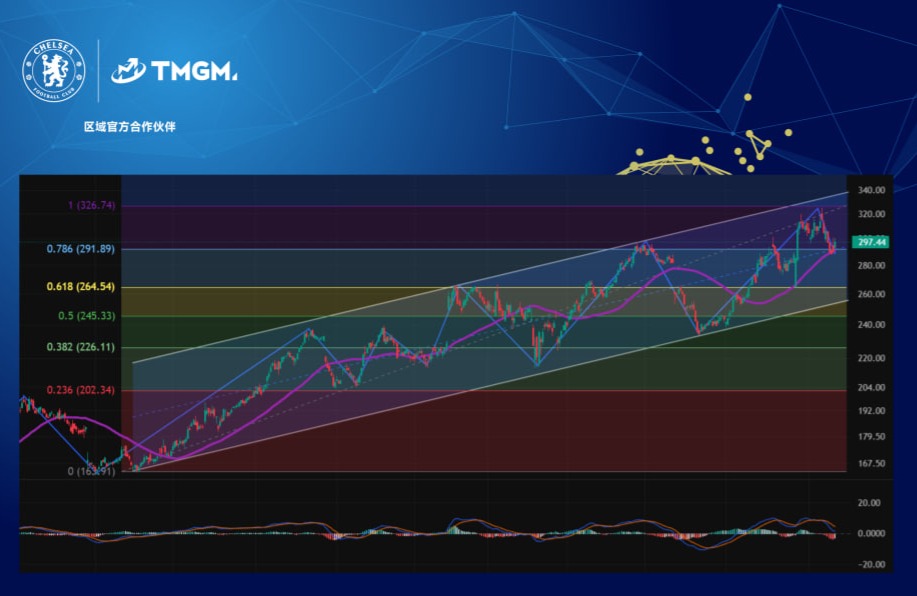
Reports indicate that Meta is exploring the use of Google’s AI models — including Gemini and Gemma — to enhance its advertising performance. These models are expected to help improve content understanding and enable more accurate ad targeting, becoming part of Meta’s ad recommendation system.  The discussions are still in early stages and no formal agreement has been reached yet, but if they progress, it could benefit both companies. Under these conditions, buying Google stock around the $237 level may be worth considering.
Gold Technical Analysis: Potential Break Above $4000
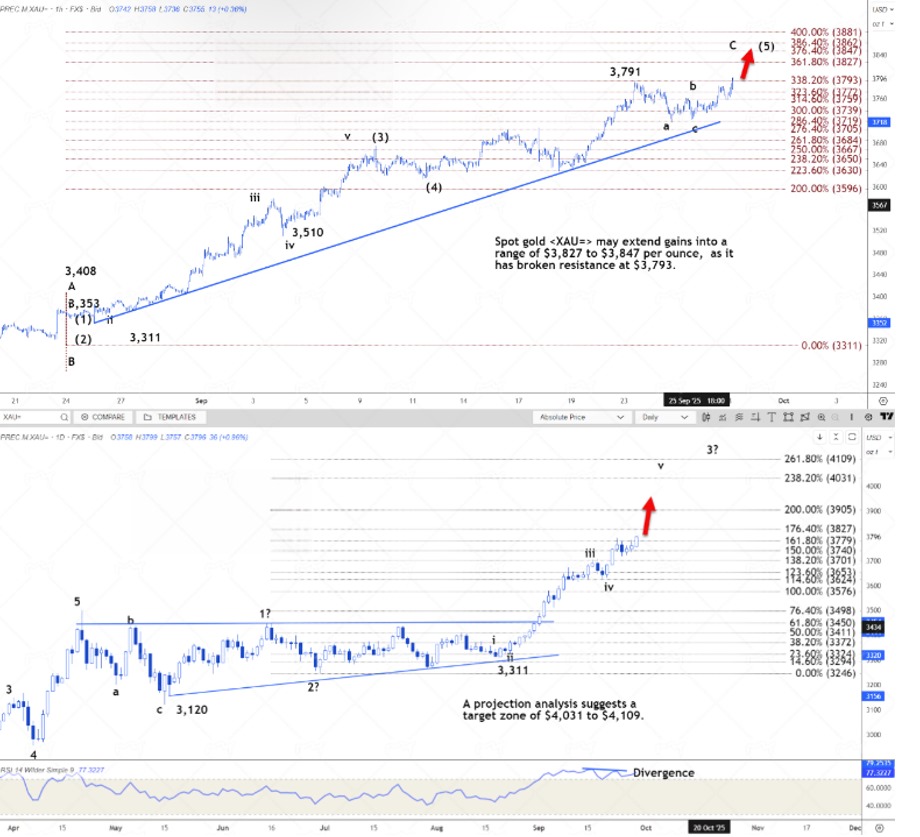
Spot gold has broken the $3793 resistance and surpassed the September 23 high of $3791, confirming an uptrend from $3311. The next target is seen in the $3827–3847 range. Based on recent consolidation between $3719 and $3793, prices may rise to $3862.
Support lies between $3759 and $3772; a break below could trigger a drop to $3719.
On the daily chart, long-term targets are between $4031 and $4109, with a realistic target at $3905, representing 200% of the wave starting from $3246. 
Cautious AUD/USD Rise; Focus on Inflation and RBA Policy
 AUD/USD continues to strengthen, supported by two key factors:
The potential U.S. government shutdown from October 1st, which is weighing on the USD
Australia’s stronger-than-expected inflation data, which has lowered expectations for near-term RBA rate cuts.
Australia’s budget deficit through June 2025 is projected at AUD 10B, far below the Treasury’s earlier estimate of AUD 27.9B — a sign of stronger fiscal health.
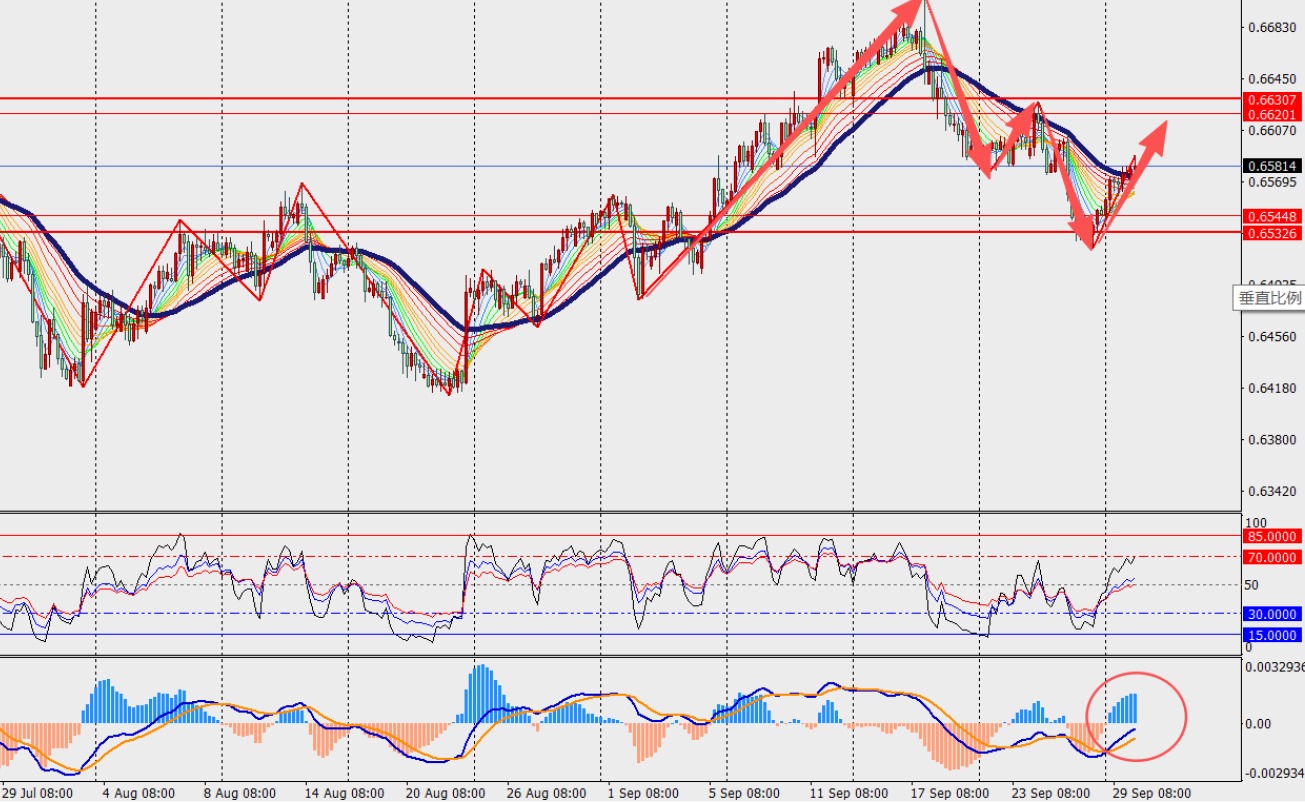
Technical view: On the H4 chart, AUD/USD is rebounding near the 48-day balance line. MACD lines and histogram are expanding below the zero axis, suggesting continued volatility.
Rate cut expectations:
Sept meeting: only 6.5% probability
Nov meeting: 38.2% probability
Resistance: 0.6630 / 0.6670
Support: 0.6540 / 0.6500

 U.S.–Australia Critical Minerals Agreement
Fundamental:
U.S. President Trump and Australian Prime Minister Albanese signed a rare earth and critical minerals agreement on Monday at the White House. Albanese called it an $8.5 billion ready-to-go project. As part of the agreement, both sides agreed to cut approval procedures for mining and processing operations to boost production. They also plan to jointly invest over $3 billion in the next six months. The estimated resource value of the projects is $53 billion.
Technical:
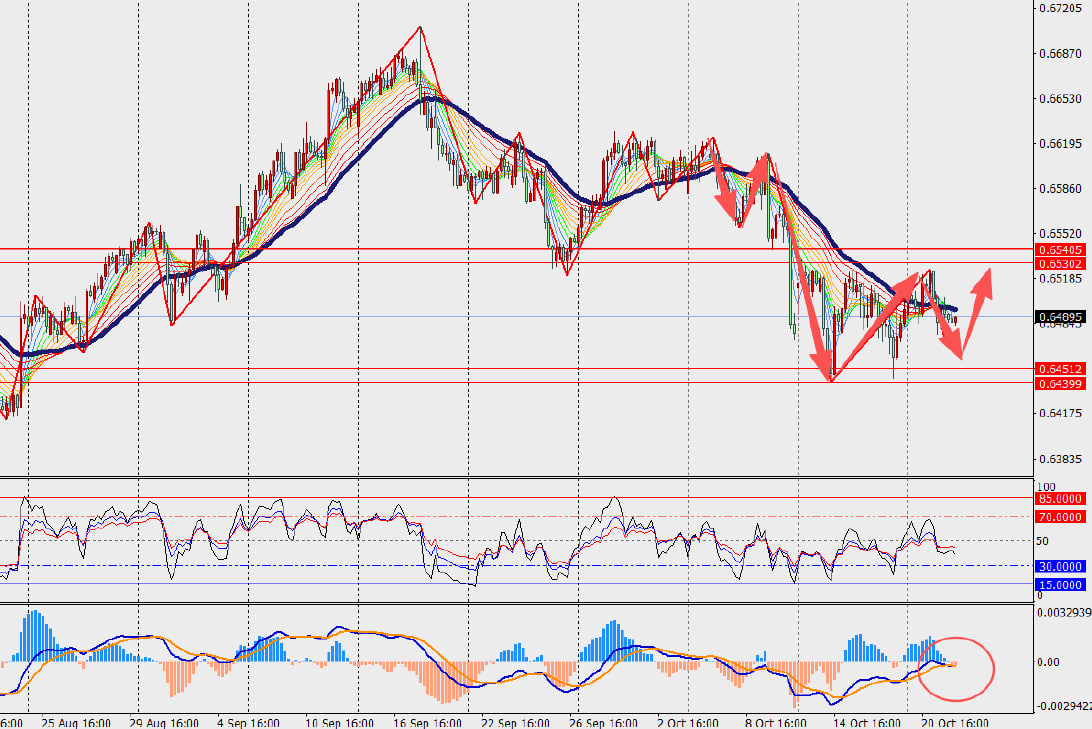
On the H4 AUD/USD chart, price is fluctuating and hovering near the 48-period equilibrium line.
MACD lines and histogram bars are converging near the zero axis, showing lack of clear market direction.
Key Levels:
1st Resistance: 0.6530
2nd Resistance: 0.6570
1st Support: 0.6440
2nd Support: 0.6400
Euro to USD Analysis
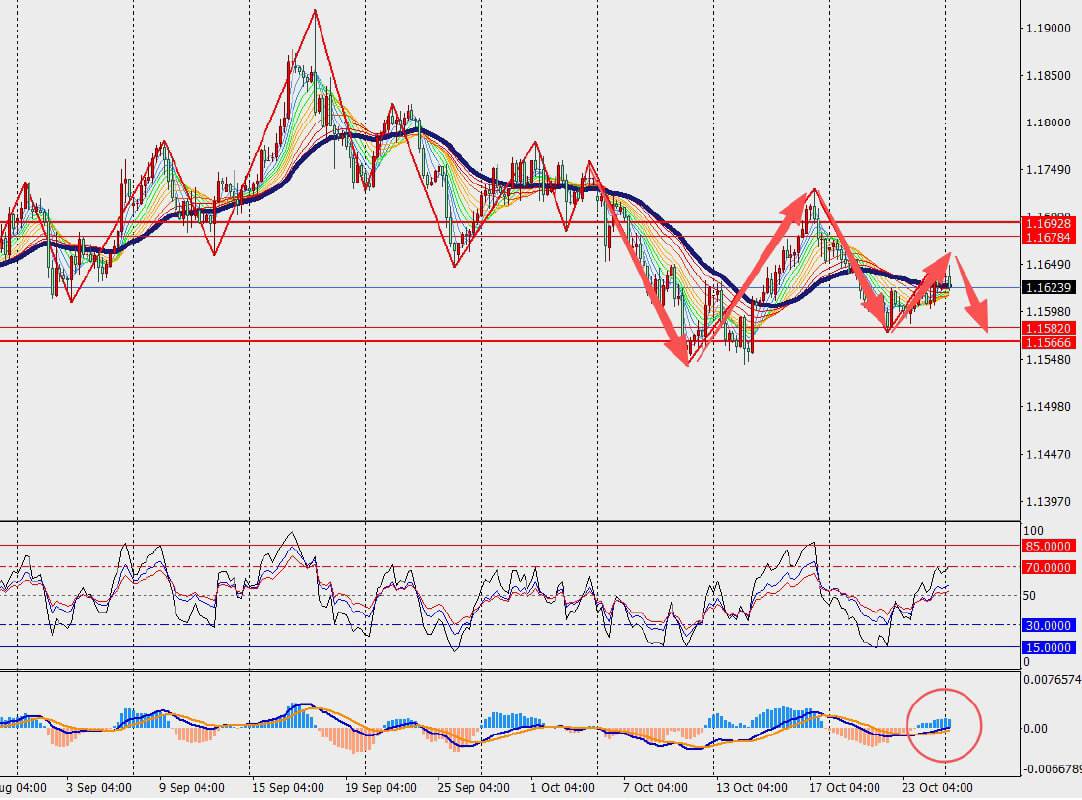
The movement of the euro is driven by economic data and trade developments in the Eurozone. Surveys indicate that Eurozone business activity in October grew faster than expected, especially in the services sector, and the PMI exceeded market forecasts, providing immediate support. Although weak US CPI benefits the euro, market pricing for a Fed rate cut is already fully reflected and has not amplified euro gains. Meanwhile, expectations for leader meetings inject some optimism into the euro, with investors hoping that trade easing will boost Eurozone exports.
 Technical Analysis
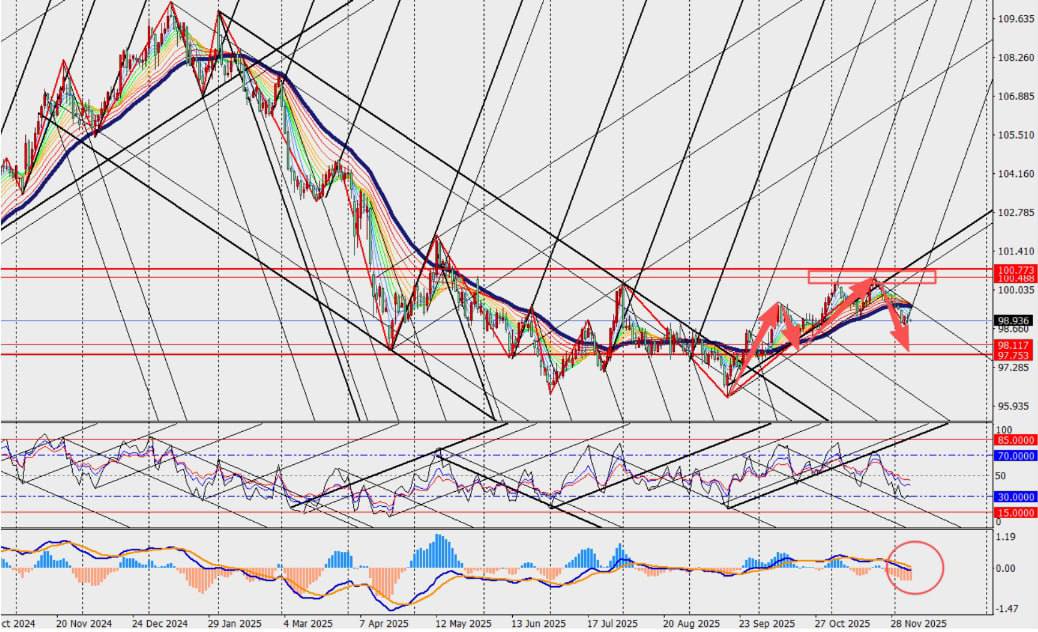
EUR/USD has faced resistance on the H4 chart and has pulled back, trading near the 48-day buy/sell boundary. Also, the MACD lines and volume bars have decreased near the zero axis. Key indicators this week, such as Germany’s business confidence index, labor market report, Eurozone unemployment rate, and GDP, will test economic resilience.
 Key Levels
1st Resistance: 1.1680
1st Support: 1.1570
2nd Resistance: 1.1730
2nd Support: 1.1520
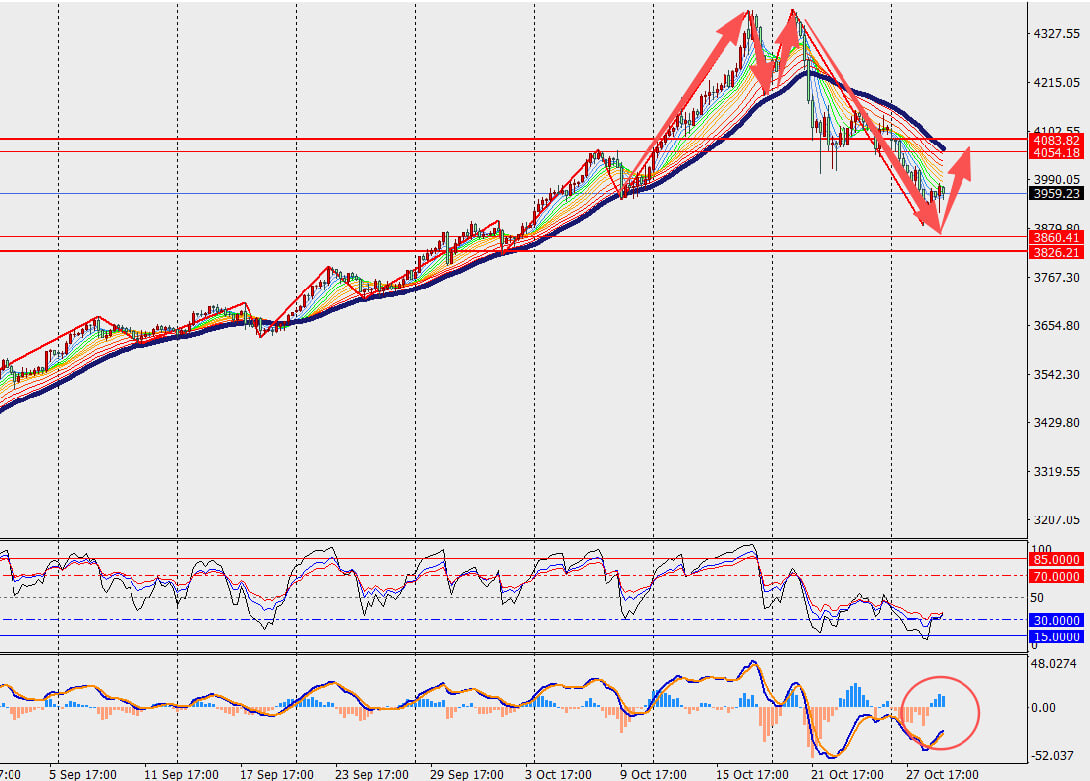
Gold Analysis
Fundamental
Senior officials from China and the U.S. have reached a consensus on the framework of a potential trade agreement, which has eased market concerns, but negotiations are not yet concluded. Additionally, with major central bank events approaching, investors are reluctant to take new bearish positions on gold, making this the key factor behind current price fluctuations.
However, risks of escalating geopolitical tensions persist, providing some safe-haven demand support and preventing prices from dropping too far.
Technical
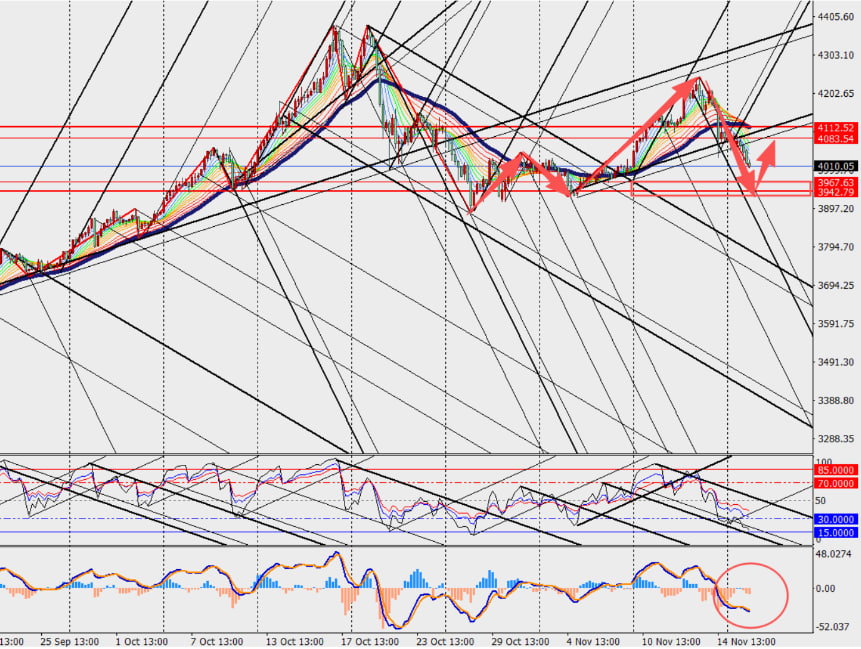
On the H4 gold chart, prices are oscillating and rebounding but still trading below the 48-day long/short demarcation line. Additionally, MACD lines and volume bars are shrinking below the zero axis.
Market attention will focus on Fed Chair Powell’s policy statement and press conference, particularly any forward guidance, as these will directly influence gold’s future trend direction.
 Resistance & Support
1st resistance: 3977.00
1st support: 3940.00
2nd resistance: 3995.00
2nd support: 3920.00
Fundamental: Gold hit a historic $4,000. A new wave of capital from crypto, led by stablecoin giant Tether, is entering gold mining and investing heavily. Around $370T of financial assets are shifting into physical assets, faster than expected.
Technical: On H4, gold is oscillating below the 48-day trend line. MACD and volume histogram formed a bullish Golden Cross, suggesting potential price rise to support central banks’ goal of over 50% gold reserves.
Key Levels:
Resistance 1: 3977 | Support 1: 3940
Resistance 2: 3995 | Support 2: 3920
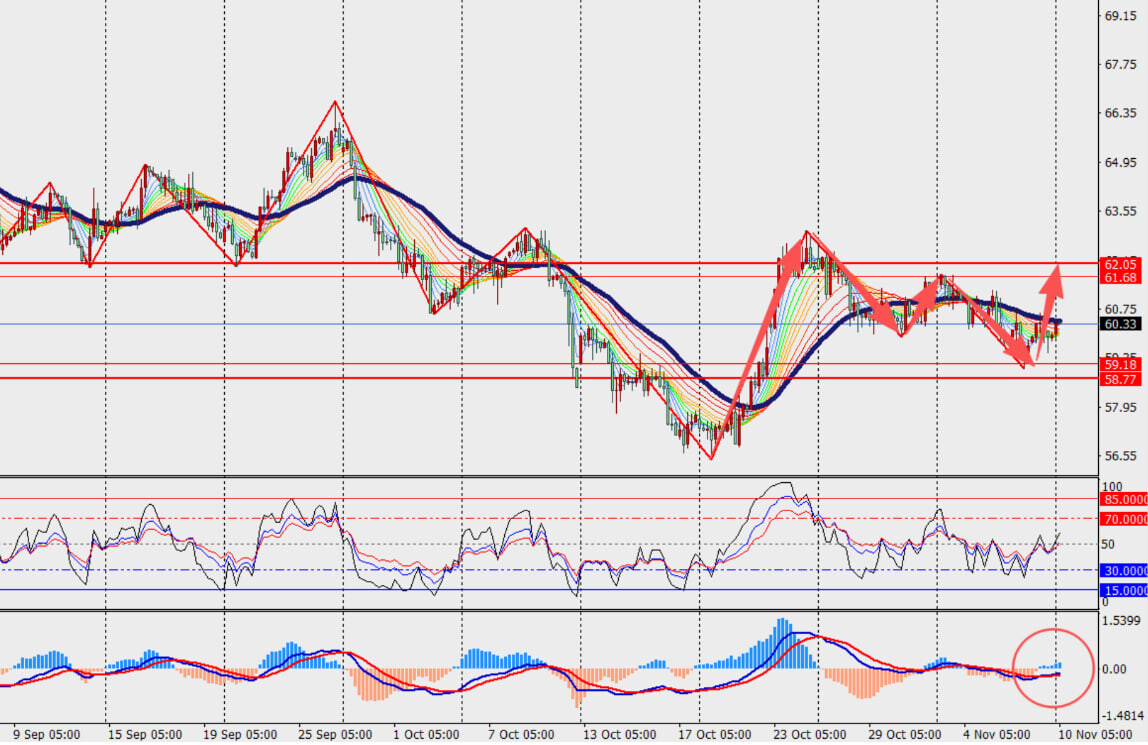
Crude Oil Analysis
 Fundamental:
Market focus is on the White House meeting between President Trump and Hungarian Prime Minister Orbán. Investors hope this meeting could pave the way for Hungary to continue using Russian oil, easing supply concerns linked to sanctions.
Meanwhile, data from Asia show a positive outlook — October crude imports rose both month-on-month and year-on-year, signaling steady demand.
Technical:
On the 4-hour chart, crude oil has slightly rebounded and is fluctuating near the 48-day equilibrium line. The MACD is expanding below the zero axis, indicating downward pressure. U.S. crude inventories rose more than expected due to higher imports and slower refinery activity, creating selling pressure; however, declining gasoline and distillate inventories provided some support.
Key Levels:
 Resistance: 63.00 – 65.00
Support: 58.00 – 56.00
Oppenheimer believes IBM’s shift toward software and AI will support sustained growth in revenue and profit margins. They set a 12–18 month price target of $360 and see strong contributions from HashiCorp and RedHat. IBM’s consulting segment is also expected to grow steadily as demand for software development and management increases. With companies expanding their use of AI tools, IBM is viewed as well-positioned, and buying the stock around $287 is considered reasonable.
It’s almost certain that the Fed will cut rates again, but the key question is how Powell will talk about the possibility of further easing next month. Markets expect a rate cut with a slightly hawkish tone, meaning Powell may avoid signaling another cut in January to satisfy the hawkish members of the committee.
Bank of America says Powell is facing the biggest internal disagreement in years, so delivering a “hawkish cut” won’t be easy—especially with several major economic data releases coming before the next meeting.
Powell will likely emphasize that after this cut, rates will be close to neutral, and any further easing will depend on a clear deterioration in the labor market.
The dollar index remains in a mild downtrend, and markets currently assign only a 25% chance of a January rate cut, though BoA believes Powell may still leave the door slightly open.
Gold Fundamental Analysis:
Looking into 2026, gold remains firmly bullish, supported by lower interest rates, ongoing currency depreciation, supply dynamics, and diversified demand. Prices are expected to reach $4,700 in H1, with no clear catalyst for a major downside move. The long-term trading range is projected at $4,200–$5,100.
Technical Analysis:
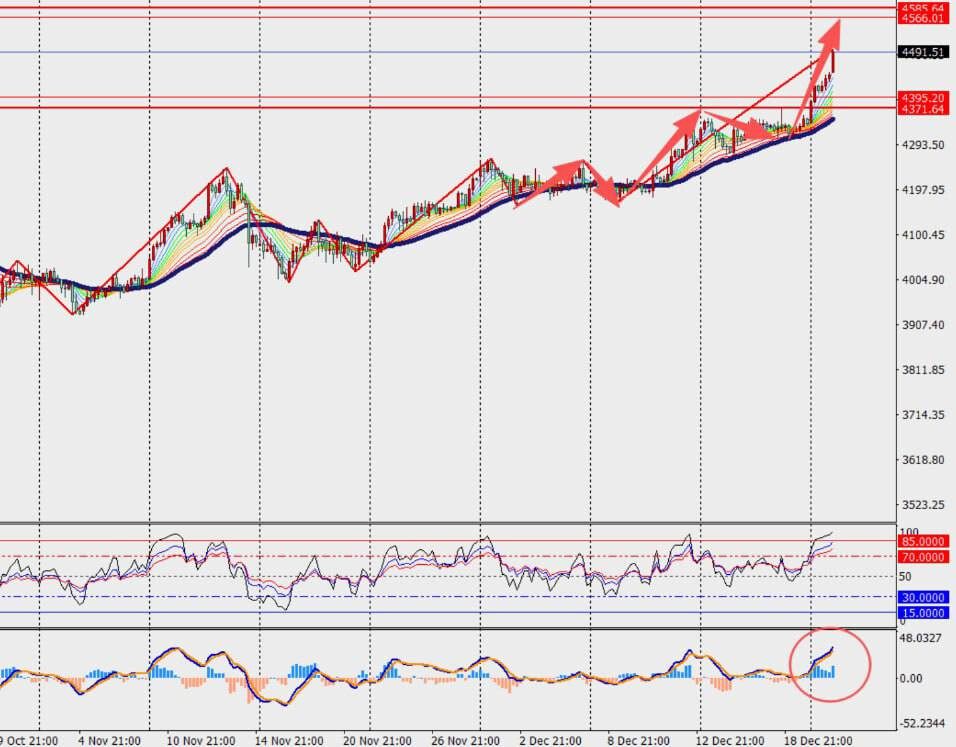
On the H4 timeframe, gold continues to trend higher above the 48-period bull–bear line, while MACD expansion near the zero axis signals strengthening bullish momentum. Further upside will depend on Fed easing, geopolitical risks, and global growth.
Support and Resistance Levels:
First Resistance: 4510.00 | First Support: 4473.00
Second Resistance: 4530.00 | Second Support: 4455.00
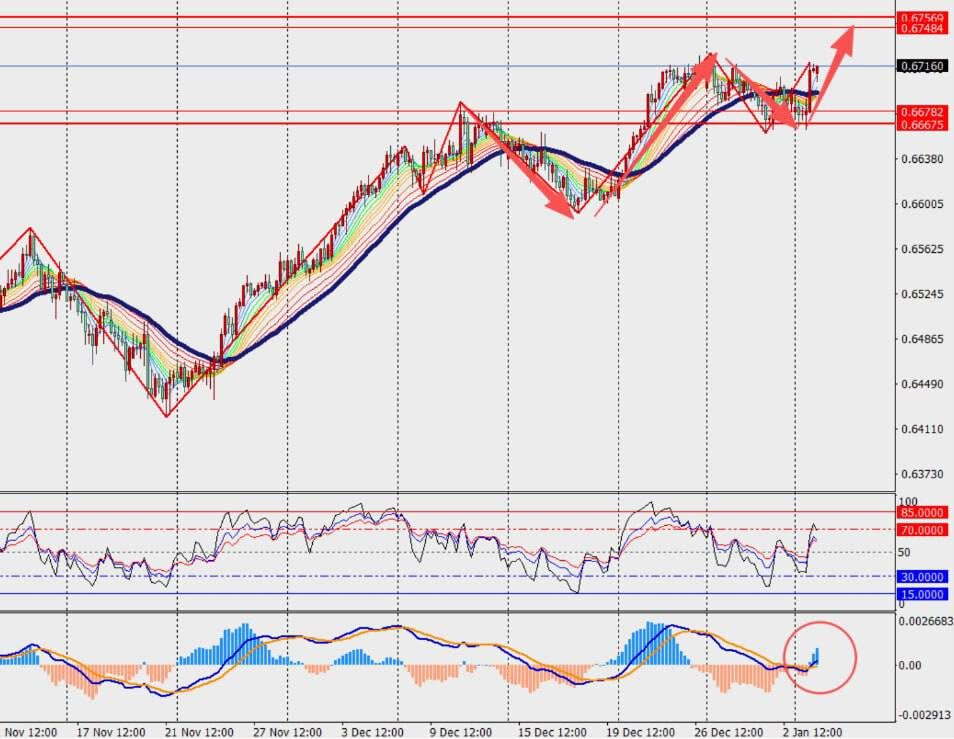
AUDUSD Analysis
Fundamental: Citi economists believe Australia’s inflation data could strengthen expectations for RBA rate hikes in February and May . The market is currently underpricing this risk, which may increase short-term bond sell-off pressure.
Technical: AUD/USD is moving in a range with a bullish bias on the H4 timeframe, trading above its equilibrium level. The MACD indicator is showing expanding momentum  . However, slower housing price growth could weigh on market sentiment
  .
.
Key Levels:
Resistance: 0.6760 – 0.6800
Support: 0.6670 – 0.6630
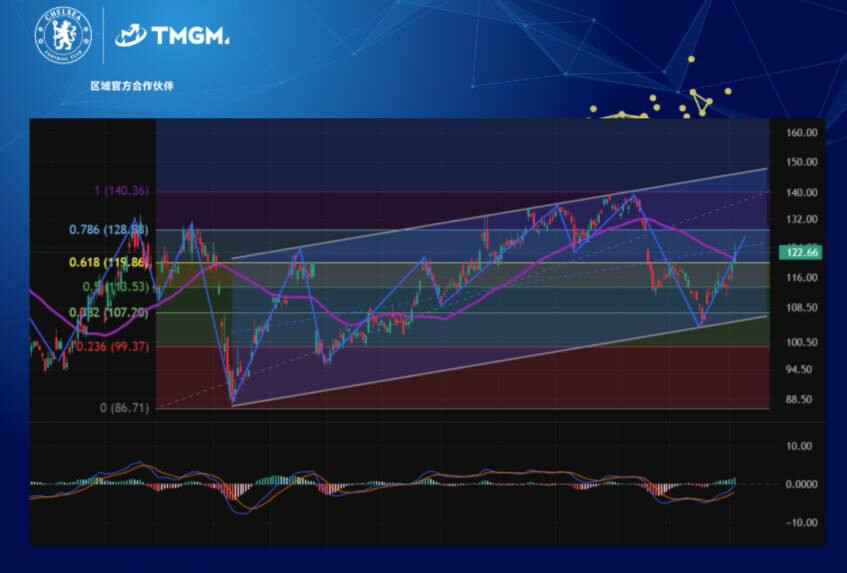
Trading Asset: Pinduoduo (NASDAQ: PDD)
Freedom Capital Markets has raised Pinduoduo’s price target from $140 to $170 and maintained its Buy rating. The stock is still considered undervalued, with some analysts setting targets as high as $201. This upgrade follows strong quarterly performance and the company’s successful adaptation to U.S. tariffs and tax policy changes.
Despite generating $58.8 billion in revenue and achieving 12.5% growth, margin pressure is expected to continue in the medium term; however, buying the stock around the $117 level could be an attractive opportunity.
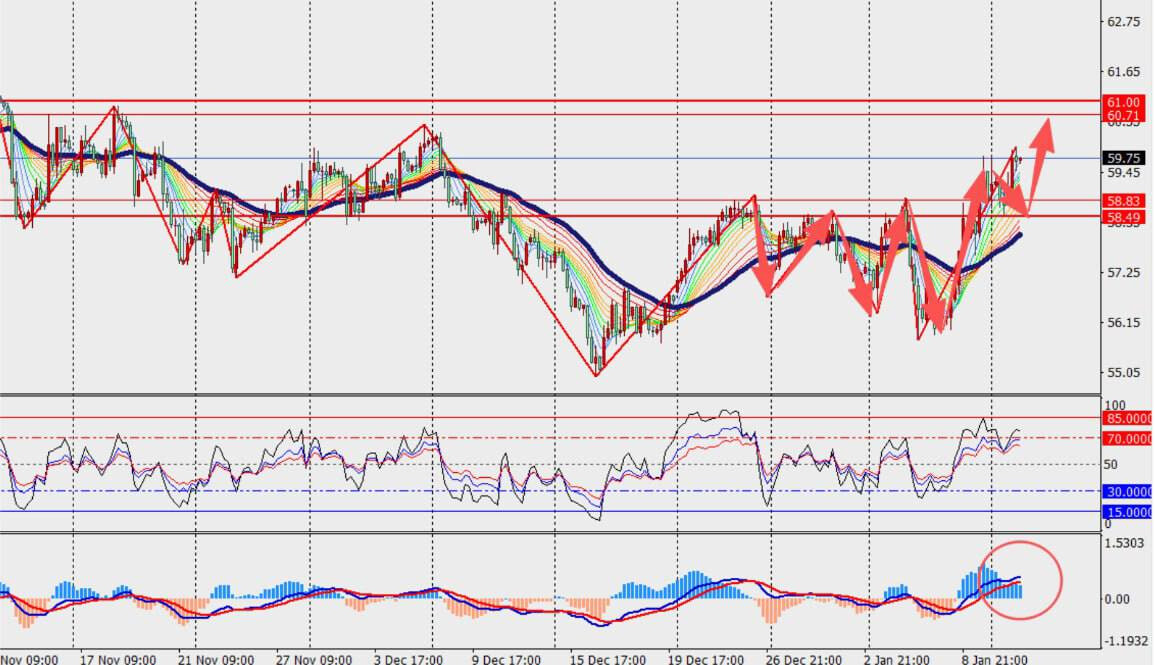
Daily Crude Oil Analysis
Crude oil prices rebounded on Monday amid escalating Middle East geopolitical tensions. Strong rhetoric from Donald Trump toward Iran and ongoing unrest in the country have increased concerns over potential supply disruptions, lifting the geopolitical risk premium. Markets remain wary of possible military conflict and wider regional instability.
Technical:
On the H4 timeframe, crude oil maintains an upward trend above the 48-period bull–bear line. However, MACD momentum is weakening near the zero line. Rising global inventories suggest that without major supply disruptions or OPEC production cuts, oil prices may face downside pressure in the longer term.
Resistance and Support Levels:
Resistance: 62.00 / 64.00
Support: 57.00 / 55.00
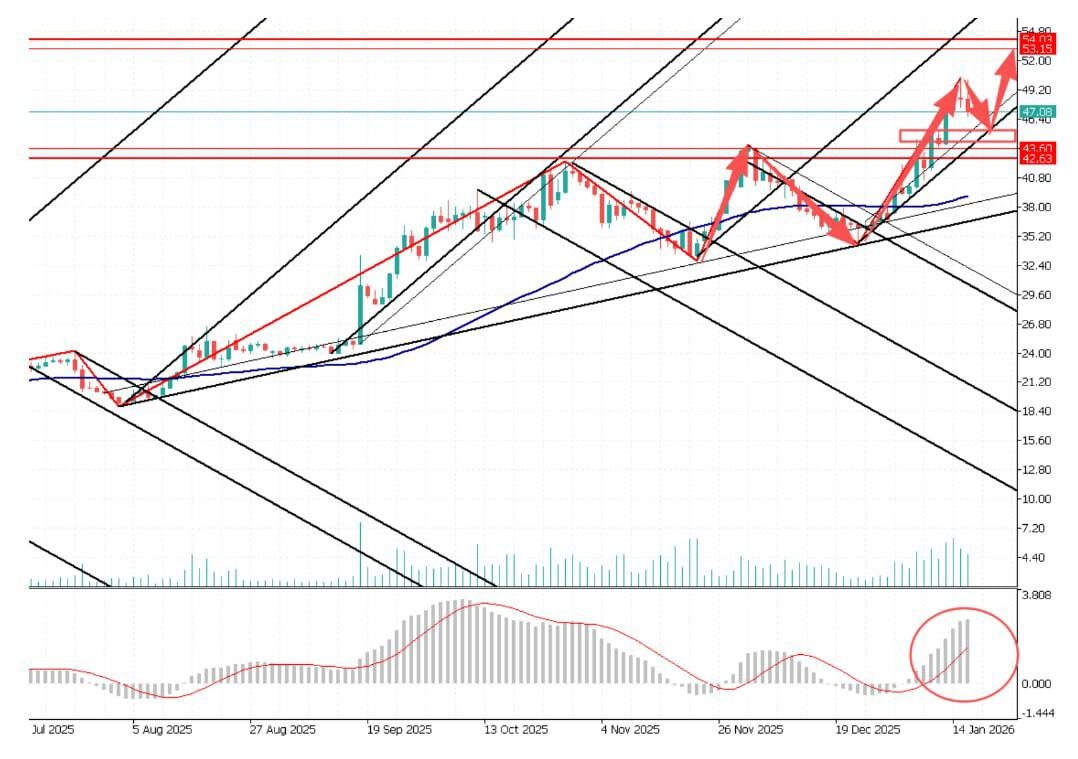
Intel’s Comeback Driven by the AI Wave
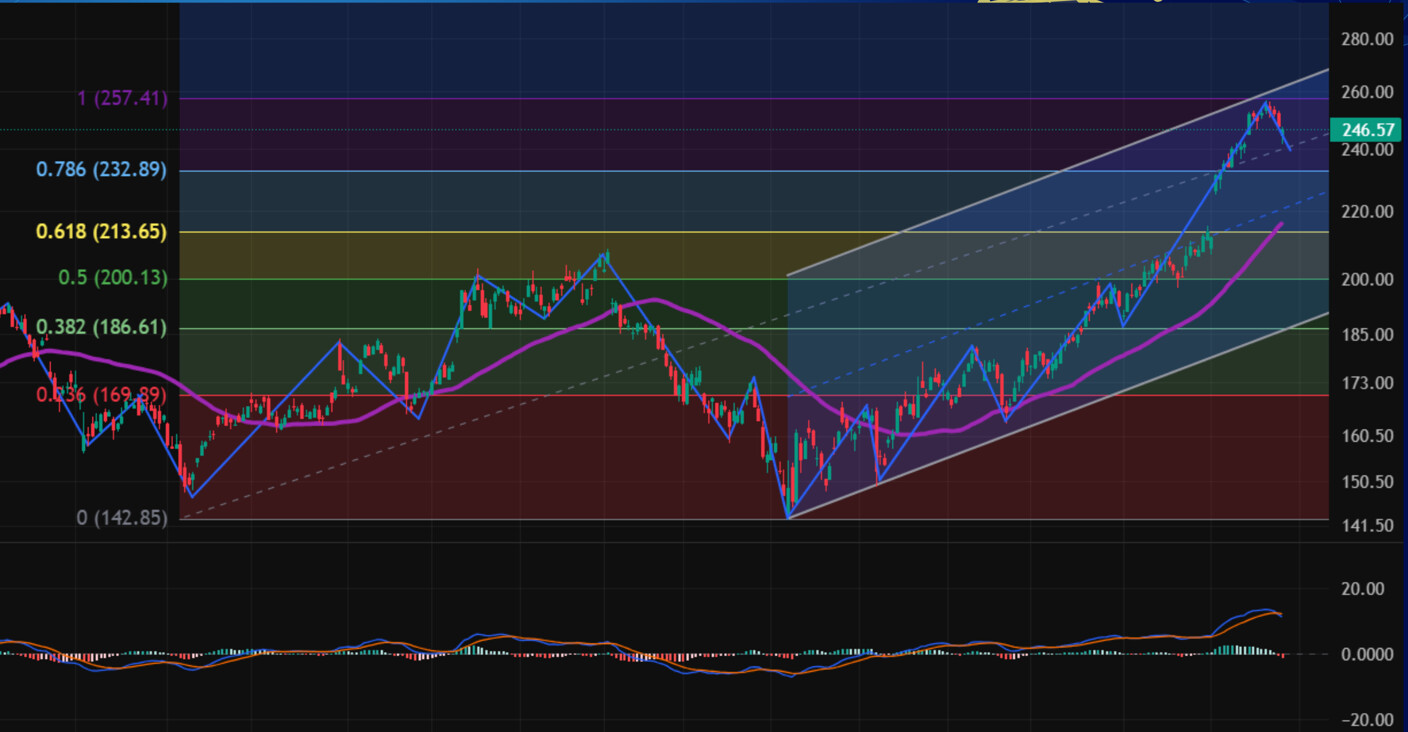
Intel shares have risen about 31% at the start of 2026, reaching their highest level in nearly two years. Investor optimism is driven by strong demand for AI chips and progress in Intel’s foundry business.
Advancements in Intel 18A technology have increased hopes that Intel could become the world’s second-largest contract chip manufacturer. The potential to attract major customers such as Apple, along with shortages in TSMC’s advanced capacity, is working in Intel’s favor. Support from the U.S. government and Intel’s geopolitical position are also seen as key strategic advantages.
Market Analysis
The next catalyst for Intel investors is likely next week’s earnings report. Based on analysts’ average forecasts, Intel’s revenue is expected to decline by about 1% in 2025, but could grow by 3% in 2026.

 Reason: Cooling expectations for Fed rate cut in December and strong US Dollar Index, Dollar rises → Dollar-denominated gold becomes more expensive for other currency holders → demand drops
 Fed comments:


 Gold’s main drivers:

 , support $3,900–$3,950