Trading Product: Google | NASDAQ: GOOG
With improvements in model quality, Google’s Gemini AI sales have experienced rapid growth over the past year.
According to Google’s internal data, usage of the Gemini API via Google Cloud has increased significantly.
API call volumes rose from around 350 billion at the launch of Gemini 2.5 to approximately 850 billion by August.
The release of Gemini 3 in November triggered a new wave of adoption and received positive feedback.
This growth is not only quantitative but has also led to improved product quality and higher profit margins.
Early Gemini versions were unprofitable due to heavy discounts, while newer versions have achieved positive margins.
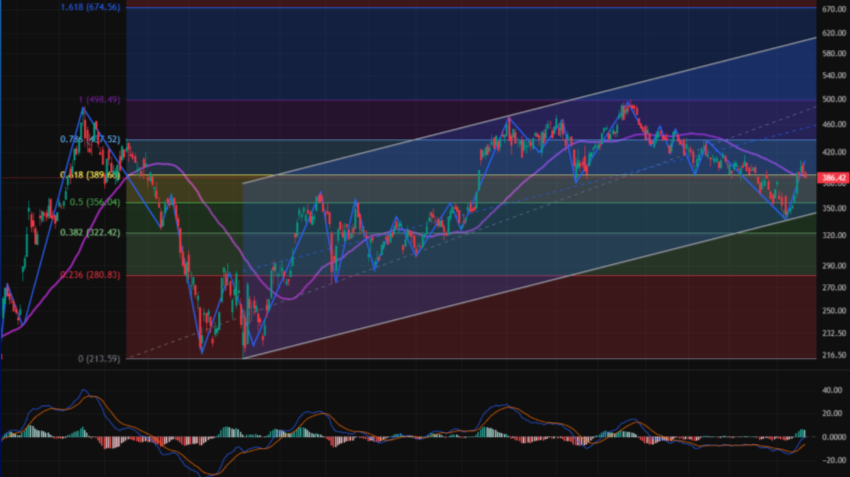
As a result, buying Google shares around the $317 price level can be considered.
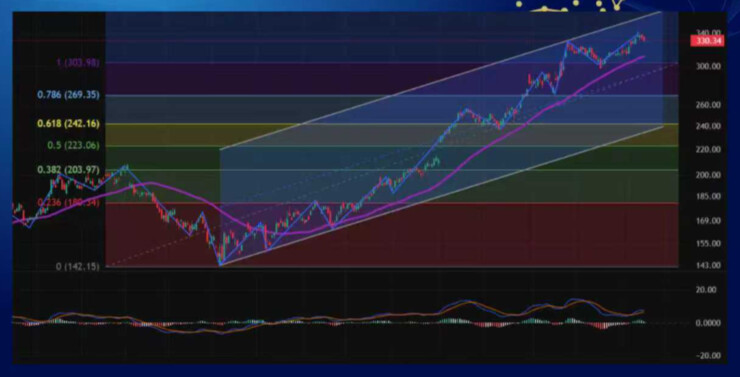
Fundamentals look solid. The jump in API calls (350B to 850B) proves that enterprise adoption is actually sticking, but the margin turnaround is the real catalyst here. Wall Street loves it when ‘money pit’ AI projects finally turn unit-positive. $317 looks like a clean technical entry - basically buying the breakout retest before the next leg up
Both the fundamentals and the price action are telling the same story — this move is driven by real profitability, not hype
Couldn’t agree more.
That convergence is rare. Usually, we have Price leading Fundamentals (Hype) or Fundamentals leading Price (Value Trap). Seeing them lockstep like this is the definition of a high-conviction trade. Good call on the API data leading the way.
Gold Daily Analysis
To quickly monitor gold purchases by central banks, investors refer to the UK’s foreign trade data.
As London is the world’s largest gold trading hub, the UK’s monthly non-monetary gold exports serve as a reliable indicator for estimating central bank gold buying.
Following the Russia–Ukraine war in 2022, central bank gold purchases have nearly doubled.
Technical:
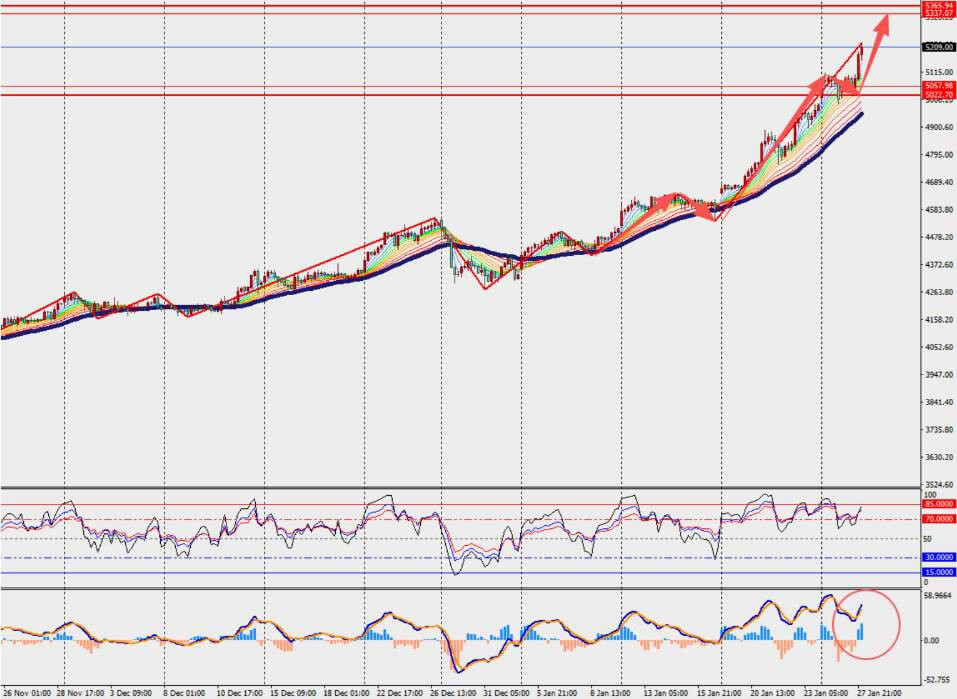
Gold remains in an uptrend on the H4 timeframe and is trading above the 48-period bull/bear line.Both the MACD lines and the histogram are strengthening above the zero line.
ETF fund flow data allows near real-time tracking of retail gold demand, while central bank demand remains difficult to quantify.
Resistance: 5227.00 / 5245.00
Support: 5190.00 / 5172.00
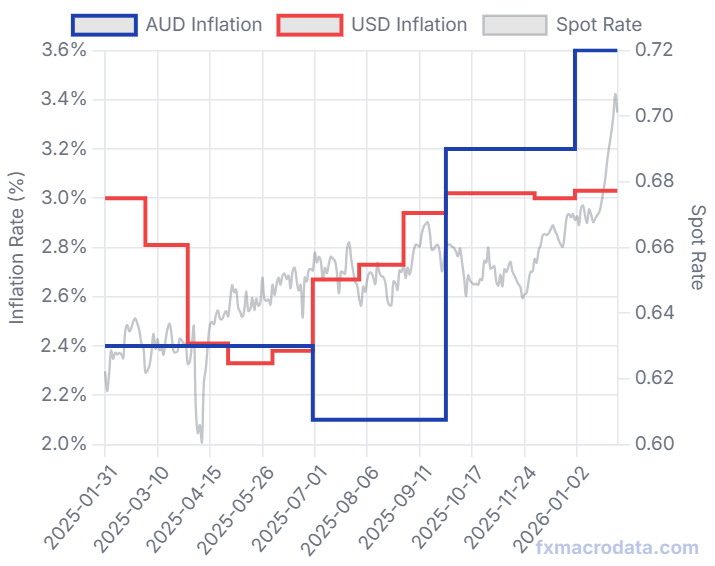
I noticed this as well, Australian inflation data seemed to have a definite impact on the recent AUD/USD increase.
Yes, every things depend on AUD…
That chart paints a scary picture for 2026.
If the blue line (AUD Inflation) is leading, it suggests the ‘inflation fight’ is far from over. That essentially puts a floor under Gold prices - hard to be bearish on XAU when fiat purchasing power is clearly starting to wobble again."
I am not waiting for bearish on Gold.
specially since I read an analyse that said Gold is more likely goes to 27,000 !!

Daily Oil Analysis
Fundamental:
Abundant global oil supply continues to keep prices under pressure, giving the U.S. greater flexibility in applying geopolitical pressure (including on Iran) without concern over sharp price spikes. Although Middle East tensions remain under close watch, fundamental factors are currently weighing on oil prices. Weak U.S. labor market data has also increased concerns about slowing economic growth in the world’s largest oil consumer.
Technical:
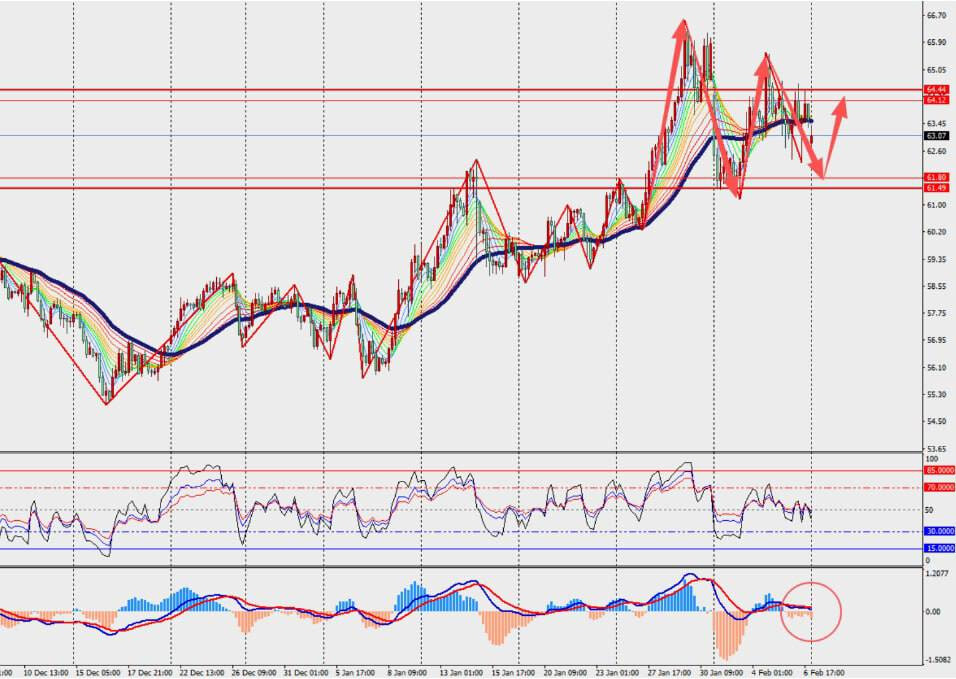
On the H4 timeframe, oil has entered a corrective phase after a decline and is trading near the 48-period balance line. MACD is hovering around the zero line, indicating the absence of a strong trend.
Key Levels:
Resistance: 66.00 / 68.00
Support: 61.00 / 59.00
Trading Product: Salesforce (NYSE: CRM)
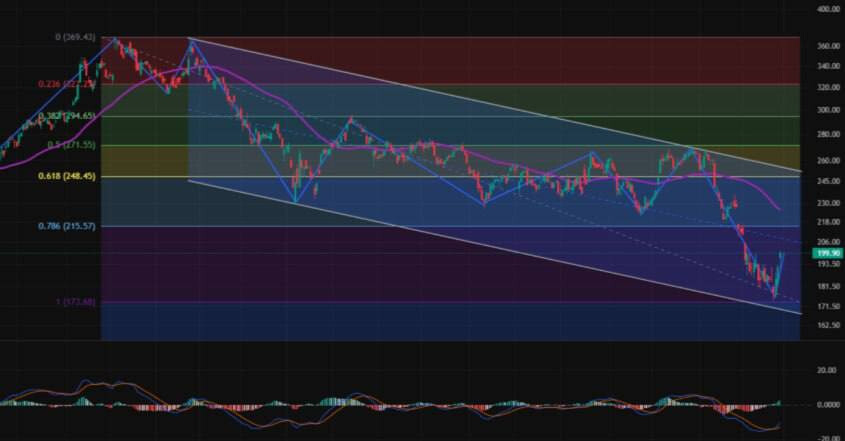
Salesforce (NYSE: CRM) reported continued double-digit revenue growth in its latest earnings report. Its AI product Agentforce is expanding rapidly, reaching $800 million in annual recurring revenue (ARR), up 169% year-over-year, with over 29,000 quarterly deals.
However, some analysts believe the company needs faster overall revenue acceleration. The report suggests considering a buying opportunity around $190.
Gold Remains Bullish Amid Geopolitical Tensions and Weak Dollar.
Following Ali Khamenei’s death, geopolitical risks and political instability have risen. U.S. and Israeli pressure on Iran is unlikely to ease soon, keeping regional uncertainty high and supporting gold.
Gold’s rally this year has also been driven by Fed rate cut expectations, a weaker dollar, and rising inflation concerns. Lower Treasury yields and ongoing central bank purchases provide additional support.
Escalating Middle East tensions may boost volatility in oil, gold, and silver, while pressuring global equities.
Technically, gold is in an uptrend on H4 (expanding MACD), but short-term volatility an[image]d pullback risk near recent highs remain.
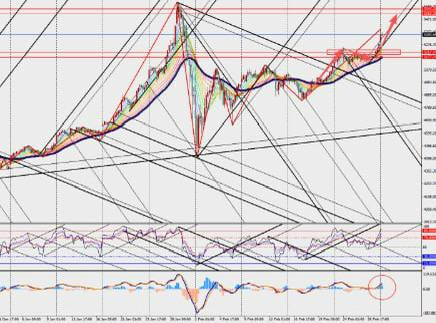
Trump’s suspension of strikes boosted market risk appetite, easing fears of Middle East energy supply disruptions. Falling oil prices can lower global inflation expectations by 0.2–0.4%, supporting gold pricing. Technically, gold H4 is oscillating below the 48-day moving average. MACD lines and volume bars expand below zero, showing ongoing support.
Resistance & Support:
First resistance: 4370.00 First support: 4330.00
Second resistance: 4390.00 Second support: 4310.00

Strong Dollar Pressures Gold;
Following the breakdown of U.S.–Iran negotiations and rising tensions in the Strait of Hormuz, the U.S. dollar has strengthened, putting pressure on gold. Despite geopolitical risks, higher interest rate expectations and a strong dollar have limited gold’s upside.
Technical:
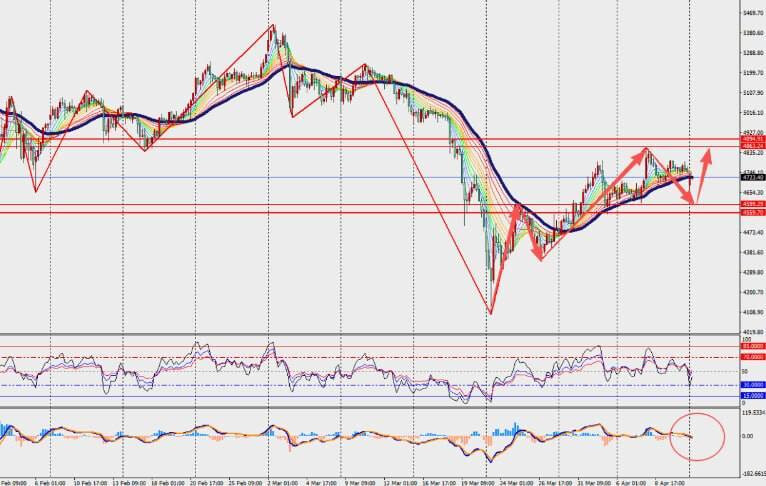
On the H4 timeframe, gold is in a corrective phase, trading near the 48-period equilibrium line. The MACD is also converging around the zero line, indicating weak momentum.
Resistance: 4740 / 4757
Support: 4700 / 4682
thanks for the insights
I appreciate how you don’t speak in certainties. Most people online just say ‘gold will pump 100%, invest everything now’.
You have a much more nuanced approach.
If you want engagement, thats not the best thing, but for good analysis, I think you’re doing very well.
There’s no such thing as 100% certainty in this market.
Given that I’ve been trading for many years and have a strong interest in this field, I like to share some of my analyses here so other traders can benefit from them.
Of course, we also offer services, and anyone who’s interested is welcome to get in touch to learn more or use them.
Morgan Stanley reaffirmed its Buy rating on Tesla (TSLA) with a $460 price target, maintaining a positive outlook driven by strong expectations for future growth. The firm highlighted Tesla’s progress in autonomous driving and Robotaxi development as key long-term catalysts for the stock.
Tesla is already operating Robotaxi services in cities like Austin and Dallas, and analysts suggest potential buying opportunities around the $377 level, reflecting confidence in the company’s role in the future of mobility.
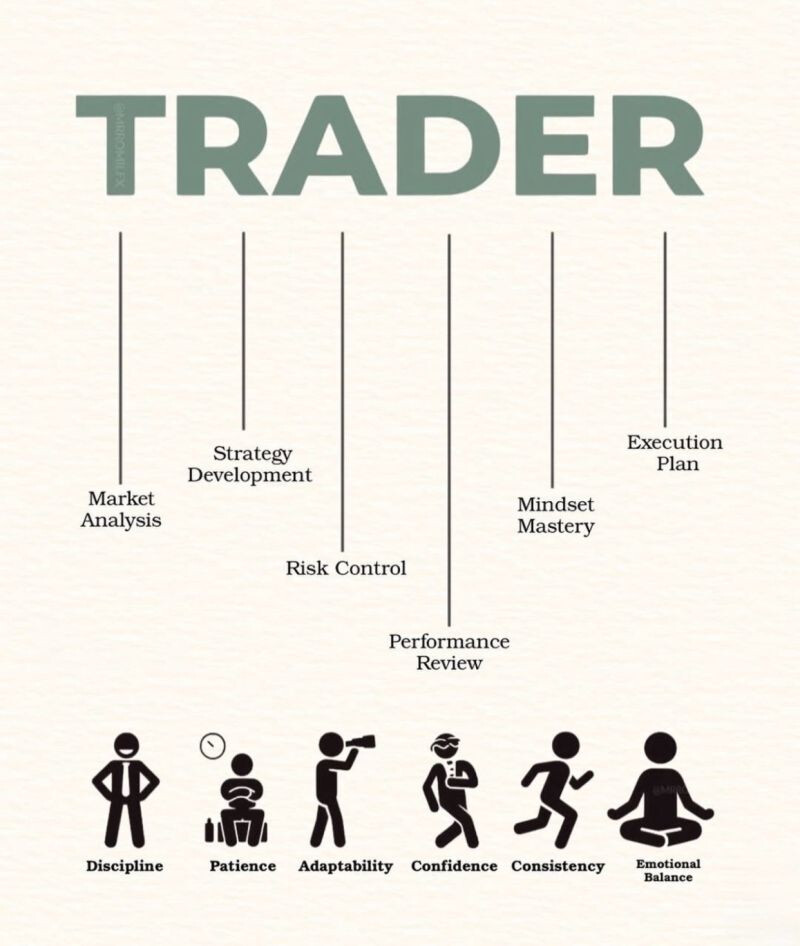
Which of these features do you have as a successful trader? In your opinion, which one is the most important?
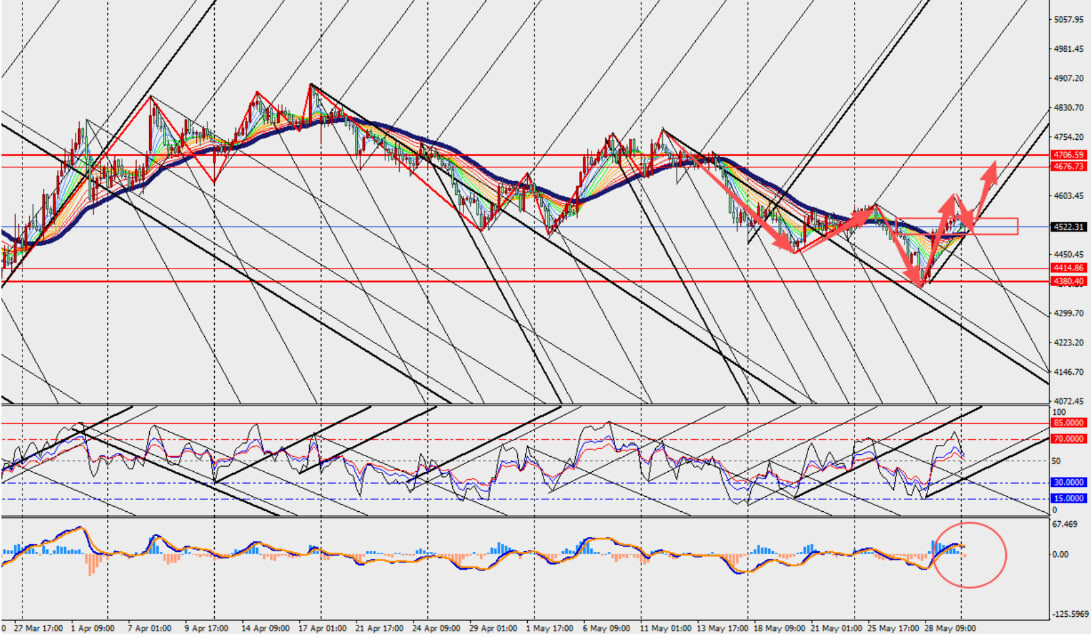
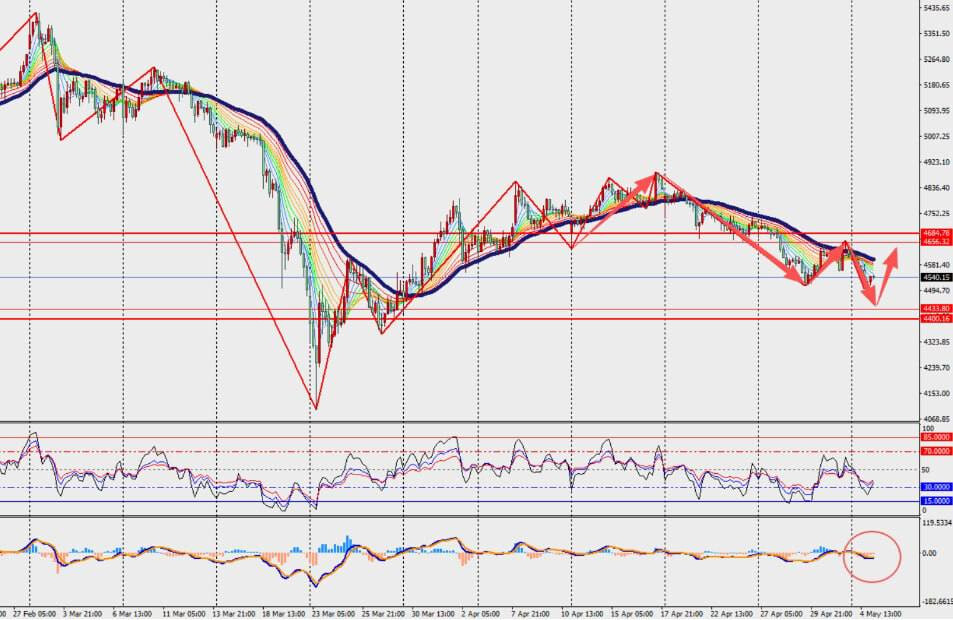
A 4% increase has strengthened expectations that interest rates will remain at elevated levels for longer, and at the same time, a stronger US dollar has made gold—priced in USD—more expensive for investors holding other currencies. TD Securities says recent news has once again increased inflation concerns and reinforced hawkish signals regarding interest rate policy. From a technical perspective, gold on the H4 timeframe has shown a corrective rebound after a decline but is still trading below the 48-period main trend. The MACD is near the zero line and converging, suggesting the market is currently indecisive. This week, key US data such as JOLTS job openings, ADP employment figures, and the April NFP report will determine the next direction for gold. Key levels: Resistance 4557 and 4575, Support 4522 and 4500.
Gold Market Overview: Sideways with Mild Weakness Amid Policy Uncertainty
Gold is currently moving in a sideways and slightly weak trend. Easing tensions between the U.S. and Iran have reduced safe-haven demand, while high U.S. interest rates continue to weigh on prices. Rising energy costs have also pushed inflation higher, supporting expectations that the Federal Reserve may keep rates elevated for longer.
Conclusion: Gold is in a consolidation phase, with its next direction likely driven by interest rate expectations and geopolitical developments.