Automated Trading Course - Part 3: Artificial Intelligence & 1000%-Robots

I had finally the time to complete my automated trading course, of which the first two parts were already posted here:

http://forums.babypips.com/expert-advisors-automated-trading/46881-automated-trading-course-part-1-programming.html

http://forums.babypips.com/expert-advisors-automated-trading/47032-automated-trading-course-part-2-strategy-design.html

The third and last part contains two lessons. It first explains how to use machine learning algorithms to detect profitable price patterns for automated price action trading. The last lesson is about programming a commercial quality trading robot with some impressive performance figures:

  • 95% win rate.
  • average 100 pips profit per day - guaranteed ;).
  • about 1000% annual return on capital.
  • verified by MyFXBook with 1 year live trading on a real account.

All code is included. The trading method used by this robot script has so far never been published as to my knowledge


For understanding the lessons you’ll need to know the first two parts of the course. If something is unclear please ask. I’ll post the final lessons here step by step in the next days.

2 Likes

I feel like there will be some sort of twist to this thread. Will be interested nonetheless. :slight_smile:

Zorro downloaded, thread bookmarked :slight_smile:

Bob: Quick, close the door! Maybe I’ve been shadowed.
Alice: What happened?
Bob: Someone just revealed the ultimate trading secret to me.
Alice: Really?
Bob: Yes. It’s a price action trading method. I need you to program this immediately.
Alice: Price action? What’s that?
Bob: You don’t use any indicators. You trade just when the price candle pattern is right. You compare the open, high, low and close of the last candle with the open, high, low and close of the previous candles - that’s the pattern. It’s all you need.
Alice: Hmm. I’ve read that the Japanese used candle patterns for trading the rice market. Some patterns got funny names like “Three Little Bears” or something like that. But that was 300 years ago.
Bob: Of course you won’t trade today with Japanese rice candle patterns if you want to keep your money. But I know a guy named Bert at McDuck Capital. He found some new candle patterns that work for the Forex market. He said that it’s like a slot machine that always wins. The pattern appears and cash comes out. Bert got a crazy bonus and McDuck is since then trading price action with his patterns.
Alice: So you want me to write a script that checks for those patterns and then triggers a trade signal? Should not be a problem.
Bob: Well, there is a problem. I don’t know the patterns. I only know that they are made of three daily candles. How they look is top secret. Bert said he had to kill me when he told me the patterns. McDuck is very serious in that matter.
Alice: Hmm.
Bob: Can’t you find out the patterns yourself?
Alice: If a guy at McDuck found them, I suppose I can find them too. But why do they work at all? I mean, why should a price move be preceded by a certain candle pattern?
Bob: No idea. But this method worked for the Japanese rice market. Maybe some big traders wake up in the morning, compare the prices of today, yesterday, and the day before, and then decide if they buy or sell in always the same way.
Alice: If this establishes a pattern, I can apply a machine learning function. It goes through historic prices and checks which candle patterns usually precede a price movement up or down.
Bob: Will that be expensive?
Alice: The search of candle patterns? No. Still, I’m afraid I’ll have to charge more than last time.
Bob: Why is that?
Alice: Risk fee. I might get killed when programming this script.

This is the first version of Alice’s script that uses machine intelligence for price action trading. It can detect a system in candle patterns, and then use the most profitable patterns for a trade signal.

function run()
{
  StartDate = 2002;   // use 11 years data
  BarPeriod = 24*60;  // 1 day
  NumWFOCycles = 5;

  set(RULES|TESTNOW); // generate rules, test after training
  if(Train) {
    set(HEDGING);     // allow long & short
    TimeExit = 5;     // 5 bars price movement
  } else {
    Stop = 500*PIP;   // large stop distance
    TimeExit = 10;    // twice the prediction horizon
  }
  if(adviseLong(PATTERN+2,0,
    priceHigh(2),priceLow(2),priceClose(2),
    priceHigh(1),priceLow(1),priceClose(1),
    priceHigh(1),priceLow(1),priceClose(1),
    priceHigh(0),priceLow(0),priceClose(0)) > 30)
    enterLong();
  if(adviseShort(PATTERN+2,0) > 30)
    enterShort();
}

For this script you’ll need the newest Zorro version, 1.10. If you have one of the previous versions, download the new one from the same download link.

When you did the first parts of the course, many lines in this code should be already familiar, but there are also some new concepts, especially the adviseLong and adviseShort functions. We’ll go through them in detail tomorrow.

The [B]advise[/B] function is the machine learning algorithm. It looks like a strange entry condition for a long trade:

[B]if (adviseLong (PATTERN+2,0,
priceHigh(2),priceLow(2),priceClose(2),
priceHigh(1),priceLow(1),priceClose(1),
priceHigh(0),priceLow(0),priceClose(0) ) > 30)
enterLong();[/B]

Alice calls [B]adviseLong [/B]with the [B]PATTERN[/B] method and the High, Low, and Close prices of the last 3 candles. If [B]adviseLong[/B] returns a value above 30, a long trade is entered. But when does this happen?

In training mode, the [B]adviseLong[/B] function always returns [B]100[/B]. So a trade is always entered. The function stores a ‘snapshot’ of its signal parameters - in this case, 12 signals from the High, Low, and Close prices of the last 3 candles - in an internal list. It then waits for the result of the trade, and stores the profit or loss of the trade together with the signal snapshot. Thus, after the training run Zorro has a long internal list containing all signal snapshots and their corresponding trade profits or losses.

The signals are then classified into patterns. Alice uses the [B]PATTERN+2[/B] classification method. It splits the signals into two equal groups, each with 6 signals. The first group contains the prices of the first two candles of the 3-candle sequence:

[B]priceHigh(2),priceLow(2),priceClose(2),
priceHigh(1),priceLow(1),priceClose(1)[/B]

And the second group contains the prices of the last two candles:

[B]priceHigh(1),priceLow(1),priceClose(1),
priceHigh(0),priceLow(0),priceClose(0)[/B]

Note that the middle candle, with offset 1, appears in both groups. The Open price is not used in the signals because currencies are traded 24 hours a day, so the Close of a daily bar is normally identical to the Open of the next bar. Using the Open price would emphasize outliers and weekend patterns, which is not desired.

Within every signal group, Zorro now compares every signal with every other signal. This generates a huge set of greater, smaller, or equal results. This set of comparison results classifies a pattern. It does not matter if [B]priceHigh(2)[/B] is far smaller or only a little smaller than [B]priceHigh(1)[/B] - the resulting pattern is the same. The patterns of the two groups are now glued together to form a single pattern. It contains all information about all price comparisons within the first and the second and within the second and the third candle, but the pattern does not contain any information about how the first candle compares with the third. Bert had told Bob that it’s best for price action trading to compare only adjacent candles - therefore the two independent pattern groups. If Alice had looked for 4-candle-patterns, she’d used three groups.

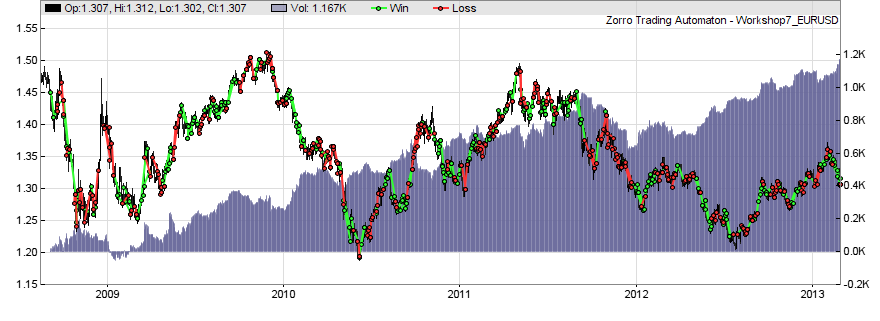
After the pattern was generated, Zorro checks how often it appears in the list, and sums up all its profits or losses. If a pattern appears often and with a profit, it is considered a profitable pattern. Zorro removes all unprofitable or insignificant patterns from the list - patterns that don’t have a positive profit sum or appear less than 4 times. The remaining patterns are stored in the [B]workshop7_EURUSD.rul[/B] files in the [B]Data[/B] folder - one file per walk forward cycle. Such a file looks like this:

// Prediction rules generated by Zorro
/* Pattern list for EURUSD_L
FCDEABFACEBD  25 4.334 11.562
FADEBCFACEBD   8 2.992 9.572
FACEBDECDFAB  19 8.289 9.673
ECDFABFBCEAD  21 3.263 10.264
FADEBCFCDEAB  27 1.641 13.833
FCDEABDBCFAE  10 6.041 16.218
DBCFAEEADFBC  19 1.207 12.651
EACFBDFACEBD  11 8.549 13.986
DACFBEEACFBD  29 2.534 16.527
FBDEACEADFBC   5 3.901 11.461
EADFBCFBDEAC   5 3.697 7.563
ECDFABFCDEAB  35 0.894 15.564
EACFBDDACFBE  22 6.782 23.896
...

We can see that any line in the list begins with a strange letter combination, like [B]FCDEABFACEBD[/B]. This combination is the unique pattern name that represents the set of comparison results. The number next to the name is the pattern frequency - [B]FCDEABFACEBD[/B] appeared [B]25[/B] times in the training period. Its average profit per trade was [B]4.334 $[/B], and the standard deviation of the profits was [B]11.562 $[/B]. The frequency, average profit, and standard deviation are later used by Zorro for calculating the pattern’s information ratio.

This happens when testing or trading the strategy. The [B]adviseLong[/B] function generates a pattern from the current signals, and compares it with the stored patterns in the [B].rul[/B] file. If no stored pattern matches the current one, the function returns [B]0[/B]. Otherwise it returns the pattern’s information ratio multiplied with [B]100[/B]. The higher the information ratio, the more profitable is the pattern. Of course, patterns with high information ratio are less frequent. So the trade entry threshold should be a compromise between pattern profitability and frequency. Alice used a threshold of [B]30[/B] here, meaning that a trade is entered for any pattern with information ratio above [B]0.3[/B].

Short trading just works the same way:

[B]if(adviseShort(PATTERN+2,0) > 30)
enterShort(); [/B]

The [B]adviseShort[/B] call has no signal parameters. In that case the function uses the same signals as the last advise call, which was the preceding [B]adviseLong[/B]. This way long signal lists don’t have to be written twice.

Tomorrow we’ll go through the rest of the script. Pattern recognition is one of the few machine learning functions that work for trading with a relatively simple setup. Don’t hesitate to ask if something is unclear with this method.

There are some prerequisites for pattern analysis - let’s look at the rest of the code:

StartDate = 2002;
BarPeriod = 24*60;
NumWFOCycles = 5;

NumWFOCycles or some similar out-of-sample test method is mandatory for this type of strategy. All machine learning systems tend to great overfitting, so any in-sample result from price patterns, decision trees, or preceptrons is meaningless.

Pattern analysis also needs as many bars as possible for finding significant patterns. Oversampling can not be used here because the High, Low, and Close prices depend on the bar start and end time - resampled bars would produce very different patterns. So Alice has to use the maximum possible simulation period, which is from 2002 when the EUR was introduced as replacement for the European currencies. (If price data from a certain year is not included in the Zorro program, it can be downloaded either automatically from the broker server, or with the historic price package from the Zorro download page).

For the same reason, Alice uses few WFO cycles for getting large training periods.

set(RULES|TESTNOW);

The RULES flag is required for generating price patterns with the advise function. TESTNOW runs a test automatically after training - this saves a button click when experimenting with different pattern finding methods.

The next code part behaves different in training and in test or trade mode:

if(Train) {
set(HEDGING);
TimeExit = 5;
}

Train is true in [Train] mode. In this mode the HEDGING flag is set, allowing to open long and short positions at the same time. This makes normally no sense, but is required here for training the patterns. Otherwise the trade entries after adviseLong / adviseShort would early close the opposite positions, and thus assign wrong profit/loss values to the patterns.

TimeExit ]limits the duration of a trade, in this case to 5 bars. So the profit or loss of a trade is always determined after 5 bars and assigned to the pattern that existed when the trade was entered.

The next part of the code is executed when Train is not true, i.e. in [Test] or in [Trade] mode:

else {
Stop = 500*PIP;
TimeExit = 10;
}

The system normally closes its position when an opposite candle pattern occurs. There are two other exit conditions: a relatively distant Stop - just for being on the safe side in case of a price shock - and a timed exit after 10 bars. The timed exit is used because of the prediction method. It uses 5-bar trades, so its prediction horizon is one week. Some time after the prediction horizon, in this case after two weeks, the price will most likely have lost any correlation to the price pattern from 10 bars ago. Keeping the trade open any longer makes no sense.

It’s often better to limit the trade time with a trailing method, for instance with TrailStep, but here a timed exit is used for simplicity’s sake.

Now what profit can we achieve with trading machine learned patterns?

Click [Train]. Depending on the PC speed, Zorro will need a few seconds for running through the five WFO cycles and finding about 100 profitable patterns in every cycle. Click [Result] for the equity curve:

Although the annual profit of about 90% seems not too impressive, the price patterns give us a relatively steady rising equity curve and very symmetrical results for long and short trading.

However there’s a method to more than double the annual profit from price action trading - and this method bears a danger. We’ll deal with that tomorrow.

I’ve got my “mask” and I’m in training to help Zorro!

That’s the spirit! Now let’s see what we can do to make Alice’s profitable price action trading system even more profitable. One way could be eliminating the weekend gap. When a profitable price pattern appears during the week and leads to a trade to be entered Friday, the weekend is between the pattern and the trade outcome. That might spoil the predictive power of the pattern, or make it at least less predictive than patterns that immediately precede trades. Let’s modify the script and prevent Friday trades:

if(adviseLong(PATTERN+2,0,
priceHigh(2),priceLow(2),priceClose(2),
priceHigh(1),priceLow(1),priceClose(1),
priceHigh(0),priceLow(0),priceClose(0)) > 30 and dow() != FRIDAY)
enterLong();
if(adviseShort(PATTERN+2,0) > 30 and dow() != FRIDAY)
enterShort();

The dow function returns the day of the week and can be used for establishing different trade behavior before and after weekends. [Train], [Test], [Result]:

The equity curve now looks definitely nicer, and likewise nicer is the 200% annual profit.

Improving a system this way bears a danger - especially when time, date, or similar ad hoc criteria are used for additional entry conditions. Who can say that the better profit is not just by chance, a result of overfitting? Sure, we’ve given a rational reason for not entering trades on Friday. However such a reason is quickly found in hindsight. The price action script just works better when Friday trading is prevented, and we supposed that this is because of the weekend gap. But we could use a similar argument for not trading on Monday. Preventing Monday trades however does not improve the equity curve. Why not? No one can really tell.

Some traders believe a certain asset should only be traded during its main market hours, because then the trading volume is highest and there are less outliers. Consequently, they trade the GBP/USD only during the London Stock Exchange business hours. Other traders believe that an asset must only be traded outside its main market hours, because then the markets are less effective. They trade the GBP/USD only when it’s night in London. Some strategies work better with the first method, some with the other - and accordingly their authors sometimes gave the first and sometimes the other explanation. Which one is right?

The more you develop strategies, the more you’ll realize that theoretizing about market behavior is futile. Only the test perfomance matters. But there are many traps that lead to overfitting and over-optimistic results. You can not always avoid those traps. But you should be aware that they are there.

Now a short summary of what we’ve learned in this lesson:

â–ș Daily candle patterns can have predictive power under certain circumstances.

â–ș The advise function generates trade rules with machine learning algorithms.

â–ș Out of sample testing is mandatory for AI based strategies.

â–ș HEDGING allows to open long and short positions at the same time.

â–ș TimeExit limits the duration of a trade.

â–ș The dow function returns the day of the week.

â–ș Be careful when improving a system with additional entry conditions.

Tomorrow we’ll start with the final lesson about programming a high-profit robot that outperforms practically all other commercial robots discussed on this forum.

What an amazing thread and awesome project. I have been searching for something like this for about 7 years now. I expended almost my entire life savings testing and trying out various trading strategies, options systems, speculating, I have tried it all. The modern investing world is just rife with nonsense, scams and lies. Even the brokers are out to get you these days. But there is something about your approach that has me very excited and this thread is nothing short of electrifying. I get the sense that you have found a way to rise above the nonsense and look at this problem from a very rational perspective. I am a career programmer and I also come from the 3D gaming community, perhaps that is why I am resonating with the design approach you have taken. Leveraging all the power of modern computer science along with solid trading theory, zero lag “signal processing”, price action and of course AI, great stuff! These are the methods I have ended up focusing on as well, simply because they are the only methods that show any promise of working over time and in the live markets where it is next to impossible for a retail trader to thrive. I feel a glimmer of hope rising up in me for the first time in months, for as anyone who really dives into the world of financial markets knows, there are dragons here and there is pain, but that is how we learn is it not?

Just wanted to chime in and offer my thanks and support for this project. Thank you for this tutorial, the Zorro project and for sharing your expertise with those who would listen. It is very much appreciated, maybe there is hope after all


Thanks for the kind words. Speaking of dragons, that will be the topic of the last lesson. It’s about not only achieving a good income with automated trading, but getting really rich ;).

Bob: May I ask you a personal question?
Alice: Ask whatever you want. If I answer is a different matter.
Bob: Are you an over honest person?
Alice: Hmm. If I recall our contracts, I charged you so far a total $ 75000 for about 100 lines of code. Does that answer your question?
Bob: Good. Forget about our past contracts. The thing is, I need your help now to get really rich.
Alice: Aren’t you rich already from trading my scripts?
Bob: Nope. I’m getting some good income, sure, but I’m not getting rich. I mean really, obscenely rich. I feel that for this I’ll need other methods. I thought about offering expensive trading seminars, but I’m not a good speaker. I could write expensive trading books, but I’m not a writer. So, my idea is to sell an expensive trading robot. I already have a name: “Forex Turbo Growth Pilot”. How does this sound?
Alice: You want me to program a scam robot? For ripping people off?
Bob: Psst. Scam, ripping off
 those are ugly words. Let’s say I want you to program a profitable robot. Profitable for me, that is.
Alice: And for its users? It does not matter if the robot really generates profit for them or not?
Bob: It must appear as if it would make them rich, but it needs not really do that. Otherwise I would naturally use it myself and would not sell it.
Alice: Well, that makes programming it sort of easier.
Bob: We only must let the robot look like a cash machine. I have already ordered the advertising: 95% win rate! 100 pips profit per day! 1000% annual gain! Confirmed with real trading! Your script must produce those figures. The equity curve must go straight up to the sky, and it must come from a year live trading - a backtest won’t do. Sad to say, people today are mistrustful. They won’t buy a robot that has no excellent trading history verified by MyFXBook or some other trusted service.
Alice: So I have to program a robot that needs not be profitable, but nevertheless has 95% win rate and produces 100 pips per day on a real account?
Bob: You got it. Can you do that?
Alice: Sure. Piece of cake.
Bob: But I guess you’ll still charge an outrageous fee?
Alice: I have to. This job will give me a guilty conscience. And that must be financially compensated.

jcl365,

I’m a little slow sometimes. What are we supposed to get from Bob wanting to be a scammer?

Do you mean we should learn to code for ourselves and not “buy into” folks offering “get rich” programs?

Understanding how system sellers do it will help traders steer clear of these marketers who in fact have little to no experience in trading. It gives you the knowledge to understand how those con-artists are actually doing it and why the adage “if it’s too good to be true, then it probably is” holds true.

Yes. On this forum are many commercial robots discussed, so obviously some traders really believe that such a robot can generate money for them. A honest robot is theoretically possible of course. But it would not sell well, because its trade characteristics, such as low win rate and large drawdown, would not meet the expectation of people who buy robots. Therefore robot vendors have no interest in selling robots that really work because they get better reviews and earn much more with scam robots. I think almost all commercial robots are 100% scam.

If you know how a robot works, you’ll be able to see the clear scam hints in a robot’s equity curve. Some robots are programmed very well and can not at a first glance be identified as scam, but this is probably not the case for most robots discussed on this forum.

Aside from that, programming a scam robot is an excellent exercise in statistics, profit distributions, and risk and money management. So the knowledge of scam robots can help a great deal with programming real strategies.

A scam robot script works in a very different way than a normal trading strategy. The least important part of the script is the trade signal algorithm. Most robots use here some simple indicator-based strategy like the systems found posted on trader forums. The robot developer usually knows that it won’t generate profit, but this doesn’t matter for reasons that will soon become clear. Alice decided for an even simpler approach - this is her first version (fee: $44,000):

function run()
{
  if(random() > 0)
    enterLong();
  else
    enterShort();
}

The strategy enters a random trade on any bar. The random function will in 50% of all cases return a number that is greater than 0, therefore triggering a long trade; otherwise it will trigger a short trade. If trading had no cost, this strategy had an expectancy of zero. A click on [Test] however reveals an average loss of about 3 pips per trade. 3 pips are just the simulated broker’s spread, the Ask-Bid price difference that is always lost. So no surprise here.

This random trading script is obviously not profitable. Alice has to pimp it up. The first step is setting up some system parameters and fulfilling Bob’s demand of the 95% win rate:

function run()
{
  BarPeriod = 1440;
  StartDate = 2012;
  NumYears = 1;
  LookBack = 0;
  set(PLOTNOW);
  
  Stop = 200*PIP;
  TakeProfit = 10*PIP;
  
  if(NumOpenTotal == 0) {
    if(random() > 0)
      enterLong();
    else
      enterShort();
  }
}

The robot shall trade once per day, so Alice needs a 1440 minutes bar period. Backtest is restricted to simulate the year 2012 - the robot must work for one year only, so a longer backtest is not required. It also uses no lookback period, as there’s no indicator or other function that would need any price history. Therefore, this is the parameter setup:

BarPeriod = 1440;
StartDate = 2012;
NumYears = 1;
LookBack = 0;

The next lines set a stop loss at 200 pips distance from the current price, and a profit target at 10 pips distance:

Stop = 200PIP;
TakeProfit = 10
PIP;

This way the profit target will be hit 20 times earlier than the stop loss - meaning that it will be normally hit 20 times more often. From 20 trades, 19 will be won and only one will be lost - this is the 95% accuracy that the robot need for matching Bob’s advertisement.

However, for this Alice must make sure that any trade ends with hitting either the stop loss or the profit target. Any other exit would spoil the 95%. An other exit happens when entering a trade in reverse direction, which automatically closes the current trade. One method to prevent this would be setting Zorro’s HEDGING flag. Hedging however is not allowed to US citizens, who are the main buyers of robots. For not losing the US market, Alice prevents trade reversal by only entering a new trade when no trade is open:

if(NumOpenTotal == 0) {
if(random() > 0)
enterLong();
else
enterShort();
}

The predefined variable NumOpenTotal is the current number of open trades.

A click on [Test] reveals that the current script version has indeed about 95% win rate. Of course this does not improve its profitability. Although 19 out of 20 trades are won, the loss from the 20th eats all the profits from the 19 winners before. The only effect of the high win rate is now a strange sawtooth pattern in the equity curve:

We can see that sequences of winning 1-day trades cause parts of the equity curve to raise linearly up to the point where a trade is not hitting the profit target at the same day. This trade will stay open for a longer time, possibly hit its stop loss, and spoil the equity curve. Profit-wise the system is no better than the version before.

But Bob wants 100 pips profit per day. Assuming 250 trading days per year, that means an annual return of at least 25,000 pips - enough to arouse expectation of great wealth and sell lots of robots. Can Alice adjust the script to generate 100 daily pips - real profit, from live trading - and this with an obviously unprofitable strategy?

Yes, she can. It’s the magic of statistics, into which we’ll look tomorrow.

Pretty accurate conversation. I was contacted by someone on the MQL4 forums who randomly wanted me to program (I can’t program) an EA that made 100-200% in a month - he mentioned it didn’t matter if it blew up.

Ah, I knew that the scam robot vendors are always looking for programmers!

Ok, let’s find out how to make a profit with random trading. The average loss of a random trade is the spread or commission. Thus, one trade per day and 3 pips spread will produce a 750 pips average loss per year. This does not mean that every random trader will get 750 pips loss by the end of the year. Some might end up with a larger loss, some even with a profit. Let’s give 3000 traders some initial capital and the task to enter random trades, one trade per day, for one year. At the end of the year we’ll put together their results in a statistics chart. It will look like this:

This profit distribution chart can be generated with the script described below. It runs 3000 1-year simulation cycles of Alice’s first random trading strategy. The x axis of the chart displays the profit or loss in pips at the end of the year. The y axis shows the number of traders that got that particular profit or loss. We can see that the largest group - about 130 traders - had 500 pips loss after a year. There are also some unfortunate traders with more than 7000 pips loss, but on the other hand, far on the right side of the chart, a few made more than 7000 pips profit! No doubt, those guys are considering themselves genius traders and are bragging with their success on trader forums


This profit distribution is a [B]Gauss Normal Distribution[/B] - the famous “Bell Curve”. It looks a little ‘shaky’ because 3000 samples are not enough for a perfect bell. When running the simulation with many more traders, the curve will get more regular, but the script will need more time to run. The peak of the bell curve is at -750 - the average loss to be expected with 3 pips spread per trade.

You can generate those profit distribution charts with the following script:

function strategy1()
{
  if(random() > 0)
    enterLong();
  else 
    enterShort();
}

function run()
{
  BarPeriod = 1440;
  StartDate = 2012;
  NumYears = 1;
  LookBack = 0;

// run this simulation 3000 times  
  NumBarCycles = 3000;
  strategy1();  

// plot the result of every run in a bar graph  
  if(is(EXITRUN)) {
    int Step = 250;
    int Result = floor((WinLong+WinShort-LossLong-LossShort)/ PIPCost / Step);
    plotBar("Profit",Result+40,Step*Result,1,SUM|BARS|LBL2,RED);  
  } 
}

Alice’s strategy is now called as an external function [B]strategy1[/B] - that’s not really necessary, but makes it easier to experiment with different strategies. Some commands in the script are new. We’re using oversampling to run the one-year simulation many times:

[B]NumBarCycles = 3000; [/B]

Oversampling is normally used for increasing the number of trades in a simulation. Here the purpose is just to repeat the simulation 3000 times, one simulation cycle per trader.

[B]if(is(EXITRUN)) { 
 [/B]

[B]EXITRUN [/B]is a Zorro status flag that is set on the last run of every cycle, at the end of the year. [B][B]is(EXITRUN)[/B][/B] then becomes true and the following lines are executed:

[B]int Step = 250;
int Result = floor((WinLong+WinShort-LossLong-LossShort) / PIPCost / Step);[/B]

[B]WinLong+WinShort-LossLong-LossShor[/B]t is the result of the current simulation cycle. We can not use [B]WinTotal-LossTotal[/B] as in workshop 6, because the [B]
Total[/B] values are summed up over all cycles. We divide the result by [B]PIPCost [/B]for converting it to pips. We divide it further by 250 (the [B]Step [/B]variable) for distributing the results among 250 pips wide bars. If a result is 1 pip or 249 pips does not matter - both contribute to the same bar. The [B]floor [/B]function converts the resulting value to an integer that we can plot in a chart. For this the [B]plotBar [/B]function is used:

[B]plotBar(“Profit”,Result+40,Step*Result,1,SUM|BARS|LBL2,RED);[/B]

This draws a bar in a graph named [B]“Profit”[/B] at chart position [B]Result+40[/B]. The chart always begins at position 0, so the [B]+40[/B] has the effect to shift it to the right and allow negative results to be also visible. The x axis value belonging to that bar is [B]Step*Result[/B]. We had divided the result by [B]250 [/B]for the distribution among bars, so this multiplication lets the bar’s pip value appear on the x axis below the bar. The [B]1 [/B]is the height of the bar. The height is summed up ([B]SUM[/B]), so the bar height increased by [B]1 [/B]for every cycle whose result matches the bar’s pip value. [B]BARS [/B]tells the [B]plotBar [/B]function to plot bars instead of a line, and [B]LBL2 [/B]tells it to print only every 2nd value on the x axis - otherwise it would be hard to read. The last parameter, [B]RED[/B], gives the color of the bar.

You can see that the resulting chart above also debunks a widespread myth in the trader scene. It is a “known fact” that 95% of all private traders lose all their money already in the first year. Not true - at least not with random trading. You can estimate from the profit distribution that only about 55% lose money at all (the sum of the red bars with negative profit), while 45% end their first year with a profit. Of course, most of those lucky 45% will then lose in one of the following years when they continue trading - but it would take 5 years until 95% have lost their money!

Tomorrow we’ll see how Alice can manipulate this profit distribution for ending the year with 25,000 pips profit.

What happens to the profit distribution when Alice uses her stop and profit targets for getting the 95% win rate?

Just edit the script posted above and replace the [B]strategy1()[/B] call with [B]strategy2()[/B], which is the stop/takeprofit version:

function strategy2()
{
	Stop = 200*PIP;
	TakeProfit = 10*PIP;

	if(NumOpenTotal == 0) {
		if(random() < 0)
			enterShort();
		else 
			enterLong();
	}
}

The resulting profit distribution:

The bell peak is still at -750 pips, but the distribution is now much more narrow and a little distorted towards the left side. Restricting trades with stop and profit targets eliminates large wins and large losses. This puts upper and lower limits to the annual result, thus ‘squeezing’ the bell from both sides. With 10 pips profit target, no trader can earn more than 1750 pips per year even in the unlikely case that all trades are won.

However, Alice needs an annual result of at least 25,000 pips. She can do nothing about the average 750 pips loss. But she can manipulate the profit distribution curve in a way that a large number of traders end up with 25,000 pips. For this, Alice just adds 3 more lines to her strategy:

[B]var ProfitGoal = 100BarPIPCost;
var ProfitCurrent = WinLong+WinShort-LossLong-LossShort;
Lots = clamp((ProfitGoal-ProfitCurrent) / (7*PIPCost), 1, 200);[/B]

This is a martingale system. Such systems are used, more or less hidden, in most robots. At first Alice determines a profit goal. She needs 100 pips per day. A day is equivalent to a bar, so at any bar the accumulated profit should be 100 pips times the bar number. This is multiplied with [B]PIPCost [/B]for getting the result in account currency instead of pips, and stored in the [B]ProfitGoal [/B]variable.

The current profit is then calculated in the next line and stored in the [B]ProfitCurrent [/B]variable.

The third line is the martingale. The lot size is set dependent on how much the current profit deviates from the profit goal. If we’re far below our goal, we need a huge lot size to catch up. The number of [B]Lots [/B]is calculated just so that the next winning trade reaches the profit goal. For this, the profit difference is divided by the expected profit per lot. The profit per lot of a winning trade is 10 pips profit target minus 3 pips spread. The result, [B]7 [/B]pips, is again multiplied with [B]PIPCost [/B]for converting it to account currency.

The [B]clamp [/B]function limits [B]Lots[/B] between 1 and 200. We need at least 1 lot per trade, and we don’t want to exceed 200 lots for not being too obvious or risking crazy losses. When analyzing robot strategies, one can notice such a martingale system from telltale peaks in the lot size. For this reason, robots or signal providers often increase not the number of lots, but the number of trades, which is less suspicious.

If you select the modified strategy script and click [Test] repeatedly, every click will now generate a different equity curve. Most look like this:

But surprisingly many look like this:

This is just the perfect equity curve that Bob wanted for his robot. It’s even a little too perfect - its straight slope comes from the ProfitGoal variable that just linearly increases with the bar number. For really selling the robot, Alice had to modify the profit goal formula for letting the curve appear more bumpy and realistic. We leave that as an exercise to the reader. Let’s now copy the modified strategy in our profit distribution script, for determining the profit distribution (change Step to 2500 for getting a larger scale):

This distribution does not resemble a bell curve anymore. Although the average loss is still at -750 pips, the distribution got an extremely long left tail (the high bar at the left end just represents the sum of all bars that don’t fit on the chart) and a sharp peak at the right in the 25,000
30,000 pips profit area. From our 3000 traders, about 1100 will earn more than 25,000 pips with this robot! Sadly, about 1600 traders will suffer losses, some even extreme losses in excess of 200,000 pips. But we hope a merciful margin call saves them early.

The profit distribution chart is a little misleading. In fact the year won’t end with 1100 lucky traders. Many of them will have bitten the dust before, because their equity curves, although reaching the 25,000 pips goal at the end, would go through extreme drawdowns inbetween and wipe out their account. Let’s see how many traders will encounter no margin call and reach the end goal smoothly. For this, edit the script again and modify the trade entry condition from

if(NumOpenTotal == 0) { 


to

if(NumOpenTotal == 0 and ProfitCurrent > -250) { 


Every trader will now refrain from further trading when his loss exceeds $ 250. This changes the profit distribution remarkably:

About 500 traders now gave up on the way, visible in the high peak of the -5000 pips bar that represents the $ 250 loss on the simulated micro lot account. The loss can be of course higher when the last losing trade had a high lot size - that’s why many bars are even beyond -5000 pips. Anyway, 600 traders still reached the 25,000 pips end goal - and this with totally random trading!

So Alice now has a script that indeed generates more than 25,000 pips per year. There’s a slight problem though - it only works for 20% (600 out of 3000) of its users. Most of the remaining 80% will also earn profits in the first months due to the martingale system and the high win rate, but will have lost all their money by the end of the year.

Bob will mercifully not mention this in his robot advertisement - but he needs something else instead. For selling the robot, at least one of those 600 profitable equity curves has to be verified on a real account by a trade verification service. For this purpose Bob will invest $10,000. Not, as you might think, for bribing the service to confirm a fake curve. No, they are certainly honest guys and won’t accept bribes


The $10,000 are used in a different way, which we’ll describe tomorrow.

Bob’s next steps:

â–ș Get the script from Alice. Pay her fee.

â–ș Open 20 trading accounts, each with $250 deposit.

â–ș Register the accounts with a trade recording service such as MyFXBookℱ.

â–ș Start the scam robot script on all accounts.

For financing the 20 accounts, Bob invests half of his $10,000. The money is not lost. A large part of it can be recovered later. But first Bob needs strong nerves, as the $250 deposit leaves not much room for drawdowns. Most of the 20 accounts sooner or later go down with a margin call. No problem: for any wiped account, Bob just opens a new one with $250, until the rest of the $10,000 is spent.

Now Bob has to wait a year.

$10,000 allow running 40 accounts simultaneously. If the equity curve of any account does not look good, even if the account is in profit, Bob just closes it and opens a new one. After a year, Bob has only 8 accounts left, but any one with at least 25,000 pips profit and no disturbing margin call. Because the accounts had been started with only $250 deposit, MyFXBook has given them all an impressive annual gain rate of more than 1000%.

Bob keeps the account with the smoothest equity curve and closes the rest. A large part of his $10,000 is thus recovered and goes back on Bob’s bank account.

Now Bob has the verified equity curve that he wanted, and can start advertising and selling his robot. And the money comes rolling in, and he gets obscenely rich. And he retires from trading and just lives from his robot sales happily forever after. And when his robot won’t sell anymore because too many people lost their money with it, he has already 8 new robots on standby.

The above equity curve was generated by a real commercial robot that is currently quite popular in the trading scene and got enthusiastic reviews from robot websites and traders. We won’t tell the name of this robot, and we’re not suggesting that it is scam. It can be a unique example of a honest robot. Only a little curious is the fact that the account was started with only $250 deposit. Or that the lot size - the green bars - grew large peaks whenever the equity went down, just like a martingale system. Or that the equity curve raised straight with relatively constant slope in its first part, but suddenly - after the robot was advertised and started selling - got very shaky with large losses. Really strange. Shame upon him who thinks evil upon it!


The purpose of the workshop was not to learn ripping off other traders. It just should make you aware of a typical phenomenon in the trading scene. Are all commercial robots 100% scam? This is hard to tell. A honest robot is certainly possible, but it would not sell well: the expectations of robot buyers require high win rates and martingale systems. Both are incompatible with long-term profit - even when a profitable trade algorithm is used. Therefore, vendors have no interest in selling robots that really work, even if they knew how to program them. They get much better reviews and more sales with scam. If you know how such a robot works, you’ll be able to see the hints in the equity curves and performance figures. Few robots are programmed so good that they can not be identified as scam at a first glance.

Ok, this was the final lesson of my tutorial and if you followed it so far I hope I got you interested in automated trading. Not with scam robots but with your own strategies of course. Strategy development is great fun. If anything was unclear from the tutorial or if anything does not work when you do it yourself with Zorro, just post here and I’ll try to help.