Best Forex Trading Indicators of all Time

As a forex trader, most of the common scenarios are how much you earn? And the answer is probably the most ideal. So, I want to share something that I feel it’s good to know for all.

Forex Trading Indicator

Yes, it is the most possible important thing in forex. Every forex trader must be known about it. And how to utilize the best trading indicators is also important. So, let’s make it easy–

1: Moving Averages

Many forex traders use moving averages of 1 type or another to get a sense of the underlying direction or trend of the market. Using 1 or more moving averages can also be used to provide trading signals, such as when a shorter-term moving average crosses above or below a longer-term moving average.

The 4 fundamental types of moving averages that forex traders frequently use in trading currency pairs and for general technical analysis purposes are:

Simple moving averages
Exponential moving averages
Weighted moving averages
Smoothed moving averages

The averaging process used can be performed on the high, low, open, or closing exchange rates. The close is the most popular.

2: The Relative Strength Index

The RSI was the brainchild of the famous technical analyst J. Welles Wilder and has been used by traders since first being published in 1978. It now holds a top position among the technical indicators used by traders, and most technical analysis software includes it.

You can compute the RSI indicator by comparing the amount of a currency pairs’ most recent exchange rate increases to that of its most recent exchange rate drops. The RSI has an adjustable time period parameter and most traders use the default 14 periods based on Wilder’s preference.

Technical analysts refer to the RSI as a bounded oscillator, since it fluctuates inside a range bounded by an upper value of 100 and a lower value of 0. Since its value does not have the same vertical scale as the exchange rate, the RSI is typically displayed below the exchange rate as an indicator box.
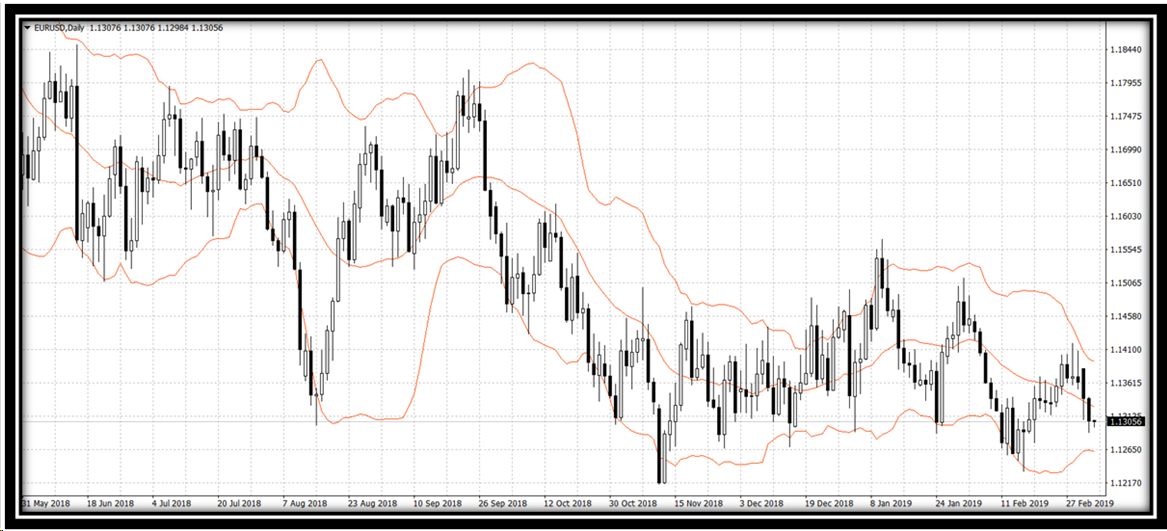
3: Bollinger Bands

Bollinger Bands were created by John Bollinger in the 1980s to provide trading signals that adapt to market conditions. They are typically drawn using a given number of standard deviations around a central moving average.

A common set of parameters for Bollinger Bands involves drawing lines 2 standard deviations around a 20-period simple moving average. Since standard deviations are used as a measure of market volatility, this gives traders a sense of the risk involved in taking positions, as well as a sign that an exchange rate movement is overdone and hence ripe for a correction.

4: The MACD

The Moving Average Convergence Divergence (MACD) indicator was invented by Gerald Appel. The MACD histogram is unbounded and it generally appears below the price action and uses the same time scale as the exchange rate chart it corresponds to.

The MACD is based on the difference between 2 exponentially weighted moving averages (EMAs); usually a faster 1 of 12 periods and a slower 1 of 26 periods. It includes a smoothed moving average (SMA) line of usually 9 periods used to signal trades.

The image below shows the MACD oscillator in red computed based on closing exchange rates with a histogram computed using a slow EMA of 26 periods versus a fast EMA of 12 periods and an SMA line of 9 periods in the indicator box below a candlestick chart of the exchange rate for the EUR/USD currency pair.

Using these indicators is highly recommended by the professionals also. Because using these, you can analyze your charts more detailed and graphically. By the way, a market analyzer called Pipswin is great if you have it.

Thanks!

Source: Best Forex Indicators: 5 Indicators to Understand the Market • Benzinga

1 Like

Along with these I like to use the volume indicators. They really help to confirm your analysis.

1 Like

I’m of the opinion that indicators tell you nothing more than you can glean from the candlesticks themselves. But it’s whatever helps you in your own trading.

3 Likes

I have a strategy, observe the trend, pattern from candlesticks and confirm it using indicators.

2 Likes

The RSI and the moving averages are my favourite indicators. They are quite useful for our analysis and really easy to understand too. Nothing too complex and great interpretations is what that draws me towards them

1 Like

Trading indicators are of great use for the beginner because the experienced ones have a habit of studying their charts and trade manually.

1 Like

You’re certainly right. Trading indicators are the main thing for technical analysis which is high spread withing traders who fond of short-time trading. I believe that technical analysis always help traders to gain more money and decrease the amount of losses. I think that there are no differencies between which strategy does one trader use because they always should be adopted for a particular situation on th market, you know. Hence, one strategy works for certain assets, but doesn’t work for other assets. It’s needed to be noted. However, every trader creates a strategy which works for him.

2 Likes

I’m a big fan of:
Moving Averages - 8 and 21
RSI - to track overbought and oversold instruments
MACD - for possible end of a trend and a reversal

The best indicators are those that are leading are not lagging

1 Like

That’s what all traders think that are not educated on how to use indicators. Usually misled by idiot pure price action gurus. That use trend lines and price only to attempt to beat the markets consistently. (They are needed for the rest of the market, to take their money)

Indicators are used to increase odds of identifying a probabilistic occurrence. (As well as other factors)

That’s why a $24000 a year Bloomberg terminal has them professional traders use them.

1 Like

Your hand must be aching :weary:

When a combination of conditions with indicators are confirmed the traders probability is aided to identify an occurrence of price heading to a certain level. That’s how they are used as a leading indicator, collectively.

1 Like

Hello Kazi,
Thank you so much for the tips. I will immediately check out that market analyzer called Pipswin. I traded for years but never with indicators. Crazy huh, It is a whole different deal now.

Thanks Again,
Scott

Any of you guys and gals use volume indicators? if so, how do you trade with them? Break of trend? Volume with a MA overlapped maybe?

Indicators are helpful if you know how to analyse price chart patterns and candlesticks. Using indicators solely without price action may lead to wrong analysis.

trading with indicators and doing proper technical analysis is gonna change your game alot. There are alot of strategies that based around certain indicators too

Indicators can help you see past trends and predict future moves.

1 Like

all strategies are attempting to achieve one thing - identify and capitalize on a probabilistic occurrence consistently as possible.

Indicators simply help you achieve that. That’s why pure price action traders struggle and rarely if ever are consistently profitable over a prolonged period.

For me, moving average is the best one! Im talking about 50MA (simple), besides moving average is not my only one parameter to trade!

Thank you for the informative post about indicators. Another advanced indicator which I want to add to the list would be the Fibonacci retracement tool as it is quite popular among forex traders these days. It is a reliable and useful indicator based on my experience.