Those are STARC Bands they try to measure the volatility of the pair and sometimes momentum. The center line is a SMA and the outter lines are the SMA plus or minus the ATR. I use them for counter trend trading, they are also good to assess a possible breakout.
W/timing charts down for the moment, it has inspired me to do some excel work regarding data - starting with the COT report. What has been your experience regarding the report?
I am still playing with it. I use it the same as ICT explains for finding extremes in the market. I also use open interest as sort of a volume indicator. A while back I use to add up everything to get a % of longs and short. then I would calculate with ice futures to get a probability % of long or short. This actually predicted momentum for the week very well but is a lot of work to calculate everything myself. Now I just use a cool spreadsheet Kubio sent me. It is missing a couple months of data but calculates everything by itself. All I have to do is download the data from the CFTC website once a week. If you want I can send you the spreadsheet to check out. Just send me an email.
I would definitely look at it. I messed around all weekend trying to do the same thing - percentages of longs vs shorts. I have some crazy graphs and statistics right now, not much good of anything at this point. Will PM the email address.
I know what you mean. Think when I was playing with the report itself I had piles of paper everywhere. I think the wife thought I looked like a mad scientist and in a way I was lol.
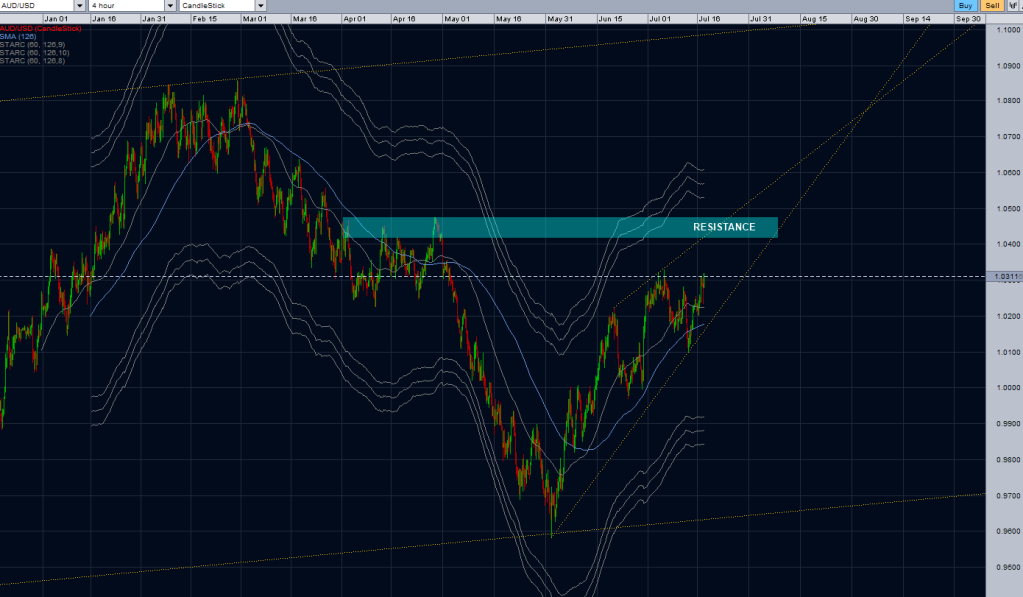
I dont see a trade for me today so I am going to post what I am looking at for potential trade setups in the coming days. As most of you know I took a long last week. It was closed for a 150 pip profit. I posted it on Nikitas thread instead of here as it was on based off her thread but I might copy and paste those posts here since this is my thread. Anyhow I closed it due to the fact we are in an area where I would look to get short so here is what I got. This is a daily most of my trades are based off the daily.
The long yellow is showing a possible resistance which is where we are at. The daily seems to be starting to consolidate telling me there a strong possibility of a reversal. I have no candles to confirm this yet and will be watching in the next few days. I will also be looking at the 4hr to see what happens there. This area is also OTE from the previous major drop made a couple months ago. If price is to continue up I will look for the high of the drop (green line) that has been a strong area in the past thats why its green and not just a small yellow line. However if price was to test that green line I would rather see it go higher to run stops resting up there. 128% fib of that area maybe but that is yet to be seen. The smaller line will be profit target #1 if I get an entry in the next coming days.
Stay tuned I see a short coming soon to a computer screen near you.
As always thats some fine technical analysis there. We were on the same page. I would like to see that resistance get broke before looking to go short. The 128% fib seemd a little far away imo. So I will look for price action to guide me
You know for the fun of it I was playing aroung with that starc indi (while I had a trading program lol) Its a very cool indicator. Not sure how to use it very well since some butthole just cant leave the viruses alone. Its ok though I will still be on BP not sure what they are trying to accomplish but there are not getting my money. If they want to know if I am profitable just follow me I cant keep my mouth shut I post every trade every time. No I am not signing up with myfxbook or any of that. If I cant keep people from messing with me on here I need no more trading related crap around that unlike this site has no benefit to me. Here I learn I have fun.
Sorry guys but this is starting to get under my skin. 3 in a month REALLY? If I wanted to deal with that I would watch porn all day and not little candle sticks moving around on my charts lol.
Ok in my attempt to show everyone my quest to short the Aussie. I am going to try to get this thread on track.
After todays events I will show what I am looking for. On my last chart I posted I wanted to see price hit the 128 fib of the last swing and show me something to get short. Well it hit it but didnt show signs of a short so no trades this week as tomorrow is Friday. Price smashed the 128 Fib and like I said if price did break this level I would wait for the 162% fib. This level is looking promising as it is OTE from the major swing (the swing can better be seen on the weekly but you can see it as I marked it on the daily. This area also has a S/R level along with the 1.05 figure and will sucessfully run the stops I talked about on my last chart post. What I will be looking for is price to hit this area and reverse creating a hammer (inverted hammer) by fridays close. If I get this I will look to get in on sunday/monday at the 50% retracement of the hammers wick. I will also look for pivots and anything else that will give me confluence as the days unfold. Still a ways out I was looking for something today but I have nothing that screams short me. So its the sidelines I sit on for now. Hopefully I get something next week. Here is a chart. Sorry for the clutter but I wanted to show the confluence with the 162% fib and ote off the weekly with support and all that good stuff.
On a side note even though I made no trades this week it was a profitable week as I closed out a trade from last week for about 150 pips. Stay tuned as I continue my quest to short the Aussie into extinction.
Its Saturday night and markets are closed for me. I want to take the time to show what I am like to see next week. I will not post a daily chart as it pretty much looks the same as the one above except Friday was a red candle. Price pushed down on Friday but did not show anything that screamed short me on any time frames I look at. I look at the Monthly and weekly but pay more attention to the daily. I will also look at the 4hr to find a trade but didnt find anything there either. I also look at the 1hr and 15 min for entries (not trades ENTRIES). I use the monthly, weekly and daily mainly to plot S/R levels. As stated in my last post I was looking for price to now break the green line as it is a valid S/R level on the weekly and daily charts. Also as stated it is a 162 fib along with ote. Price came close last week but pushed down on Friday. Since there was nothing to tell me price is going down I will expect a gap to the down side and price to fill that gap. If it does then it most likely will set up the short I was looking for last week and did not get. Now there are a couple things I find interesting to support me looking to go short that I did not have last week.
First one is the COT report. I see large speculators (red line) are turning to the short side. As Commercials are looking long (blue line). Keep in mind a couple things on the excel spreadsheet I have below. One is there is 3 months of data missing as you can see by the part the chart goes in a straight line. I have not figured out how to import old data correctly. That is what it is I am not to worried about it. The next is we are not at an extreme positioning so this could be a small retrace on the weekly or daily time frames. That is fine with me as I trail stops and a retrace on the weekly or daily is plenty of pips for me. Here is the spreadsheet that I got off babypips. I wont say who as he knows who he is and I must say thanks.
The next thing I got to support my short that I did not have last week is SMT divergence on the daily chart. I know I said I was not going to post another chart but I lied. This is a line chart that shows the AU (red line), NU (blue line) and the USDX (green line). The MT4 indicator I am using to do this has a option called mirror mode. I am using that on the USDX. This feature flips the USDX meaning if it is posting higher highs on my chart it is really making lower lows. I use this to make it easier to spot divergence. I generally look for SMT on lower timeframes but never get it on these pairs. I know I have said many times before that it is very rare on this pair but when it does happen the probability of your trade goes up significantly. Here is the chart
As you can see the NU and USDX failed to push higher but the AU did make a higher high. Thats SMT right there. If you want to know more on SMT go to ICT’s thread I posted a link on the first post. He explains it better than I ever could. So there you have it I see nothing to tell me I was wrong last week. Just more confluence to support my short. All I need now is an entry signal. Lastly guys please dont take this a trade advise. As previously stated I am not a teacher, mentor, or signal service. I am a trader, part time at that. If you go shorting come market open and lose its your problem not mine as you will not see me do it. I was asked questions on how I trade the Aussie and well here it is these are my thoughts. If something develops I will post a trade as I continue my quest.
Oh well yunny you know the name of this game as well as anyone it sucks but you will be back.
I didnt get a trade and not looking good for this week for me. I was correct on direction and everything. My analysis was on point. I was just looking for an entry on the daily and well I did not get it. Instead price dropped on the open for the week. So anyone who shorted at the open even though I said not to, guess what your account says I was wrong. I was not wrong everything lined up but my entry. Price looks to be making a low for the week. So I will not get in now unless a really nice setup comes up but, I am not holding my breath. I will not jump in the shark infested waters to swim after a sailed ship. Instead I will wait for the next one. I know the week is only half over but its made the move I was looking for (mostly). Sure could go down more but not enough to justify my risk. Now what did I learn from this? Nothing yeah thats right noda, not a damn thing. My analysis was correct, timing was good but I did not get the entry I was looking for. The daily really did not show signs of a reversal even though it did. I needed something to confirm this. That way I could lower the stop as in Nikitas thread. I have been trying to widen my stops due to a losing week. I think I will revert back a little as ever since then I have been struggling. Still in profits or more break even. I will keep working on it but I also know if its not broke dont fix it. My about 10 pip stops worked as they made me find precise entries. I was coming close to my stop (by a pip or 2) a lot and thats why I decided to widen them. I did not see it sustainable long term. But now I am finding nothing new just a wider stop but the same loss in the end. I see more trades go sideways now as I have more room to breath. I think in the end I do better under pressure a lot of pressure. With room to breath I seem to breath more. I am not saying I will not work on my stops a little but I think I went from one extreme to another. Either way it does not matter as I would not have taken a trade this week no matter what. So in the end this week would have ended the same result. My analysis never changed. My entries have since the stop is further now. Its actually not the stop placement it my way of thinking coming into the trade. Since I have more breathing room I use it. Still not a loss but I am no steps further from one either. So in conclusion I have not made more or less more by widening my stops just after reading my trade journal I seem to be more carelees with a wider stop. Thats why I preach a trade journal to every one on here. You may go back a read it and or you may not but if you need to review it is very handy to have instead of numbers from trades and trying to remember that trade. Sorry guys I just felt like rambling a little as (hell I cant lie not even watching charts right now) the charts go up and down. Thats your problem not mine. I might look to get in at the high of the week but I will see what that looks like when and if we get there. I have more to type but my fingers are getting tired so stay tuned as I continue my quest to short the Aussie into extinction.


 The life of a trader…