I see the 5m chart is respecting the mysterious 63ma on the 1h. 
Also I see the 1h chart… the mysterious 63ma has crossed 200ma from above in a steep angle.
Won’t be long…
My monies on a break south tomorrow… well see.
Hello,
I have a question, I’d like to see if I have this right. I’ve attached m15 & m5 charts I used today. m5 with bb’s of 20:1, 20:2, 20:3. m15 with bb 20:2.
On the m15 & the m5 when the candle wick passes over the top bb I entered a short trade. When the candle approches the mid bb, if a green candle formed, I exited, if a green candle did not form, I waited for the price to reach the lower bb, a green candle to form and then exit. 3 trades this afternoon for 56 pips. Is this correct?
Thanks
Jack
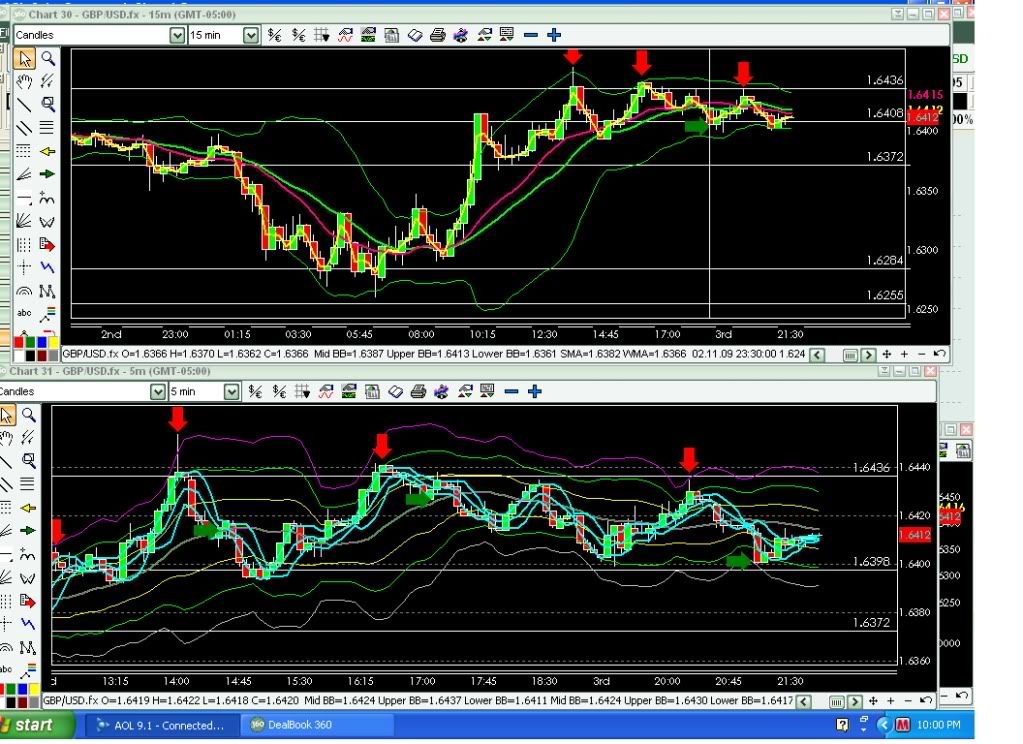
Interesting to hear someone else’s opinion but IMO, the 2nd candle did not have a wick so a little riskier. However, the bollingers were more or less flat for all those trades, which is ideal for a trade to the middle bollinger or further. The 3rd trade would have had to have been a 5min trade as the candles did not touch the 15min 20:2 bollinger.
You mean after the big break north? 
No wicks on the bottoms but some longs would have been profitable, is there anything to look for at those bottoms that would have indicated a long? Or is that too risky because they didn’t go far enough down and no wicks ? Just looks like missed pips left on the table.
Ah but its only in the AM here Mike so not counting that up… I did say tomorrow… plenty of that left yet. We are yet again at the day chart PP… what is it now, I’ve lost count of the number of times its been here since June.
Each time PA has made it to here its either retraced, hit plus 50 pips and retrace (once 100 pips). So the question is… ‘do you feel lucky punk… well do ya?’ 
I’ve entered a short at 1.6538.
lucky punk? hey! Youre supposed to be a Jedi, not a dirty Harry LOL
Well anyway, I see what you mean, does look like it’s about topped out.
Based on 4hr trendline and the fact that price stalled badly at it’s current region? …or something else
A do feel a force… but think its just someone left the door open. Take a look at the 4h two previous peaks (most recent lower than the other). Its early days yet as 4h candle hasnt closed but its wicking. Draw a trendline accross all three and it does seem to be playing along at present.
Sorry SanMiguel… posts crossed each other. I am just thinking its at that region again and the 4h is starting to look interesting. Plus shorter time charts are looking like a break south.
Yep, I’ve got that trendline on the peaks.
How are you determining the PP on the daily? I’ve got a pivot point indicator on my metatrader and it looks like the R2 is the resistance line.
Sorry mike I’m not a good multi-tasker. I see the last three 4h peaks as the most relevant resistance lines on the daily chart. Unless were ultralong traders that is.
You mentioned daily PP I thought you were referring to pivot points.
Mike
I was just thinking re your trading the 1h chart. There might be a better way to do it. I mean if you can’t be in front of the charts all the time that is.
If you use a 5m chart with the usual settings i.e. 20:1 & 20:2 boll (optional 5:1 tunnel boll or 3/6/9 LWMA). But add a 240 period 20:2 boll (to approximate the 1h boll).
That way you effectively have a 5m chart with 20:1 & 20:2 bolls indicating the possible deviation of PA from the centerline for optimal entry/ exit for short term trades and you can much more accurately time your entry/ exit using the 5m centerline boll against the longer 1h overlaid boll band.
I have closed up a 5m chart indicating what I mean and have a 1h chart next to it for comparison. But might need to expand the word doc to see the 5m chart more clearly.
So, you’re taking a 5min bounce and if PA happens to cross the 1hr centre line boll during that trade, you hold onto the trade and turn it into a long term trade?
I was thinking particulary in Mikes case that the 5m chart gives a much faster indication of what PA is really doing suitably set up. He could take the quicker trades using the 5m bolls or optimise an entry for a longer trade using the 5m boll centerline and bolls. A sort of one chart fits all. You could even use the chart for two trades… one short term and one longer term. Or use the 5m boll bounces mindful of where the 5m centerline is pointing.
Thanks Robert but I’m trying to stay away from 5m and 15m except at night and first thing in the mornings when I have some time to monitor the monitor. There is something kind of interesting that I did though. I have a 15m chart but zoomed all the way out untill it matches the 1h chart. So basically it’s identical to a 1h chart but if I zoom in for a closer look I actualy see 15m candles. Could also do the same thing with a 5m chart. So that’s kind of like what your’e talking about with an all in one chart. You can have a birds eye view (more of that VFR flying) or you can zoom in for the minute details.
Just a different way of looking at things. Usefullness yet to be determined.
Looks like 1h is still trying to head north so far.
That’s neat actually. Assuming a 1hr retrace in a trend to the centre line bollinger, you could add onto your trade very accurately based on wat the 5min chart does in that area. I’ve stuck on a 20:1 240period as well.
240/5 = 48 though  Presumably the closest estimate.
Am waiting for it to hit that 1.66 level and bounce off on the 5/15min.
May happen a little earlier…