Daily USDCHF Technical Analysis & Trading Signals (July 13)
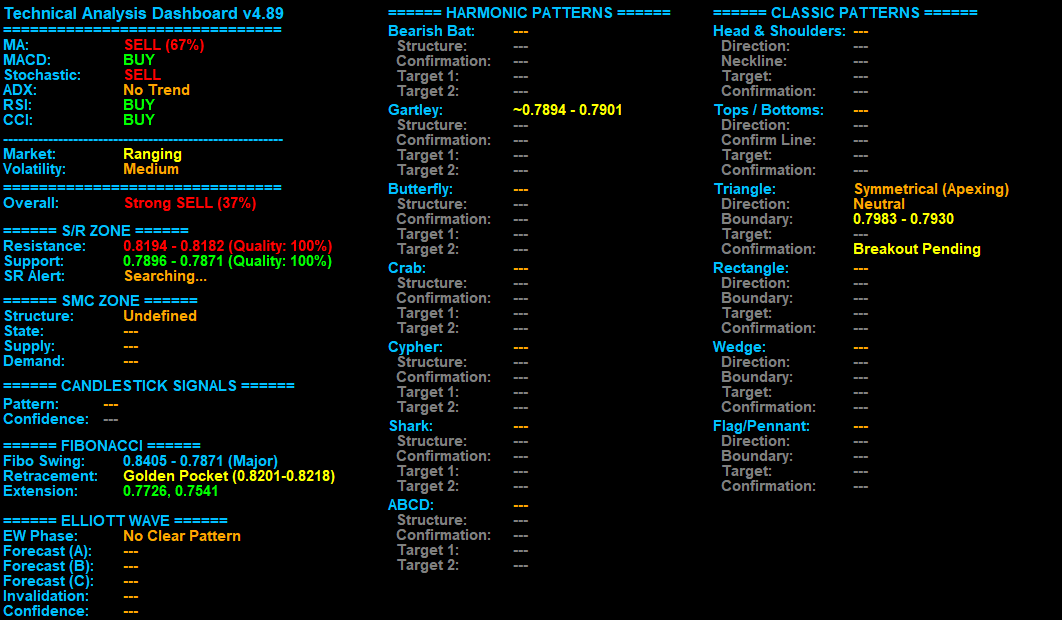
Analysis: Based on the dashboard analysis for USDCHF on the H4 timeframe, the market is currently in a Ranging state with Medium volatility. The classic indicators show mixed signals, with the MA signaling SELL while the MACD, Stochastic, RSI, and CCI are all indicating BUY or Neutral conditions, highlighting the lack of a clear trend. The ADX confirms this, showing No Trend at all. This is synthesized into a moderately bearish Overall signal of Strong SELL (37%) , suggesting a weak downward bias.
The Support & Resistance engine identifies nearby resistance and support zones with 100% quality. Notably, the Symmetrical (Apexing) triangle pattern is currently forming, with a Breakout Pending . This is the most crucial signal on the dashboard, as the triangle’s boundaries at 0.7983 and 0.7930 will define the market’s next move.
A potential breakout will determine if the weak bearish bias strengthens or a bullish reversal takes place. The Fibonacci Golden Pocket at 0.8201-0.8218 provides a potential retracement target if a bullish move occurs.
Disclaimer: This analysis is based solely on data from the provided dashboard and is intended for educational purposes only. Trading involves risk, and by following this analysis or its signals, you may incur financial losses. Please exercise caution and make your own informed trading decisions.