Daily GBPUSD Technical Analysis & Trading Signals (July 19)
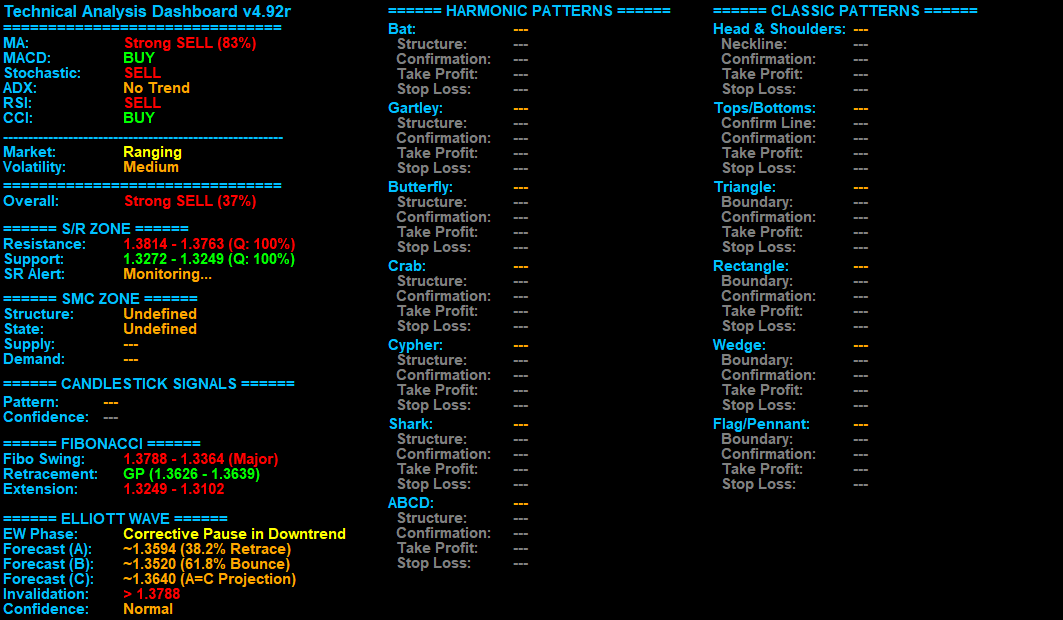
Analysis: This H4 GBPUSD chart presents a Ranging Market with Medium Volatility . The dashboard’s Overall bias is a Strong SELL (37%) , despite mixed individual indicator signals like Strong SELL from MA and RSI, contrasting with BUY from MACD and CCI. ADX notably indicates No Trend .
The current price of 1.3405 is between active support and resistance zones, with the dashboard Monitoring them. Significant resistance lies at 1.3814 - 1.3763 (Quality: 100%) and strong support at 1.3272 - 1.3249 (Quality: 100%). Fibonacci analysis highlights a major swing with a Golden Pocket retracement at 1.3626 - 1.3639.
The Elliott Wave engine identifies a Corrective Pause in Downtrend , forecasting a potential ABC correction with targets for Wave A at ~1.3594, Wave B at ~1.3520, and Wave C at ~1.3640, with invalidation above 1.3788. Harmonic, SMC, Candlestick, and Classic Pattern engines currently show no active high-probability setups.
Disclaimer: This analysis is based solely on data from the provided dashboard and is intended for educational purposes only. Trading involves risk, and by following this analysis or its signals, you may incur financial losses. Please exercise caution and make your own informed trading decisions.