Market Insights with Gary Thomson: 11 - 15 August
Market Insights with Gary Thomson: RBA Rate, US Inflation, UK Jobs & GDP, Earnings Reports
In this video, we’ll explore the key economic events, market trends, and corporate news shaping the financial landscape. Get ready for expert insights into forex, commodities, and stocks to help you navigate the week ahead. Let’s dive in!
In this episode of Market Insights, Gary Thomson unpacks the strategic implications of the week’s most critical events driving global markets.
![]() Key topics covered in this episode:
Key topics covered in this episode:
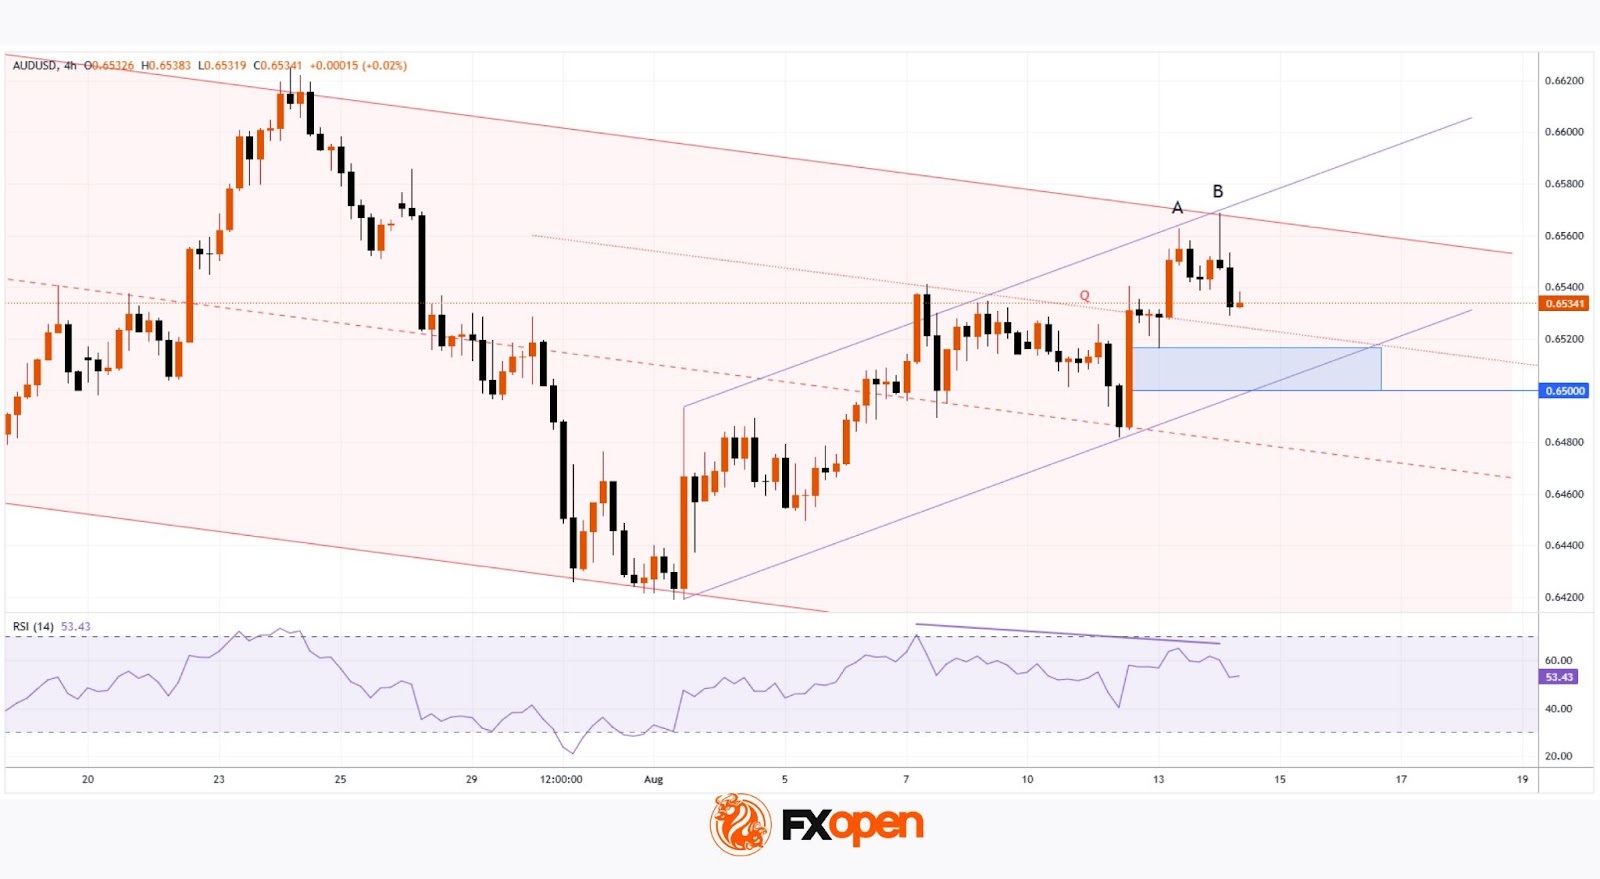
— RBA Interest Rate Decision
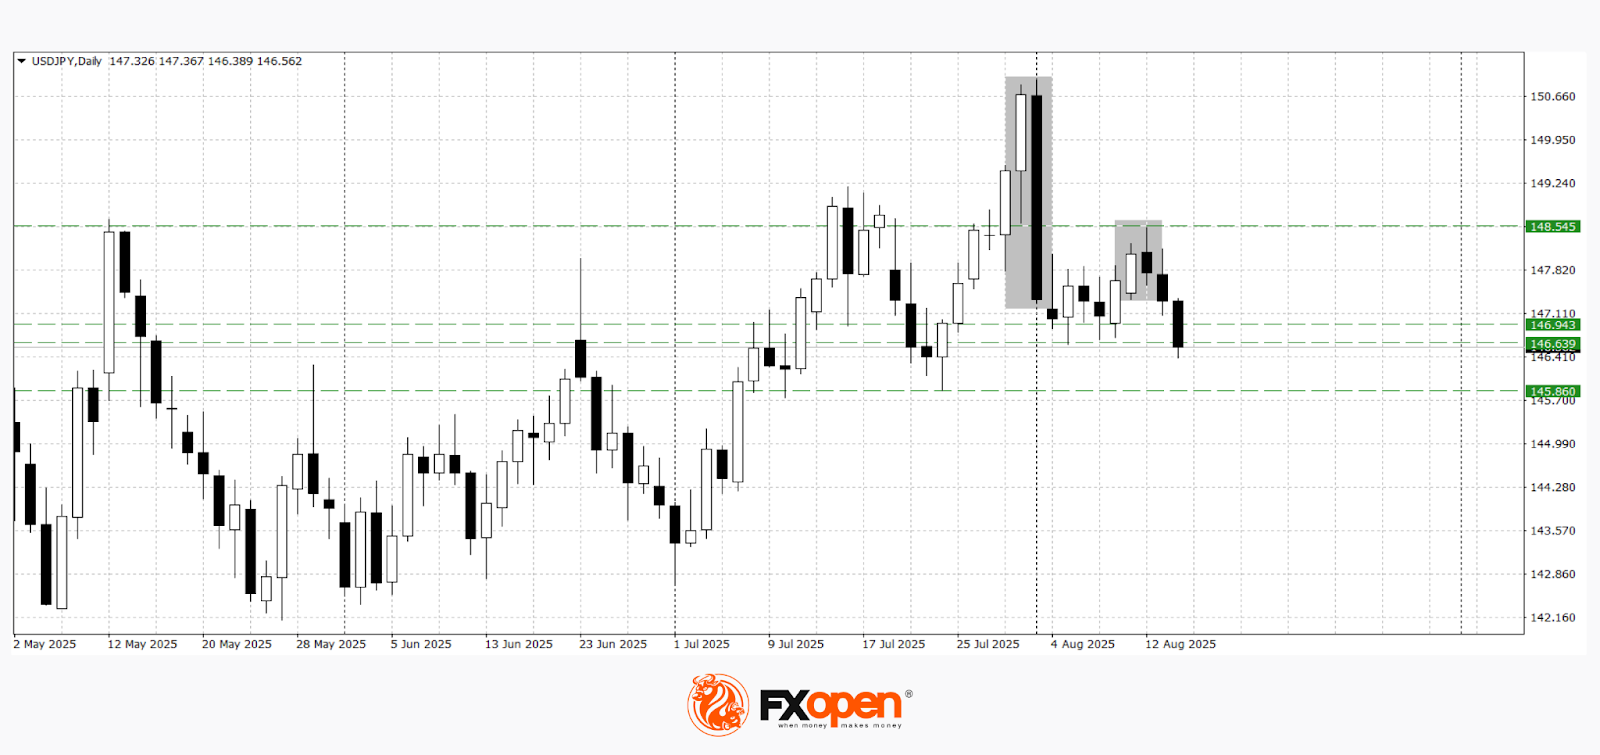
— US Inflation Rate
— UK Unemployment Rate
— UK GDP Growth Rate
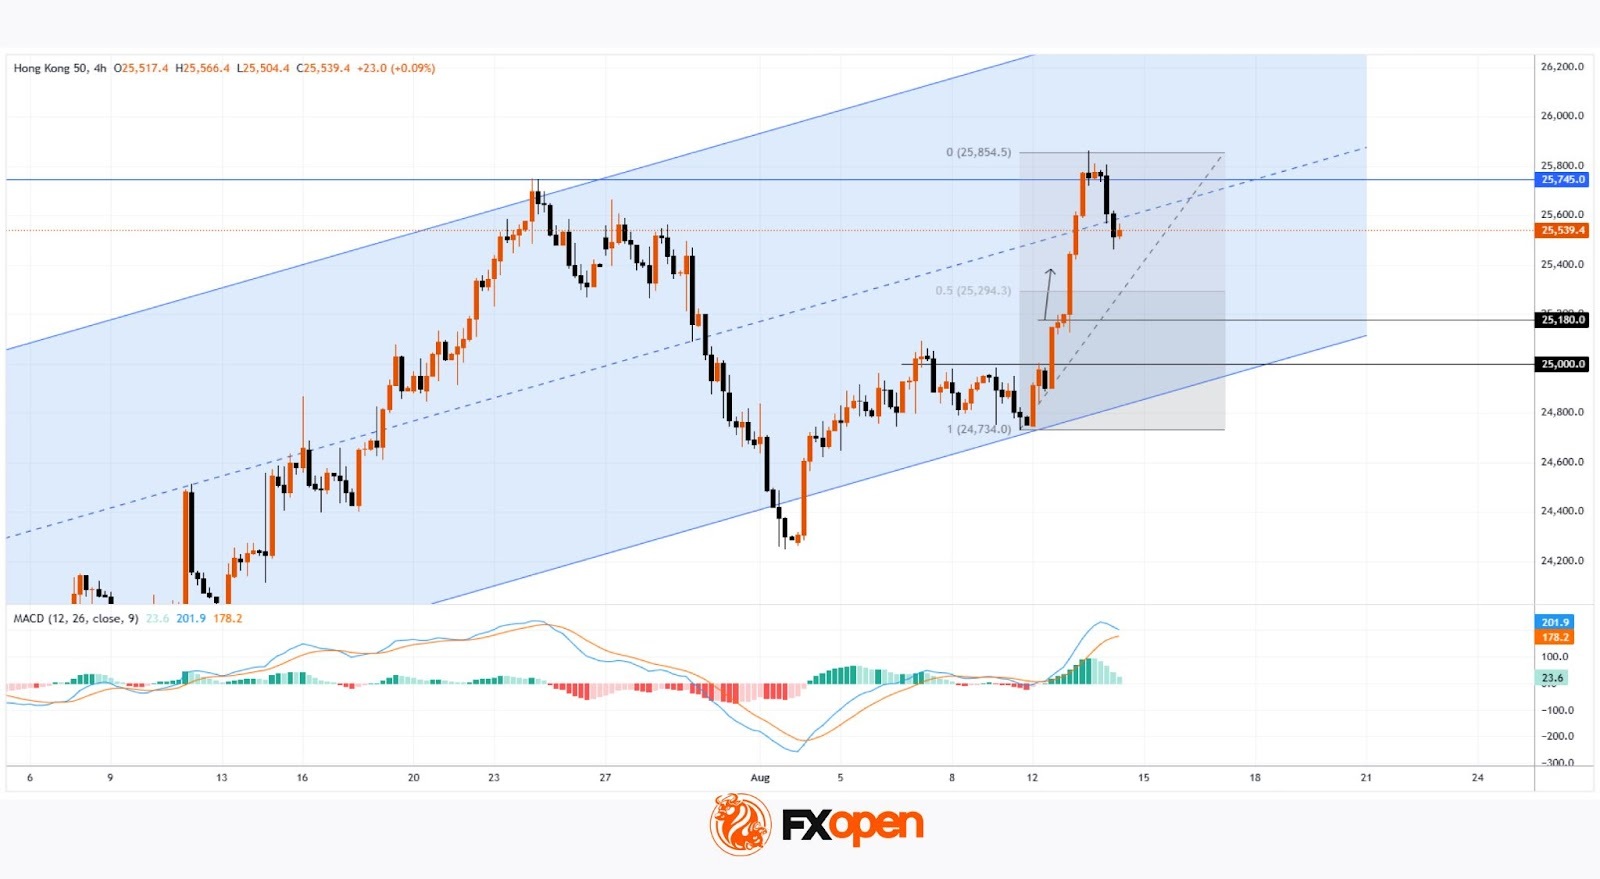
— Trade Tensions
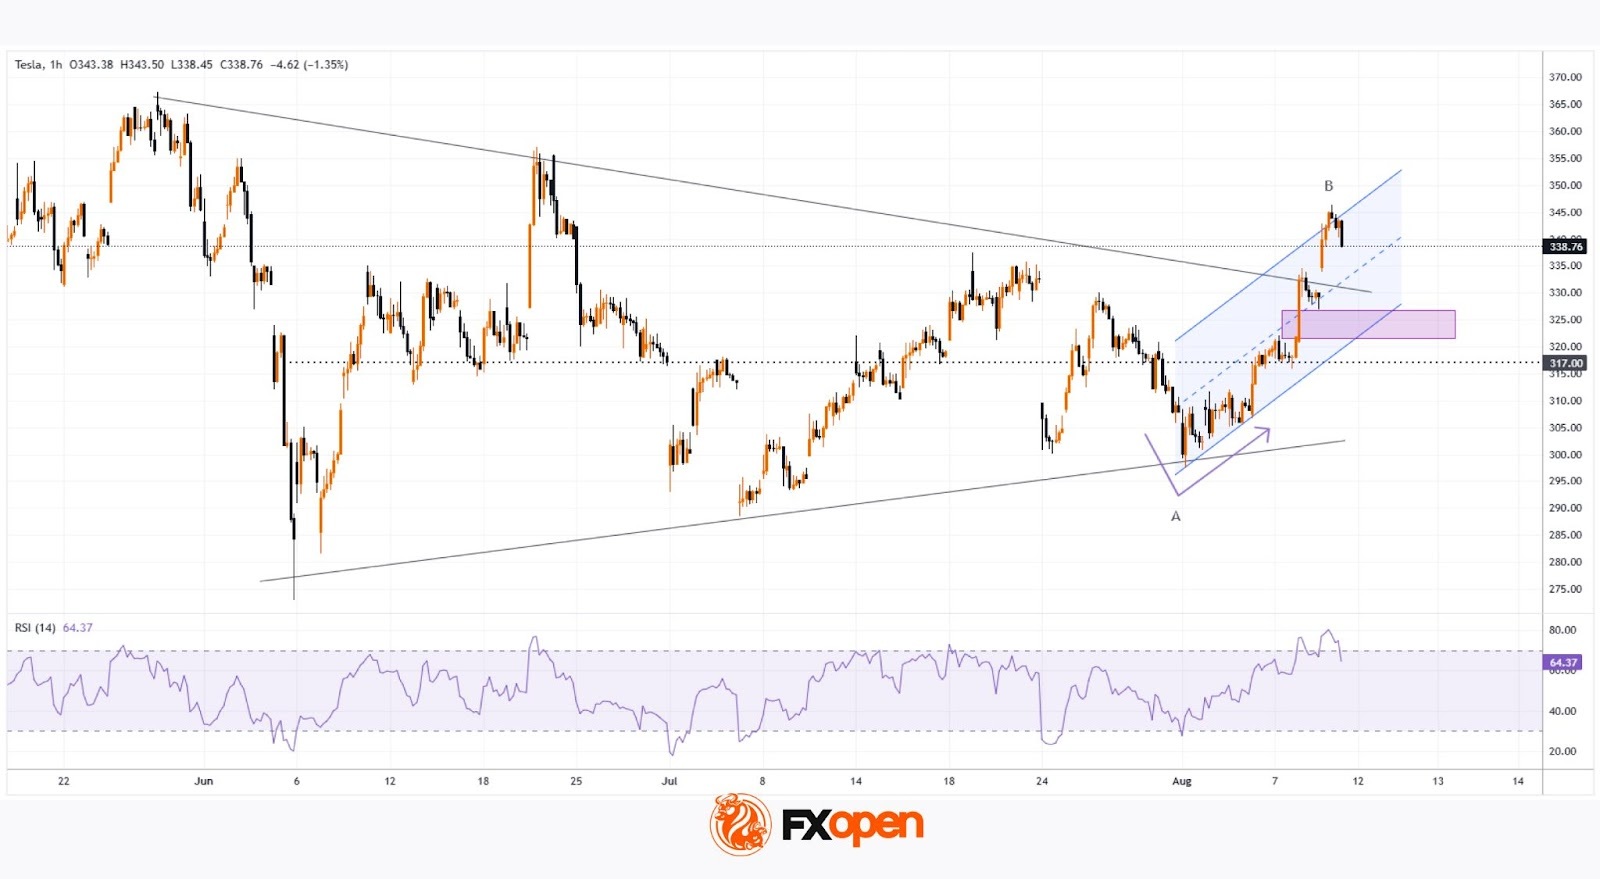
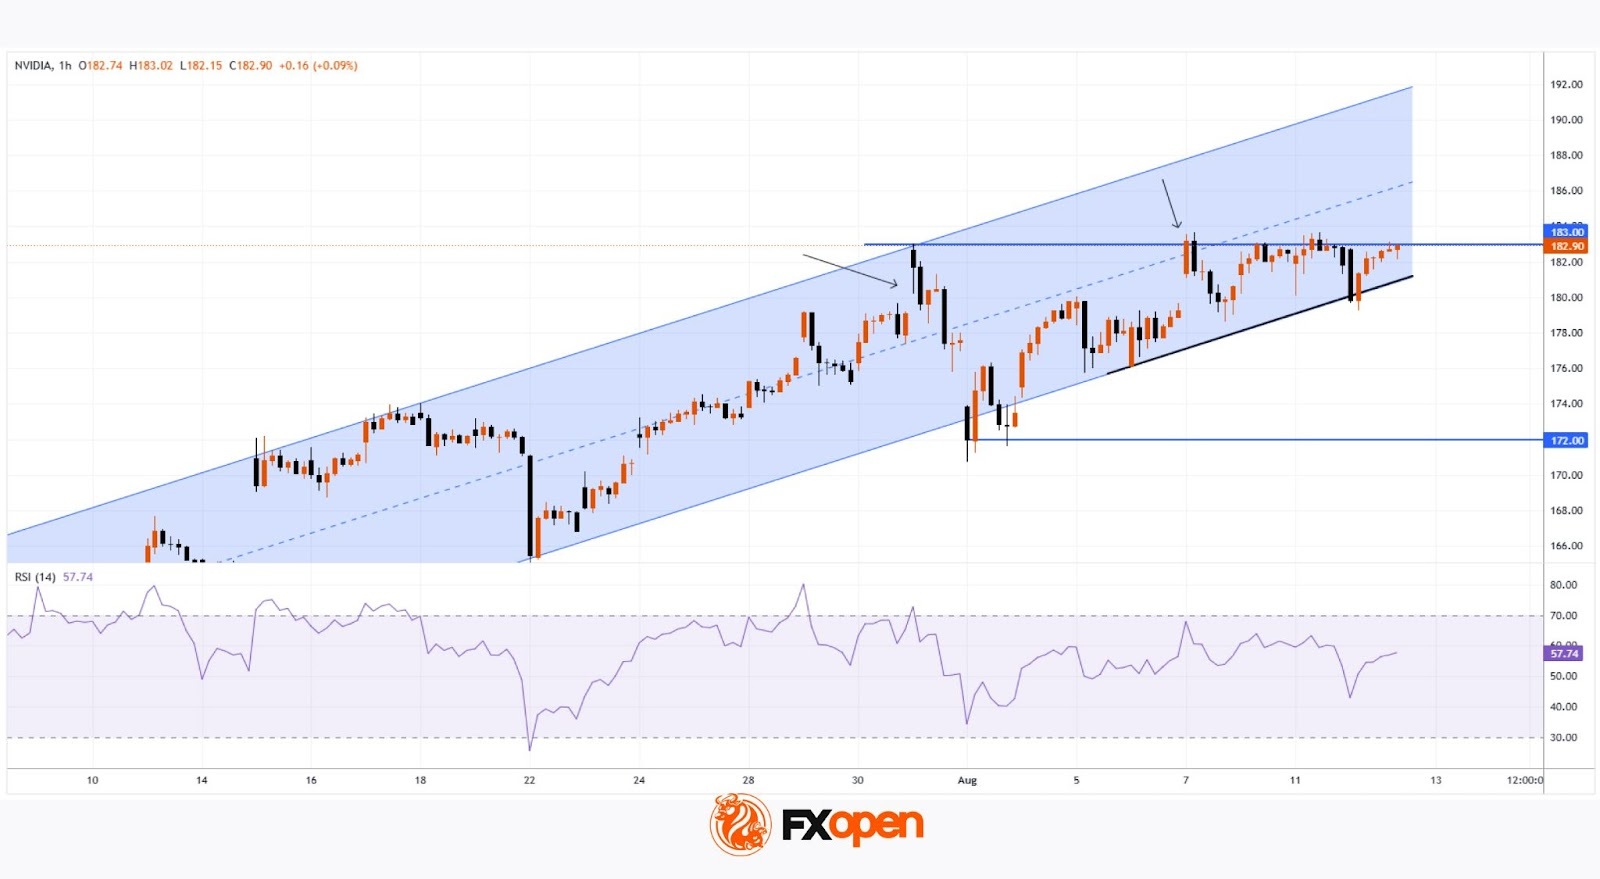
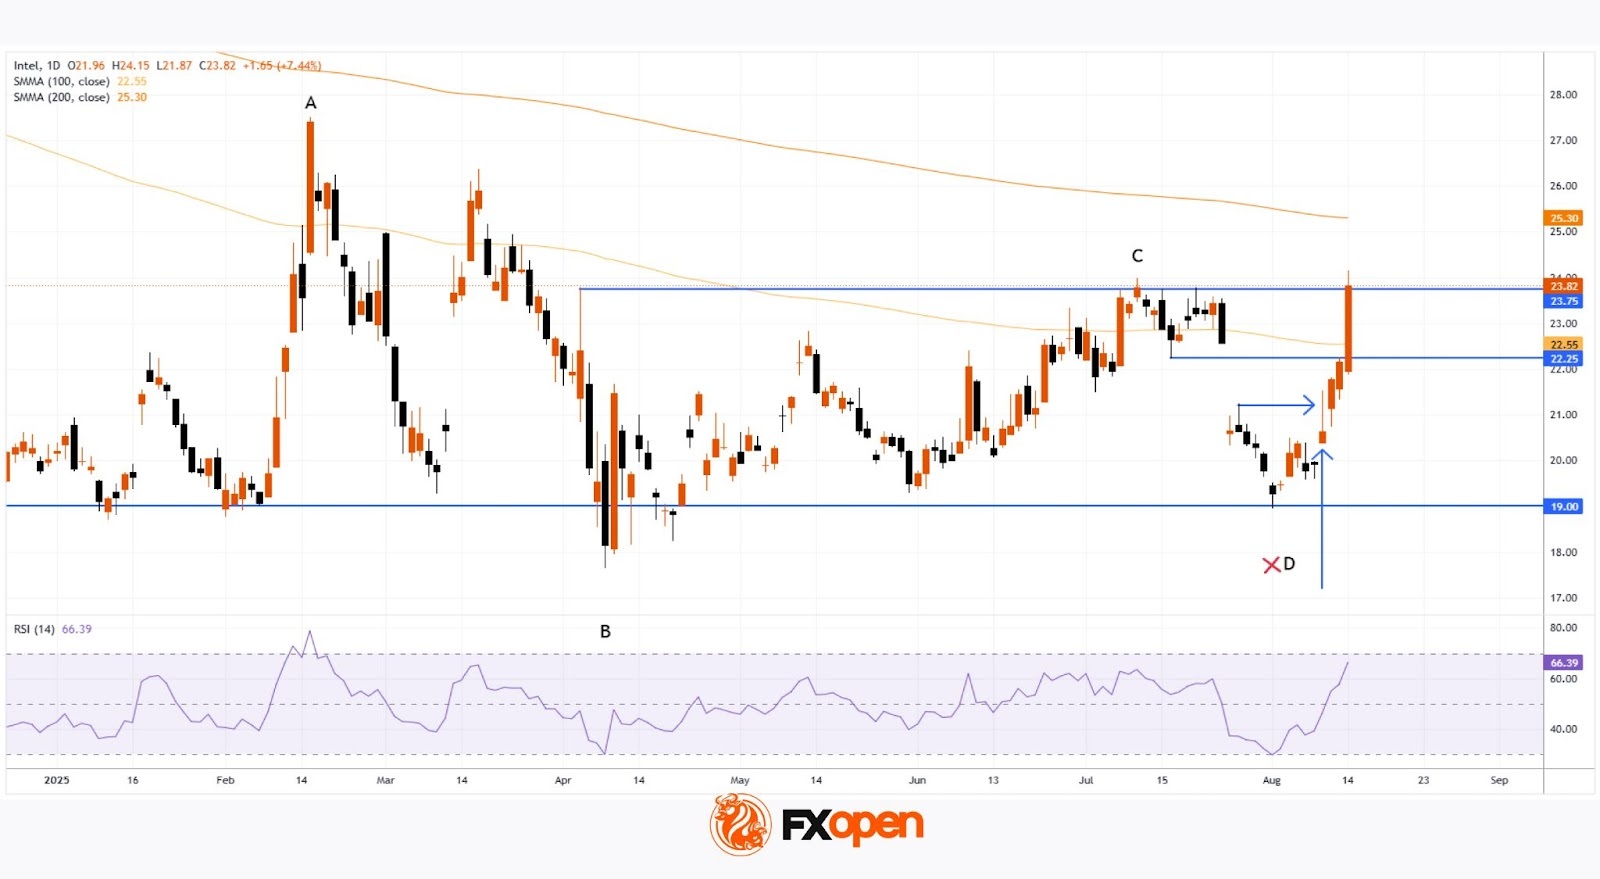
— Earnings Reports
Gain insights to strengthen your trading knowledge.

Watch it now and stay updated with FXOpen.
Don’t miss out on this invaluable opportunity to sharpen your trading skills and make informed decisions.
Disclaimer: This video represents the opinion of the Companies operating under the FXOpen brand only. It is not to be construed as an offer, solicitation, or recommendation with respect to products and services provided by the Companies operating under the FXOpen brand, nor is it to be considered financial advice.