Daily Market Analysis By FXOpen

Watch FXOpen’s March 20 -24 Weekly Market Wrap Video

In this video, FXOpen UK COO Gary Thomson sums up the week’s happenings and discusses the most significant news reports.

  • Swiss tsunami rips through global markets: FTSE 100 wipeout noticeable
  • British Pound reaches one-month high against US Dollar despite banking crisis
  • EURUSD hits monthly highs ahead of Fed news
  • To hike or not to hike? That is the Fed’s question

Watch our short and informative video, and stay updated with FXOpen.

FXOpen YouTube

Disclaimer: This forecast represents FXOpen Companies opinion only, it should not be construed as an offer, invitation or recommendation in respect to FXOpen Companies products and services or as financial advice.

#fxopen #fxopenyoutube #fxopenuk #weeklyvideo

GBP/USD Eyes Fresh Increase While USD/CAD Visits Key Support


GBP/USD is showing positive signs above the 1.2200 support. USD/CAD corrected gains and now trading near a key support at 1.3720.

Important Takeaways for GBP/USD and USD/CAD

· The British Pound started a downside correction from the 1.2340 resistance zone.

· There was a break below a key bullish trend lien with support near 1.2280 on the hourly chart of GBP/USD.

· USD/CAD is correcting gains from the 1.3800 resistance zone.

· There was a break above a major bearish trend line with resistance near 1.3730 on the hourly chart.

GBP/USD Technical Analysis

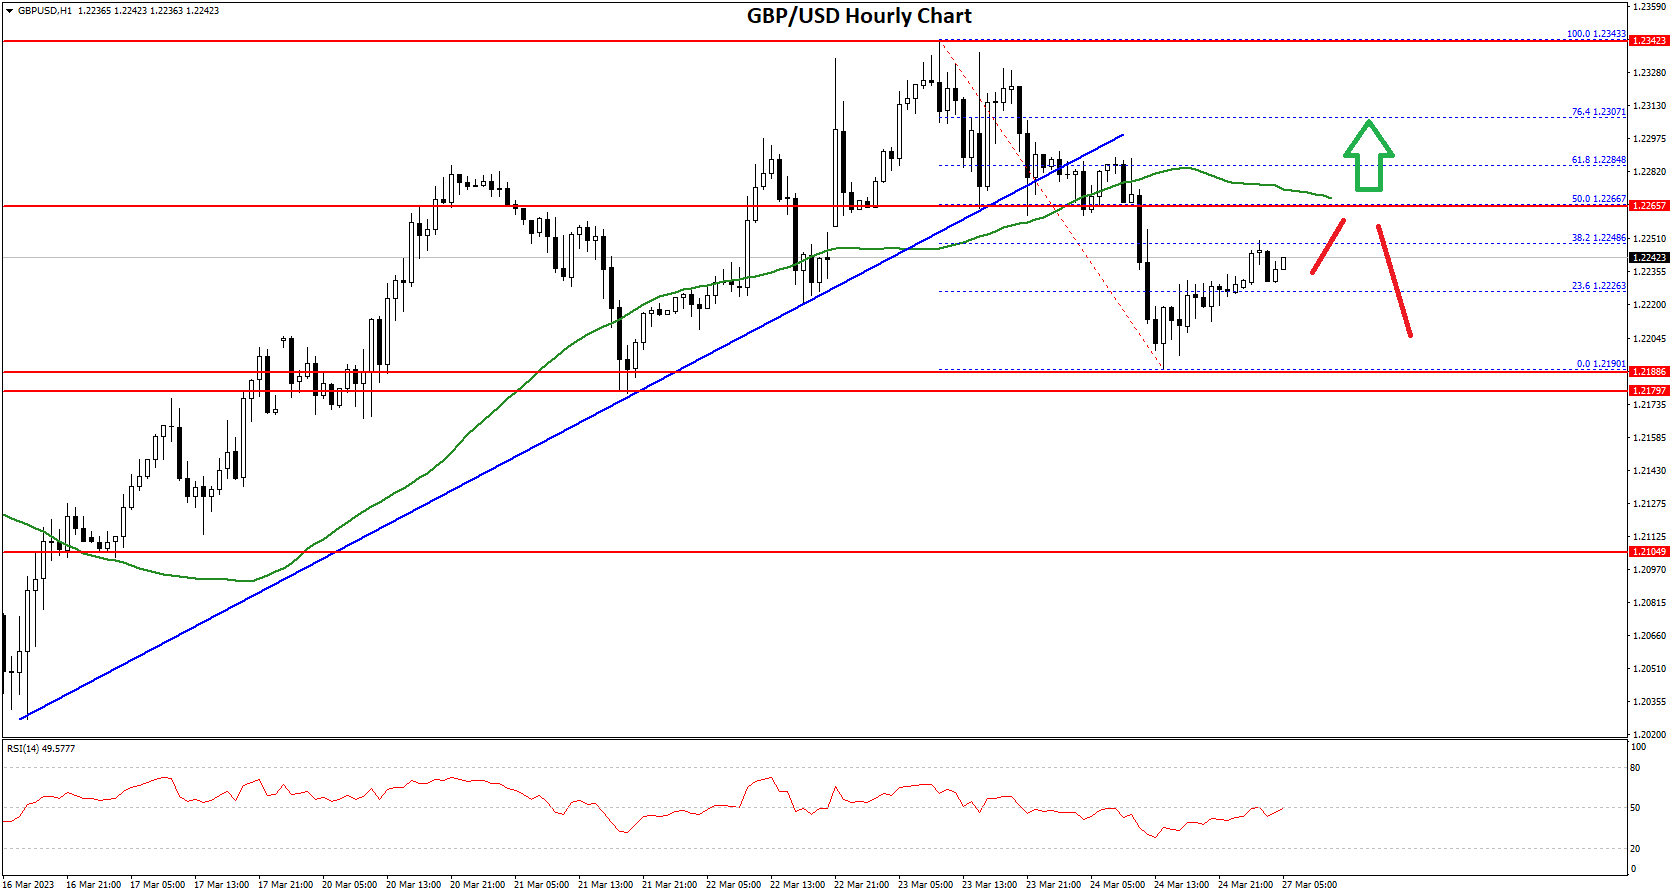
The British Pound started a fresh decline from well above 1.2320 against the US Dollar. The GBP/USD pair gained bearish momentum after there was a break below the 1.2280 support.

The pair even broke the 1.2250 support level and the 50 hourly simple moving average. Besides, there was a break below a key bullish trend lien with support near 1.2280 on the hourly chart of GBP/USD.

GBP/USD Hourly Chart

Finally, there was a spike below the 1.2200 level. A low is formed near 1.2190 on FXOpen and the pair is now correcting losses. There was a move above the 1.2220 level. The pair climbed above the 23.6% Fib retracement level of the downward move from the 1.2343 swing high to 1.2190 low.

An immediate resistance is near the 1.2250 level. The first major resistance is near the 1.2265 level and the 50 hourly simple moving average. It is near the 50% Fib retracement level of the downward move from the 1.2343 swing high to 1.2190 low.

The next major resistance is near the 1.2300 level. Any more gains could lead the pair towards the 1.2340 barrier in the near term. If not, the pair could move down and might break the 1.2200 support. The next major support is near 1.2180.

If there is a downside break, GBP/USD might test the 1.2120 support. The next major support sits at 1.2050, where the bulls might take a stand.

VIEW FULL ANALYSIS VISIT - FXOpen Blog…

Disclaimer: This Forecast represents FXOpen Companies opinion only, it should not be construed as an offer, invitation or recommendation in respect to FXOpen Companies products and services or as Financial Advice.

British Pound hits 1-month high against US Dollar

Volatility within the British Pound has been a considerable point of interest recently, especially since the Pound bounced back during the early part of this quarter from a sustained period of decline against the Euro and US Dollar which took place for several months, beginning late last year.

Today, the British Pound is trading at the higher end of the 1.23 range against the US Dollar, which is two whole pence higher than this time one month ago.

The sudden upward movement of the British Pound against the US Dollar and its sustained climb during the course of the past month has been largely down to a lower confidence in the overall United States economy following the collapse of the Silicon Valley Bank, and some regional banks such as First Republic, demonstrating the contagion of toxicity among the banking sector in the US.

Whilst Credit Suisse is not an American bank, one of the many contributing factors toward its demise is that in 2021, Archegos Capital Management, a family office that managed the personal assets of Bill Hwang, at one time managing over $36 billion in assets, was assisted by Credit Suisse to establish itself in the United States.

Mr Huang had been banned from trading in Hong Kong and regardless of this, Credit Suisse helped him rebrand his hedge fund as Archegos and move it to New York, subsequent to which he lost $20 billion and was arrested on charges of fraud and racketeering. Of this, Credit Suisse was exposed to approximately $5.5 billion.

Whilst that may have taken place two years ago, it was one of the US Dollar-denominated catastrophes that led to the downfall of Credit Suisse, hence memories are long, and the US financial markets economy came under the spotlight during the demise of Credit Suisse, which took place just a short time after the demise of Silicon Valley Bank.

Now, with confidence in banking at a new low across the United States, investment in that sector is being approached with trepidation, and bank stocks listed on US exchanges declined in value.

The bank run which resulted in many people and companies withdrawing their funds from First Republic then escalated in that larger Tier 1 banks then began sending their customers money to the tune of $30 billion to First Republic to try to prop it up.

This is the type of practice which does not instil confidence at all.

Interestingly, the contagion has not reached the United Kingdom and there is no banking crisis on the British side of the Atlantic.

This could be a simple explanation for the Pound’s sudden strong performance against the US Dollar, especially given that all other factors relating to high levels of inflation, and rising interest rates still continue to affect both the British and American monetary policy – neither is out of those woods, but the banking strength appears to be higher in the United Kingdom than it does across the pond.

VIEW FULL ANALYSIS VISIT - FXOpen Blog…

Disclaimer: This Forecast represents FXOpen Companies opinion only, it should not be construed as an offer, invitation or recommendation in respect to FXOpen Companies products and services or as Financial Advice.

Unbelievably, UK banks lead FTSE 100 gains

What a fickle world we live in. Last week, America’s sudden focus on the collapse of Silicon Valley Bank and the contagion that surrounded it in which a run on some smaller banks took place, claiming the existence of First Republic.

This caused some major North American indices to drop as investor confidence in bank stocks waned, and then just a matter of weeks later, when Swiss bank Credit Suisse collapsed, the investors on the European side of the Atlantic began to worry about the stability of the banking system and the FTSE 100 index in London experienced a £76 billion reduction in the value of the stocks listed on it.

This reduction flew in the face of predictions just one month ago which asserted that the FTSE 100 index, which is the basket of stocks of the United Kingdom’s most prestigious blue chip companies listed on the London Stock Exchange, may reach 8,000 points.

Instead, it dipped to around 7,300, largely due to lack of confidence in bank stocks.

Today, however, a sudden surge in value has taken place this morning as the FTSE 100 suddenly rose from 7,470 to 7,520, with this increase being led by, rather remarkably, bank stocks!

Traditional manufacturing stocks have remained strong on the FTSE 100, such as drinks manufacturer Irn Bru, as well as house building companies such as Bellway Homes which is set to make an earnings announcement imminently, however the banks in the United Kingdom have now demonstrated that they have not been subject to the toxicity that has taken place in some parts of the United States.

In fact, not only have British banks demonstrated their relative stability and have not been affected by any contagion, but the British divisions of struggling or insolvent American banks are on a road to being potentially saved.

Bank of England Governor Andrew Bailey is set to appear before MPs on the rescue of the UK arm of Silicon Valley Bank. The relief rally was also helped by the deal earlier this week for First Citizens bank to rescue Silicon Valley Bank.

Barclays. NatWest, Lloyds Banking Group and HSBC all made further gains, of between 1% and 2% each. Overall, the FTSE 100 added 52 points to 7523.60, a rise of 0.7%.

Since the rally that took place during the early hours, the upward direction has stabilized slightly, however this is a positive position and fears over banking have been quelled.

VIEW FULL ANALYSIS VISIT - FXOpen Blog…

Disclaimer: This Forecast represents FXOpen Companies opinion only, it should not be construed as an offer, invitation or recommendation in respect to FXOpen Companies products and services or as Financial Advice.

BTCUSD and XRPUSD Technical Analysis – 28th MAR 2023

BTCUSD: Bearish Engulfing Pattern Below $28781

Bitcoin was unable to sustain its bullish momentum last week and after touching a high of $28781 on 22nd March, the price started to correct declining against the US dollar, touching a low of $26531 on 27th Mar.

We have seen a bearish opening of the markets this week.

We can clearly see a bearish engulfing pattern below the $28781 handle which is a bearish reversal pattern because it signifies the end of an uptrend and a shift towards a downtrend.

Bitcoin touched an intraday high of 27238 in the Asian trading session, and an intraday low of 26837 in the European trading session today.

The commodity channel index is giving a bearish divergence signal in the weekly time frame.

Both the STOCH and Williams percent range are indicating overbought levels which means that in the immediate short term, a decline in the prices is expected.

The Ichimoku price is under the cloud in the weekly time frame indicating a bearish trend.

The relative strength index is at 38.03 indicating a weak demand for bitcoin, and the continuation of the selling pressure in the markets.

Bitcoin is now moving below its 100 hourly simple moving average and above its 100 hourly exponential moving average.

Most of the major technical indicators are giving a sell signal, which means that in the immediate short term, we are expecting targets of 26000 and 25500.

The average true range is indicating less market volatility with a bearish momentum.

  • Bitcoin: bearish reversal seen below $28781.
  • The RSI remains below 50 indicating a bearish market.
  • The price is now trading below its pivot levels of $26998.
  • The short-term range is strongly BEARISH.

Bitcoin: Bearish Reversal Seen Below $28781

The price of Bitcoin was unable to cross the $29000 handle and we can see a sharp drop in the price which is now ranging below the $27000 level.

We are expecting more downsides in the range of $26000 and $25500 after which some market consolidation can be seen.

We can see the formation of the moving average bearish crossover pattern with the adaptive moving averages AMA50 and AMA100 in the daily time frame.

We have also detected the formation of a bearish Harami pattern in the 1-hour time frame.

The immediate short-term outlook for bitcoin is strongly bearish, the medium-term outlook has turned bearish, and the long-term outlook remains neutral under present market conditions.

Bitcoin’s support zone is located at $25261 which is a 38.2% retracement from a 4-week high, and at $26013 which is a 14-3 day raw stochastic at 70%.

The price of BTCUSD is now facing its classic support level of 26880 and Fibonacci support level of 26966 after which the path towards 26000 will get cleared.

In the last 24hrs, BTCUSD has decreased by 3.75% by 1045.42$ and has a 24hr trading volume of USD 18.647 billion. We can see an increase of 28.44% in the trading volume compared to yesterday, which appears to be normal.

The Week Ahead

We can see that bitcoin has changed tracks and is now moving under a continuous bearish pressure below the $27000 level.

The immediate target expected is $26000 after which we can see some consolidation in the zone of $25500 level.

The daily RSI is printing at 57.25 which indicates a neutral demand for bitcoin and the shift towards the consolidation phase in the medium-term range.

We can see the formation of a bearish trend line from $28781 towards the $26647 level.

The price of BTCUSD is now facing its resistance zone located at $27966 which is a 38.2% retracement from its 52-week low, and at $28029 3-10 day MACD oscillator stalls.

The weekly outlook is projected at $26000 with a consolidation zone of $25500.

VIEW FULL ANALYSIS VISIT - FXOpen Blog…

Disclaimer: This Forecast represents FXOpen Companies opinion only, it should not be construed as an offer, invitation or recommendation in respect to FXOpen Companies products and services or as Financial Advice.

EUR/USD Gains Bullish Momentum While USD/CHF Eyes Recovery


EUR/USD started a major increase above the 1.0800 resistance. USD/CHF is rising and might aim more gains above the 0.9220 resistance.

Important Takeaways for EUR/USD and USD/CHF

· The Euro started a fresh increase from the 1.0720 support against the US Dollar.

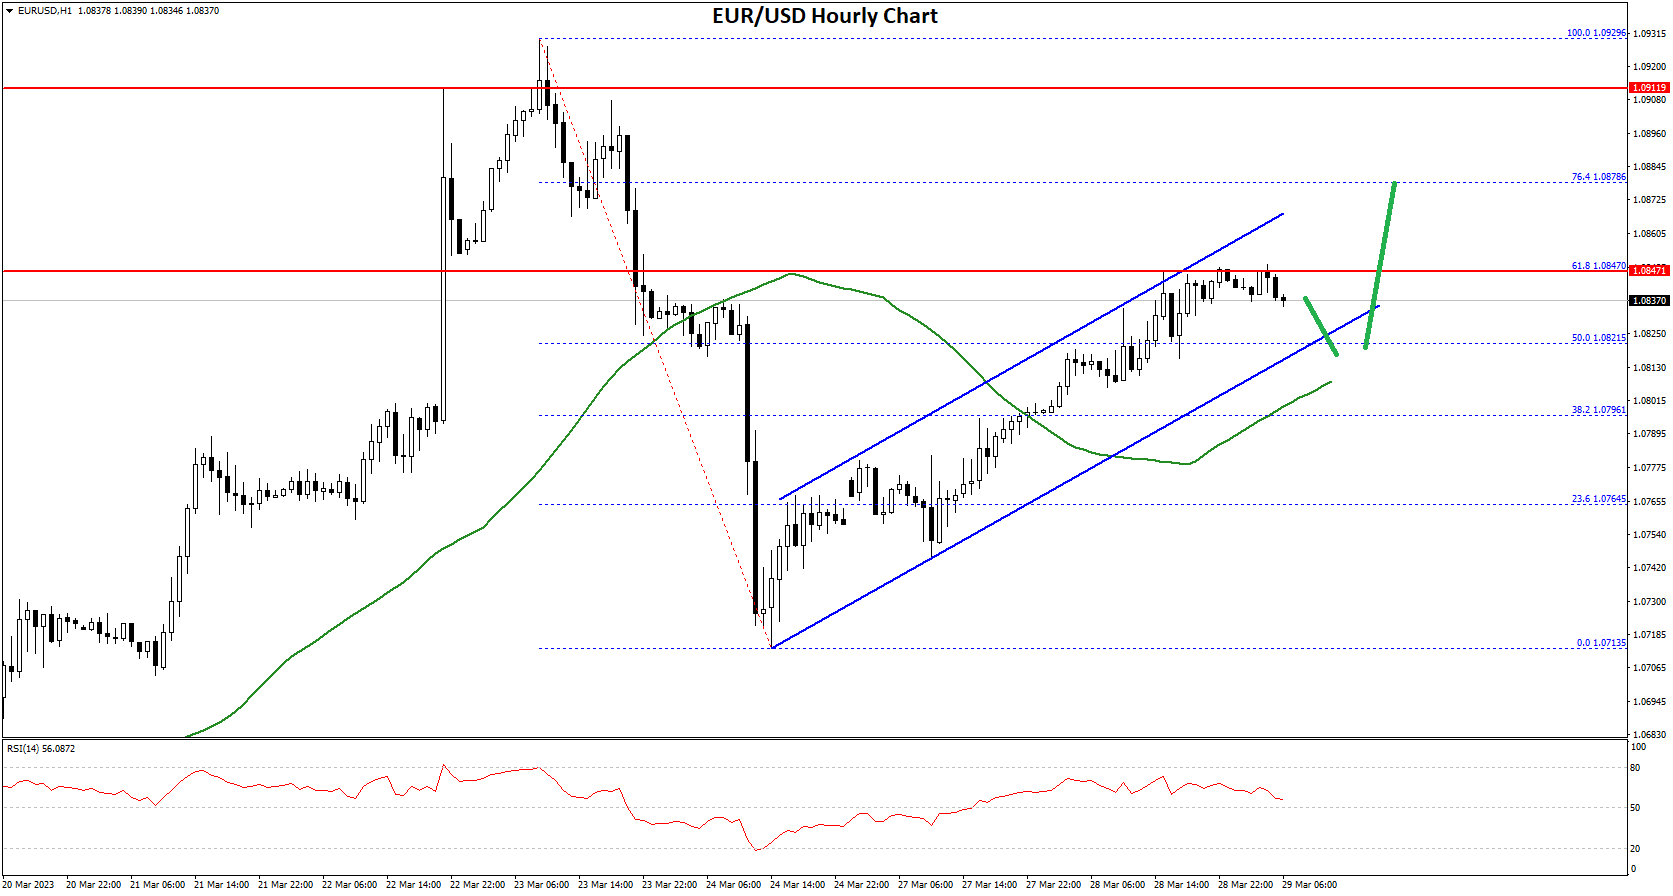
· There is a key rising channel forming with support near 1.0830 on the hourly chart of EUR/USD.

· USD/CHF started a fresh increase above the 0.9150 resistance zone.

· There was a break above a major bearish trend line with resistance near 0.9175 on the hourly chart.

EUR/USD Technical Analysis

After a steady decline, the Euro found support near the 1.0720 zone against the US Dollar. The EUR/USD pair formed a base above the 1.0720 level and started a fresh increase.

There was a clear move above the 1.0750 and 1.0760 resistance levels. The pair was able to clear the 50% Fib retracement level of the downward move from the 1.0929 swing high to 1.0713 low (formed on FXOpen). It is now trading above the 1.0800 level and the 50 hourly simple moving average.

EUR/USD Hourly Chart

An immediate resistance is near the 1.0850 level. It is near the 61.8% Fib retracement level of the downward move from the 1.0929 swing high to 1.0713 low.

The next major resistance is near the 1.0880 level. A clear move above the 1.0880 resistance zone could send the pair further higher towards 1.0920. Any more gains might open the doors for a move towards the 1.1000 level.

If there is no move above 1.0850 recovery, the pair might start a fresh decline. On the downside, an immediate support is near the 1.0830 level. There is also a key rising channel forming with support near 1.0830 on the hourly chart of EUR/USD.

The next major support is near the 1.0800 level. A downside break below the 1.0800 support could start steady decline towards the 1.0750 level.

VIEW FULL ANALYSIS VISIT - FXOpen Blog…

Disclaimer: This Forecast represents FXOpen Companies opinion only, it should not be construed as an offer, invitation or recommendation in respect to FXOpen Companies products and services or as Financial Advice.

ETHUSD and LTCUSD Technical Analysis – 30th MAR, 2023

ETHUSD: Bullish HARAMI Pattern Above $1687

Ethereum was unable to sustain its bearish momentum, and after touching a low of $1687 on 27th Mar, the prices started to correct upwards against the US dollar touching a high of $1829 today in the Asian trading session.

We have seen a bullish opening of the markets this week.

The price of Ethereum is ranging near a new record high of 1 month.

We can clearly see a bullish Harami pattern above the $1687 handle which is a bullish pattern and signifies the end of a bearish phase and the start of a bullish phase in the markets.

ETH is now trading just above its pivot level of 1798 and is moving into a mildly bullish channel. The price of ETHUSD is now testing its classic resistance level of 1803 and Fibonacci resistance level of 1806 after which the path towards 1850 will get cleared.

We can see the formation of both bullish Harami and bullish Harami cross patterns in the 2-hour time frame.

The relative strength index is at 53.40 indicating a strong demand for Ether and the continuation of the buying pressure in the markets.

Both the STOCH and STOCHRSI are giving a neutral signal, which means that the prices are expected to enter into a consolidation phase in the short-term range.

Some of the technical indicators are giving a buy market signal.

Most of the moving averages are giving a buy signal at the current market levels of $1800.

ETH is now trading above both the 200 hourly simple and 200 hourly exponential moving averages.

  • Ether: bullish reversal seen above the $1687 mark.
  • The short-term range appears to be mildly bullish.
  • ETH continues to remain above the $1750 level.
  • The average true range is indicating high market volatility.

Ether: Bullish Reversal Seen Above $1687

ETHUSD is now testing to cross the $1900 levels and the current momentum suggests that we are now moving towards the $1850 level.

We can see the formation of bullish engulfing lines in the weekly time frame.

The price is back over the pivot point in the weekly time frame indicating bullish trends.

We can see the formation of moving average bullish crossover patterns MA20 and MA50 in the 4-hourly time frame.

We have also seen an upside gap in the 15-minute timeframe which indicates the bullish nature of the markets.

ETHUSD touched an intraday high of 1829 and an intraday low of 1774 in the Asian trading session today.

The key support levels to watch are $1744, at which the price crosses the 9-day moving average stalls, and $1769 at which the price crosses the 9-day moving average.

ETH has decreased by 0.92% with a price change of 16.80$ in the past 24hrs and has a trading volume of 9.457 billion USD.

We can see a decrease of 6.37% in the total trading volume in the last 24 hrs which appears to be normal.

The Week Ahead

ETH is facing stiff resistance at crossing the $1850 handle after which the next visible targets are located at $1900 and $1950.

We can see the formation of a major bullish trend line with the support located at $1679 at which the price crosses the 18-day moving average.

We can see the formation of a bullish ascending channel from $1687 towards the $1852 level.

The immediate short-term outlook for Ether has turned mildly bullish, the medium-term outlook has turned bullish, and the long-term outlook for Ether is neutral under present market conditions.

The resistance zone is located at $1830 which is a pivot point 1st resistance point and at $1913 which is a 38.2% retracement from a 52-week low.

The weekly outlook is projected at $1950 with a consolidation zone of $1900.

VIEW FULL ANALYSIS VISIT - FXOpen Blog…

Disclaimer: This Forecast represents FXOpen Companies opinion only, it should not be construed as an offer, invitation or recommendation in respect to FXOpen Companies products and services or as Financial Advice.

AUD/USD and NZD/USD Could Gain Bullish Momentum


AUD/USD started a fresh increase above the 0.6700 resistance zone. NZD/USD is rising and might aim a move above the 0.6300 resistance.

Important Takeaways for AUD/USD and NZD/USD

· The Aussie Dollar started a fresh increase above the 0.6700 resistance against the US Dollar.

· There was a break above a major bearish trend line with resistance near 0.6692 on the hourly chart of AUD/USD.

· NZD/USD started a decent increase above the 0.6250 resistance zone.

· There was a clear move above a key bearish trend line with resistance near 0.6265 on the hourly chart of NZD/USD.

AUD/USD Technical Analysis

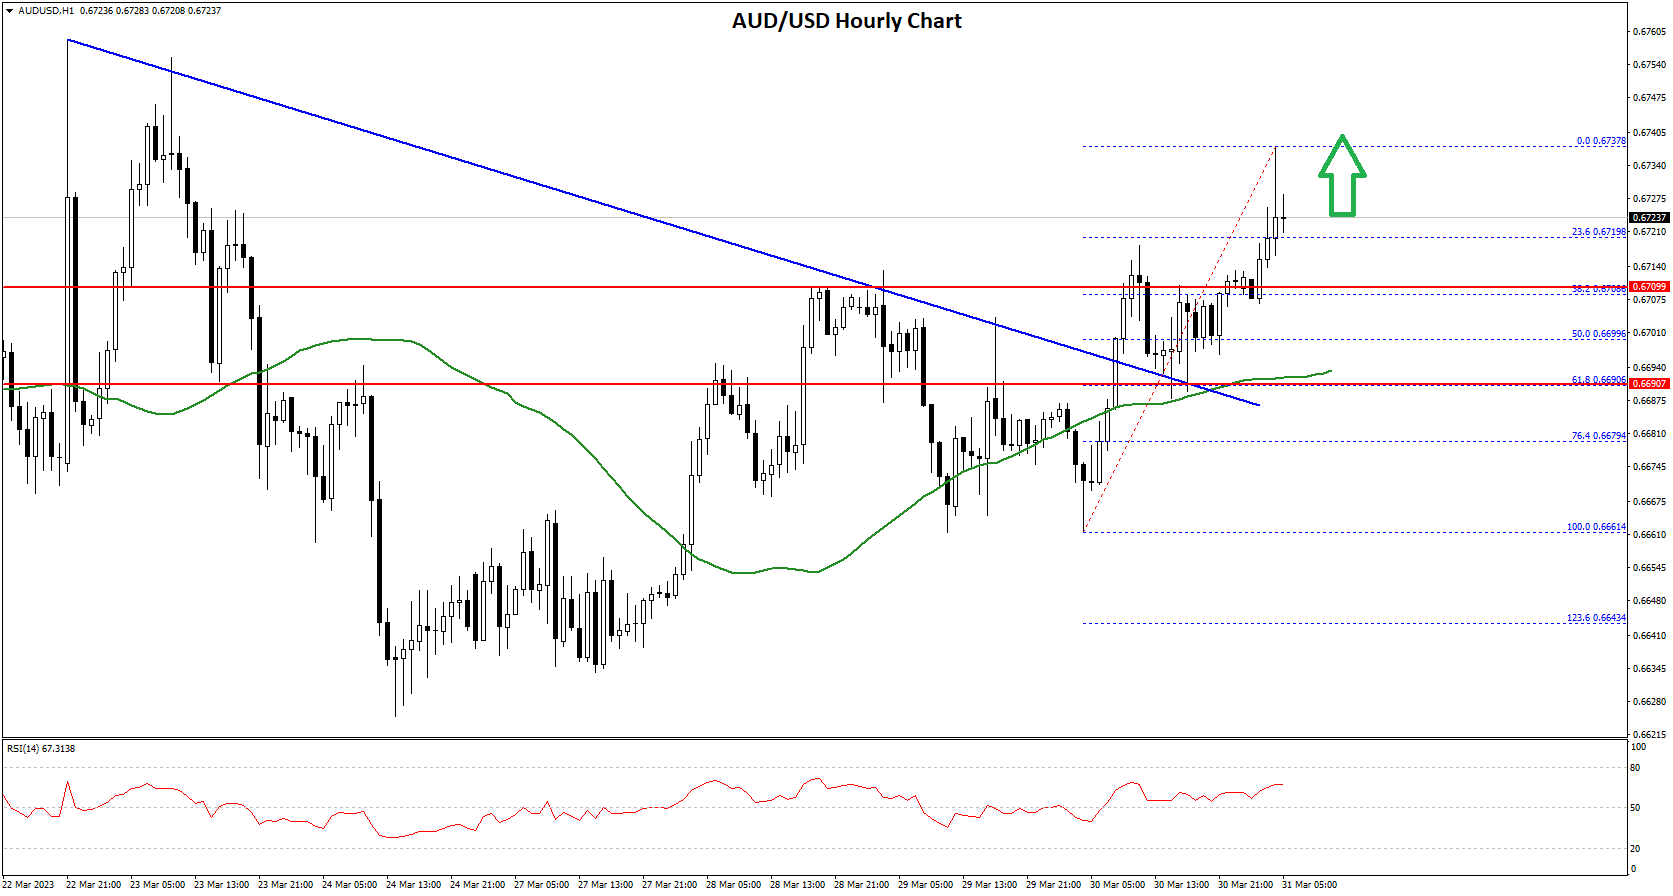
The Aussie Dollar found support near 0.6620 and started a decent increase against the US Dollar. The AUD/USD pair gained pace for a move above the 0.6650 resistance.

The pair even moved above the 0.6685 level and the 50 hourly simple moving average. There was a break above a major bearish trend line with resistance near 0.6692 on the hourly chart of AUD/USD. The bulls were able to pump the pair above 0.6720 and the 50 hourly simple moving average.

AUD/USD Hourly Chart

A high is formed near 0.6737 on FXOpen and the pair is now consolidating gains. On the downside, an initial support is near the 0.6720 level. It is near the 23.6% Fib retracement level of the recent increase from the 0.6661 swing low to 0.6737 high.

The next support could be the 0.6700 level or the 50 hourly simple moving average or the 50% Fib retracement level of the recent increase from the 0.6661 swing low to 0.6737 high.

If there is a downside break below the 0.6700 support, the pair could extend its decline towards the 0.6650 level. On the upside, the AUD/USD pair is facing resistance near the 0.6740 level. The next major resistance is near the 0.6780 level.

A close above the 0.6780 level could start another steady increase in the near term. The next major resistance could be 0.6850.

VIEW FULL ANALYSIS VISIT - FXOpen Blog…

Disclaimer: This Forecast represents FXOpen Companies opinion only, it should not be construed as an offer, invitation or recommendation in respect to FXOpen Companies products and services or as Financial Advice.

Watch FXOpen’s March 27 - 31 Weekly Market Wrap Video

In this video, FXOpen UK COO Gary Thomson sums up the week’s happenings and discusses the most significant news reports.

  • UK inflation: Is the end in sight?
  • Nasdaq storms psychological level near highs of the year
  • Rapid oil recovery
  • How Bitcoin reacted to the CFTC lawsuit against Binance

Watch our short and informative video, and stay updated with FXOpen.

FXOpen YouTube

Disclaimer: This forecast represents FXOpen Companies opinion only, it should not be construed as an offer, invitation or recommendation in respect to FXOpen Companies products and services or as financial advice.

#fxopen #fxopenyoutube #fxopenuk #weeklyvideo

GBP/USD And GBP/JPY Aims More Upsides

GBP/USD climbed higher above the 1.2200 resistance zone. GBP/JPY could rise further if there is a clear move above the 165.70 resistance.

Important Takeaways for GBP/USD and GBP/JPY

· The British Pound is moving higher above 1.2300 against the US Dollar.

· There was a break above a major bearish trend line with resistance near 1.2180 on the daily chart of GBP/USD.

· GBP/JPY is showing a lot of bullish signs above the 162.50 support.

· There was a break above a key contracting triangle with resistance near 162.65 on the daily chart.

GBP/USD Technical Analysis

This past week, the British Pound formed a base above the 1.1800 zone against the US Dollar. The GBP/USD pair started a steady increase above the 1.2000 resistance zone.

There was a clear move above the 1.2120 resistance zone and the 50-day simple moving average. The pair even climbed above the 1.2200 resistance. There was a was a break above a major bearish trend line with resistance near 1.2180 on the daily chart of GBP/USD.

GBP/USD Daily Chart

The pair even broke the 1.2350 level. A high is formed near 1.2420 on FXOpen and the pair is now consolidating gains.

An immediate support is near the 1.2180. It is near the 38.2% Fib retracement level of the upward move from the 1.1802 swing low to 1.2418 high. The next major support is near the 1.2120 and 1.2100 levels.

The 50% Fib retracement level of the upward move from the 1.1802 swing low to 1.2418 high is also near the 1.2100 zone. If there is a break below the 1.2100 support, the pair could test the 1.2000 support.

Any more losses might send GBP/USD towards 1.1920. An immediate resistance on the upside is near the 1.2440 level. The next major resistance is near the 1.2500 level, above which the pair could start a steady increase towards 1.2750.

An upside break above 1.2750 might start a fresh increase towards 1.2800. Any more gains might call for a move towards 1.2880 or even 1.2950.
VIEW FULL ANALYSIS VISIT - FXOpen Blog…

Disclaimer: This Forecast represents FXOpen Companies opinion only, it should not be construed as an offer, invitation or recommendation in respect to FXOpen Companies products and services or as Financial Advice.

ANZ Bank does away with cash; Australian Dollar responds with volatility

There are those who look forward to the day when the entire society in which they live goes completely cashless, and there are those who regard such a possibility with absolute dread.

Many nations with developed and advanced financial markets ecosystems are now heading toward the next stage in the implementation of a fully digital ecosystem, and in a lot of cases, their respective governments and central issuers of fiat currency are talking about the implementation of what is known as CDBCs, an acronym that stands for Central Bank Digital Currencies.

Central Bank Digital Currencies are effectively digital versions of existing sovereign currency, and many nations in Europe, North America, and South East Asia are looking at developing them and rolling them out. Australia is one such nation.

Whilst the rollout of such CDBCs has not taken place yet, there is more than a degree of speculation regarding the possibility of such a move being made by the Australian central bank, the Reserve Bank of Australia.

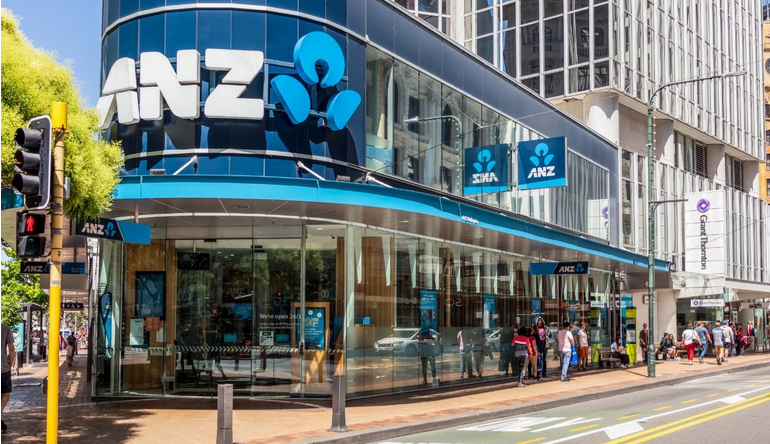
This speculation is being fueled by a recent move by ANZ Bank, one of Australia’s largest Tier 1 financial institutions and the country’s largest institutional and corporate bank.

At the end of last week, ANZ Bank announced that it would cease facilitating withdrawals and deposits from a number of its Australian branches on a permanent basis.

The bank advised that those wishing to access cash rather than use electronic transfers, debit/credit cards, or contactless systems should look toward using ATMs (automated cash machines), which are operated by ANZ Bank as well as independent operators and other banks across Australia, as ANZ’s customers will no longer be able to withdraw cash from their accounts inside branches.

Whilst this move means that ANZ Bank customers will still be able to withdraw and deposit cash via the ATM machines, the number of machines operated by banks across Australia, including ANZ, has been decreasing as they become decommissioned over recent years.

Whilst ANZ Bank’s move may well appear to be sensible and look toward a more efficient future in which most transactions are either carried out online, via a card payment, or contactless payment device rather than using physical cash, there is a seed of concern that has been sewn that this is a step toward the implementation of CDBCs and their perceived potentially authoritarian nature.

Groups which disapprove of the development by governments and central banks with regard to CDBC development believe that privacy could be diminished if all transactions are done digitally and that governments could use the digital nature of fiat currencies to ensure compliance with government agendas and doctrines by being able to ‘turn the money off’ if someone does not do as they are told.

Indeed, one of ANZ’s reasons for ceasing to offer cash in many of its branches is that the lockdowns enforced by the government throughout 2020 and 2021 in Australia, which was subject to one of the most strict lockdowns in the world, caused people to use much less physical cash and that ANZ is just moving with the times.

VIEW FULL ANALYSIS VISIT - FXOpen Blog…

Disclaimer: This Forecast represents FXOpen Companies opinion only, it should not be construed as an offer, invitation or recommendation in respect to FXOpen Companies products and services or as Financial Advice.

BTCUSD and XRPUSD Technical Analysis – 04th APR 2023

BTCUSD – Hammer Pattern Is Above $26,529

Last week, the bearish momentum in Bitcoin price didn’t sustain, and after touching the low of $26,529 on 27th March, the prices started to correct upwards against the US Dollar and touched the high of $29,171 on 30th March.

At the beginning of the week, Bitcoin is ranging near a NEW record 1-month high. We can clearly see a hammer pattern above $26,529, which signals a downtrend reversal.

Bitcoin touched an intraday low of $27,244 in the Asian trading session and an intraday high of $28,144 in the European trading session today.

The Williams percent range indicator is back over -50 in the daily timeframe, indicating a bullish trend.

Both the STOCH and STOCHRSI are reflecting overbought conditions, which means that in the immediate short term, a decline in the prices is expected.

The price is back over the pivot point in the daily timeframe, which stands for the bullish nature of the markets.

The relative strength index is near 53, which is a sign of a NEUTRAL demand for Bitcoin and a shift towards the consolidation phase in the markets.

Bitcoin is above a 200-hour simple moving average and above a 200-hour exponential moving average.

The average true range is indicating lower market volatility with a bullish momentum.

  • Bitcoin bullish reversal is seen above $26,529.
  • The RSI remains above 50, indicating a bullish market.
  • The price is now trading above its pivot level of $28,028.
  • Short-term range is moderate BULLISH.
  • Some major technical indicators signal that the price may move to $28,500 and $29,000 soon.

Bitcoin Bullish Reversal Seen Above $26,529

The prices of Bitcoin have been successful in crossing the $29,000 resistance, and now we are looking for fresh upsides in the range of $30,000 and $32,000.

With the continued support seen at lower levels, we can see the formation of an ascending channel which may push the prices of Bitcoin above $30,000.

There is also a bullish crossover pattern with the 20-period and 50-period adaptive moving averages in the 4-hour timeframe.

A support zone is located at $26,547, where the price crosses the 18-day moving average, and at $27,144, which is the first support of the pivot point indicator.

BTCUSD is now facing its classic resistance level of $28,188 and Fibonacci resistance level of $28,286, breaking which the price will be able to move to $29,000.

There is an increase of 31.90% in the daily trading volume, which is normal. The short-term outlook for Bitcoin is bullish, the medium-term outlook has turned bullish, and the long-term outlook remains neutral under present market conditions.

The Week Ahead

We can see that Bitcoin has now resumed its long-term uptrend with the current support at $16,538 formed on 1st January 2023, which marked the end of the crypto winter.

Now the price of Bitcoin is ranging near the triangle’s support in the 1-hour chart, reflecting bullish sentiment.

The immediate expected target is $30,000, after which we may see some consolidation in the zone of the $29,500 level.

Daily RSI is at 59.72, which indicates a NEUTRAL demand for Bitcoin and the shift towards the consolidation phase in the medium-term range.

We can see the formation of a bullish trendline from $26,529 to $28,771.

The BTCUSD is now facing resistance at $29,147, which is a 13-week high, and at $30,471, which corresponds to a 14-day RSI at 70.

VIEW FULL ANALYSIS VISIT - FXOpen Blog…

Disclaimer: This Forecast represents FXOpen Companies opinion only, it should not be construed as an offer, invitation or recommendation in respect to FXOpen Companies products and services or as Financial Advice.

GBP soars against the Japanese Yen despite low rates remaining in place

Japan’s economy has been regarded ever since the 1960s as an absolute lesson in socio-economic advancement to the extent that the entire world views Japanese products, cuisine, intellect and culture among the most enviable globally.

One particular Japanese motor manufacturer has used the slogan “The relentless pursuit of perfection” in its marketing to Western customers, and Japan’s contribution to science, technology and consumer lifestyle trappings has been enormous for over six decades now.

Japan is in the top 3 economies by nominal GDP, after the United States and China, and the fourth-largest economy by PPP (purchasing power parity). In 2020, Japan was ranked eighth among the countries with the largest labour force, having 66.5 million workers.

The Yen, Japan’s sovereign currency, may have experienced a lot of volatility over recent times, and there is no doubt that it has faced competition from even larger nations such as China and India, which are rapidly becoming huge tours de force in their own right, China’s economy being by very far the largest in the world, and neighbouring nations in the Asia Pacific region such as Thailand and South Korea being homes to some very high volume manufacturing of everything from televisions and kitchen appliances to motor vehicles.

Japan remains utterly focused on its core industries, and its export market is as buoyant as ever; however, there have been a lot of metrics that show lower capacity and a country that has struggled with high costs compared to that of its neighbours.

On April 5th, the central bank of Japan published data reflecting that the country’s economic output was below full capacity for the 11th consecutive quarter from October to December 2022, so the BOJ will unlikely end its ultra-low interest rates policy.

The British Pound rose considerably against the Yen late last week in the advent of such figures, showing that investors and traders expected such an outcome.

This morning, the depreciation of the Yen against western majors, including the Pound, has slowed, and the Pound is trading at 164.10 to the Yen.

VIEW FULL ANALYSIS VISIT - FXOpen Blog…

Disclaimer: This Forecast represents FXOpen Companies opinion only, it should not be construed as an offer, invitation or recommendation in respect to FXOpen Companies products and services or as Financial Advice.
ETHUSD Technical Analysis – 06th APR, 2023

ETHUSD – Hammer Pattern Is Above $1,763

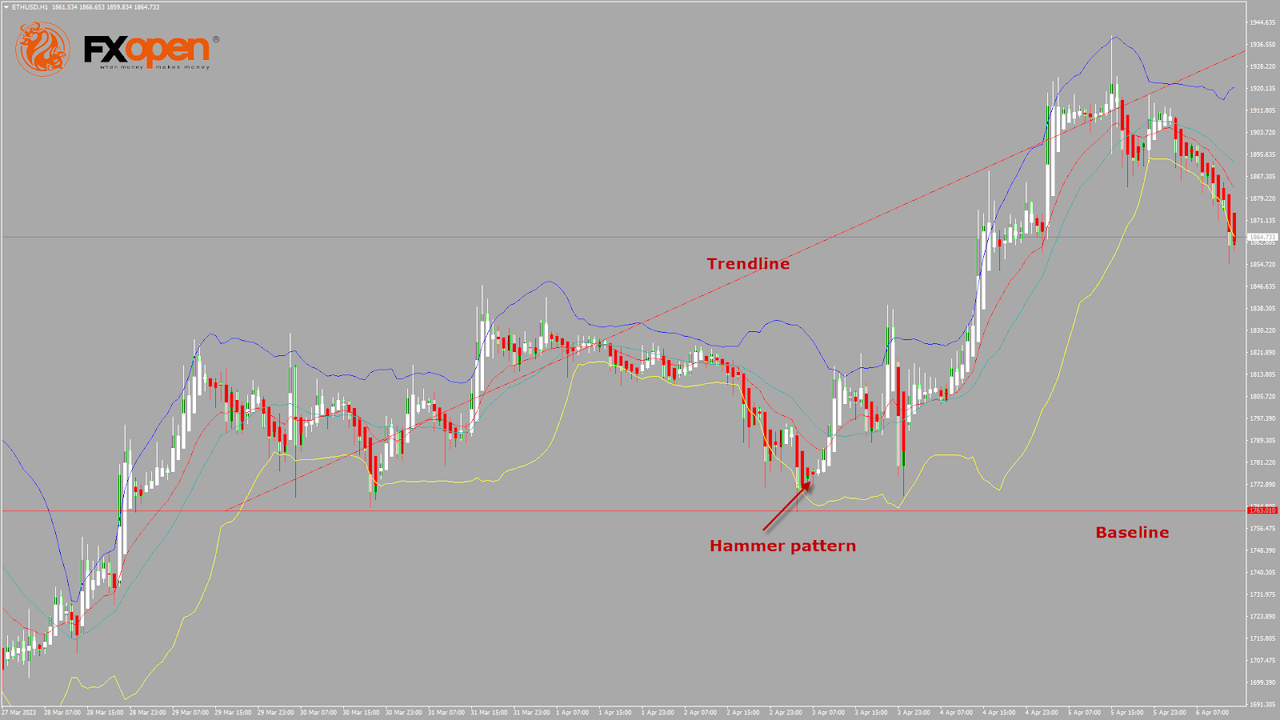
Bears couldn’t keep control of the market, and after touching a low of $1,763 on 03rd April, the ETH/USD pair started to correct upwards, touching a high of $1,939 on 05th April.

ETHUSD is now moving under bearish pressure after touching a high of $1,939 on 05th April. The immediate bearish pressure suggests we will enter a consolidation phase above the $1,850 level.

A hammer pattern is above the $1,763 handle. It’s a bullish pattern, which signifies the end of a bearish phase. Also, we can see the formation of the morning star pattern.

The price is above the Ichimoku cloud, indicating a bullish nature of the market. Moreover, Ethereum is near the support of the channel.

The relative strength index is at 56.91, indicating a strong demand for Ether and a continuation of the buying pressure in the markets.

The average directional index and commodity channel index give a neutral signal, meaning that the price is expected to enter into a consolidation phase in the short-term range.

Some of the technical indicators are giving a bullish market signal. Most moving averages are giving a bullish signal at the current market level of $1,866.

ETH is now trading above the 200-hour simple and 200-hour exponential moving averages.

  • Ether bullish reversal is seen above the $1,763 mark.
  • The short-term range is expected to be mildly bullish.
  • The average true range indicates high market volatility.

VIEW FULL ANALYSIS VISIT - FXOpen Blog…

Disclaimer: This Forecast represents FXOpen Companies opinion only, it should not be construed as an offer, invitation or recommendation in respect to FXOpen Companies products and services or as Financial Advice.
LTCUSD Technical Analysis – 06th APR, 2023

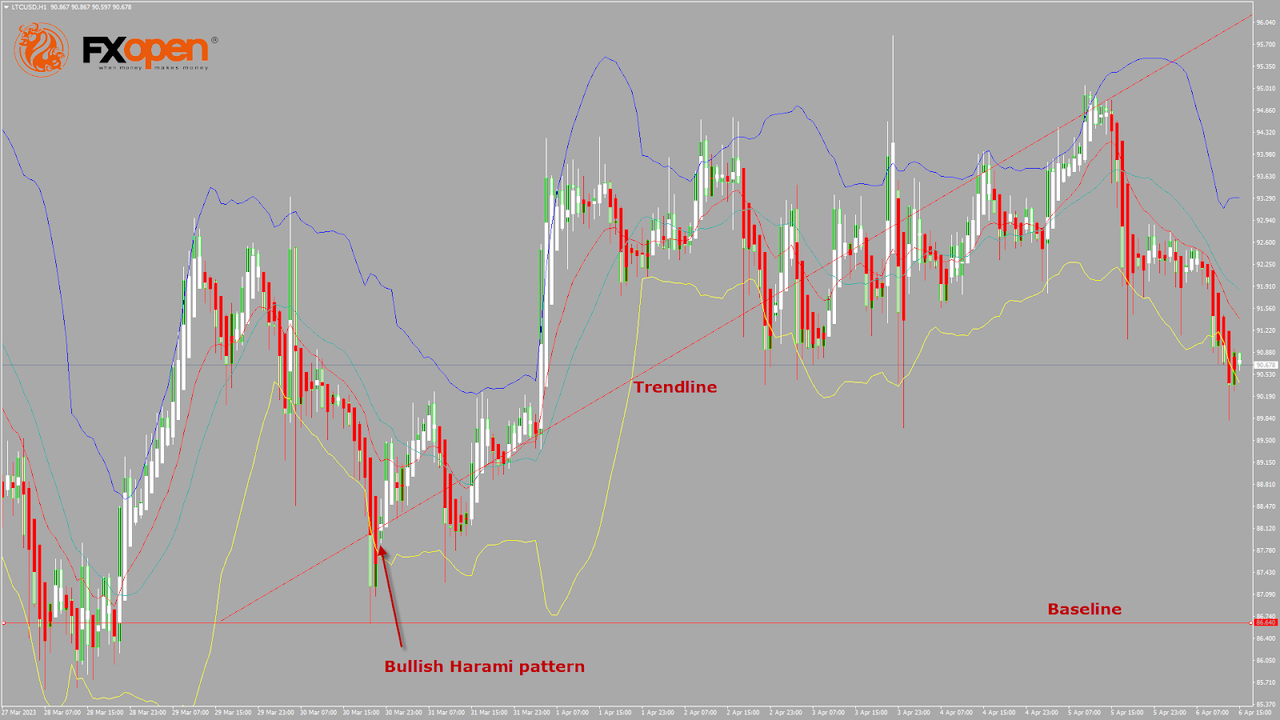
LTCUSD – Bullish Harami Pattern Is Above $86.64

Bears couldn’t pull the market further down last week, and after touching a low of $86.64 on 30th March, the prices started to correct upwards against the US Dollar, touching a high of $94.91 on 03rd April.

We have seen a bullish opening of the markets this week.

We can see a bullish harami pattern above the $86.64 handle. It signifies the end of a bearish phase and the start of a bullish phase in the market.

The price of Litecoin is near the channel’s support, indicating upcoming bullish movement. Also, Litecoin is trading above its 100-hour simple moving average and 100-hour exponential moving average, and it’s above the pivot level of $92.93.

The relative strength index is at $52.50, indicating a neutral demand for Litecoin and a shift towards the market consolidation phase.

The prices of Litecoin continue to remain above some of the moving averages, which are giving a bullish signal at current market levels of $90.65

Both the Williams percent range and commodity channel index are signalling neutral market conditions, which means that the price is expected to remain in a consolidation phase in the short-term range.

The short-term outlook for Litecoin has turned mildly bullish.

  • Some of the technical indicators are giving a bullish signal.
  • Litecoin bullish reversal is seen above the $86.64 level.
  • The RSI gives a neutral signal.
  • The average true range indicates low market volatility.

VIEW FULL ANALYSIS VISIT - FXOpen Blog…

Disclaimer: This Forecast represents FXOpen Companies opinion only, it should not be construed as an offer, invitation or recommendation in respect to FXOpen Companies products and services or as Financial Advice.

GBP/USD And GBP/JPY Could Aim for Another Increase

.
GBP/USD started a downside correction from the 1.2520 resistance zone. GBP/JPY is rising and might aim for more upsides above the 164.00 resistance.

Important Takeaways for GBP/USD and GBP/JPY

  • The British Pound failed to break above the 1.2520 resistance and corrected lower against the US Dollar.
  • There is a key bearish trend line forming with resistance near 1.2460 on the hourly chart of GBP/USD.
  • GBP/JPY is slowly moving higher from the 163.00 zone.
  • There is a key rising channel forming with support near 163.75 on the hourly chart.

GBP/USD Technical Analysis

This past week, the British Pound formed a base above the 1.2400 line against the US Dollar. The GBP/USD pair started a steady increase above the 1.2425 resistance.

There was a move above the 50-hour simple moving average at 1.2460. It resulted in a break above the 1.2500 level. However, the bears were active near the 1.2520 resistance zone. A high was formed near 1.2525, and the pair started a downside correction.

There was a break below the 23.6% Fib retracement level of the upward move from the 1.2274 swing low to the 1.2525 high. GBP/USD even settled below the 50-hour simple moving average.

The previous resistance at 1.2425 is now acting as a support. The next major support is near the 1.2400 level, which coincides with the 50% Fib retracement level of the upward move from the 1.2274 swing low to the 1.2525 high.

If there is a break below the 1.2400 support, the pair will substantially decline. In the stated case, there is a risk of a drop toward the 1.2330 level or the 1.2274 low in the coming days.

Conversely, the pair might attempt a fresh increase from the 1.2425 support. Resistance on the upside is near the 50-hour simple moving average at 1.2455. There is also a key bearish trend line forming with resistance near 1.2460 on the hourly chart of GBP/USD.

A close above the trend line resistance could stage a fresh increase. The hourly RSI is also moving higher and approaching 50, above which it might signal a decent increase. The next major resistance is near the 1.2500 level, above which the pair could revisit the 1.2520 resistance region. Any more gains might call for a move toward 1.2600.

VIEW FULL ANALYSIS VISIT - FXOpen Blog…

Disclaimer: This Forecast represents FXOpen Companies opinion only, it should not be construed as an offer, invitation or recommendation in respect to FXOpen Companies products and services or as Financial Advice.

EUR/USD Aims Fresh Increase While EUR/JPY Eyes More Upsides

EUR/USD is consolidating above the key 1.0880 support zone. EUR/JPY is rising and might rally further if it clears the 145.40 resistance zone.

Important Takeaways for EUR/USD and EUR/JPY

  • The Euro started a downside correction from the 1.0970 zone.
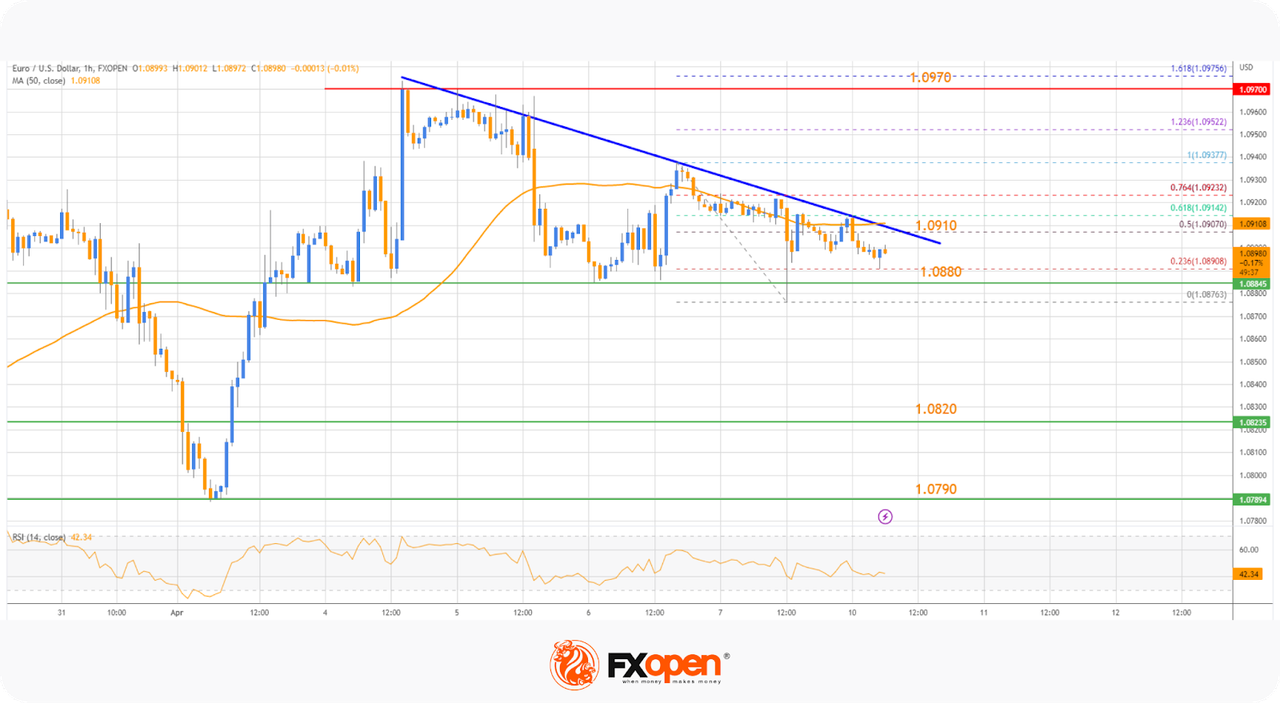
  • There is a key bearish trend line forming with resistance near 1.0910 on the hourly chart at FXOpen.
  • EUR/JPY started a steady increase after it found support near 142.50.
  • There is a major bullish trend line forming with support near 144.20 on the hourly chart.

EUR/USD Technical Analysis

On the hourly chart of EUR/USD, the Euro remained well-bid above the 1.0880 zone and started a fresh increase against the US Dollar. EUR/USD was able to break above the 1.0920 resistance level.

The pair tested the 1.0970 zone before it started a correction. There was a break below the 1.0920 level, but the bulls were active near the key 1.0880 support. A low is formed at 1.0876, and the pair is now consolidating.


Immediate resistance is near the 1.0910 level. Besides, there is a key bearish trendline forming with resistance near 1.0910. The trendline is close to the 50% Fib retracement level of the downward move from the 1.0937 swing high to the 1.0876 low.

The next major resistance is near the 76.4% Fib retracement level at 1.0925. A clear move above the 1.0925 level might send the pair toward the 1.0970 level. Any more gains could set the pace for a test of 1.1000.

On the downside, the pair might find support near the 1.0880 level. The next major support sits near the 1.0820 level, below which the pair could even test the 1.0790 support zone.

If there is a downside break below the 1.0790 support, the pair might accelerate lower in the coming days. In the stated case, it could even test 1.0720.
VIEW FULL ANALYSIS VISIT - FXOpen Blog…

Disclaimer: This Forecast represents FXOpen Companies opinion only, it should not be construed as an offer, invitation or recommendation in respect to FXOpen Companies products and services or as Financial Advice.

Tech stocks are back in vogue as a sudden rally grabs the attention

For almost two years, there has been tremendous volatility within stocks of technology companies – mostly those with headquarters in Silicon Valley – which are listed on the NASDAQ exchange in New York and included in the S&P 500 index, which tracks the performance of America’s best performing 500 publicly listed companies.

Since 2021, technology stocks have been suffering, and during the course of last year, a consistent downturn in value was recorded, much to the surprise of many, who considered internet-based e-commerce giants and online firms to have been relatively resilient to the effects of the lockdowns which took place across many Western countries during 2020 and 2021 as the world went online.

Perhaps it would have been more likely that stocks in traditional companies which produce physical products or require quantities of raw materials delivered to factories in order to manufacture which was greatly restricted during those times, and workforces that were not allowed into workplaces in order to produce and deliver items to paying customers or outlets would have suffered more.

Yes, Amazon and Google rocketed in value during the early to the middle part of 2020 while airline and hospitality firms listed on more traditional European exchanges such as London Stock Exchange fell, but that was short-lived.

The tech stock downturn that took place last year was surprising and long-lasting.

Now, however, things are back on track, and there appears to have been something of a rally.

Over the past 30 days, the S&P 500 index has risen from 3,861 to 4,090, with NASDAQ-listed tech stocks contributing to that in droves.

VIEW FULL ANALYSIS VISIT - FXOpen Blog…

Disclaimer: This Forecast represents FXOpen Companies opinion only, it should not be construed as an offer, invitation or recommendation in respect to FXOpen Companies products and services or as Financial Advice.
USDJPY: Are Bulls Trying to Revive the Long-Term Trend?

The USDJPY yesterday reached its highs of several weeks.

This was facilitated by:

→ a statement by the new head of the Bank of Japan, Kazuo Ueda, who made it clear that there is no need to rush to curtail the stimulus policy;

→ Friday’s US employment report, which strengthened expectations of the Fed’s interest rate hike in May. Unemployment fell to 3.5%, indicating the strength of the labour market. Trading on Tuesday, futures on the dollar index opened with a bullish gap;

→ US commercial bank deposits rose towards the end of March for the first time in about a month, a sign that the banking crisis is easing and the dollar is regaining confidence.

VIEW FULL ANALYSIS VISIT - FXOpen Blog…

Disclaimer: This Forecast represents FXOpen Companies opinion only, it should not be construed as an offer, invitation or recommendation in respect to FXOpen Companies products and services or as Financial Advice.

BTCUSD Technical Analysis – 11th APR 2023

Bitcoin continues its bullish momentum from last week, and after touching a low of $27,717 on April 6, we can see a bull run, which managed to push the prices of BTCUSD above the $30,000 handle today in the early European trading session.

The resistance of the channel is broken in the daily timeframe, indicating the strength of the bulls.

We can clearly see a hammer pattern above the $27,717 handle.

Bitcoin continues to move in a range-bound motion between the $29,800 and $30,200 levels, which is indicative of a consolidation phase in the markets.

Both the STOCH and Williams Percent Range indicate overbought levels, which means that in the immediate short term, a decline in the price is expected.

The relative strength index is at 74.02, indicating a strong demand for Bitcoin and the continuation of the buying pressure in the markets.

Bitcoin is now moving above its 100-hour simple moving average and above its 200-hour exponential moving average.

Most of the major technical indicators are giving a bullish signal, which means that in the immediate short term, we are expecting targets of $31,000 and $32,500.

The average true range indicates low market volatility with strong bullish momentum.

  • Bitcoin bullish continuation is seen above $27,717.
  • The RSI remains above 50, indicating a bullish market.
  • The price is now trading above its pivot level of $30,088.
  • The short-term range is strongly bullish.
  • Some major technical indicators signal that the price may move to $30,500 and $31,000 soon.

VIEW FULL ANALYSIS VISIT - FXOpen Blog…

Disclaimer: This Forecast represents FXOpen Companies opinion only, it should not be construed as an offer, invitation or recommendation in respect to FXOpen Companies products and services or as Financial Advice.