Daily Market Analysis By FXOpen

ETHUSD and LTCUSD Technical Analysis – 07th JULY, 2022

ETHUSD: Bullish Doji Star Pattern Above $1040

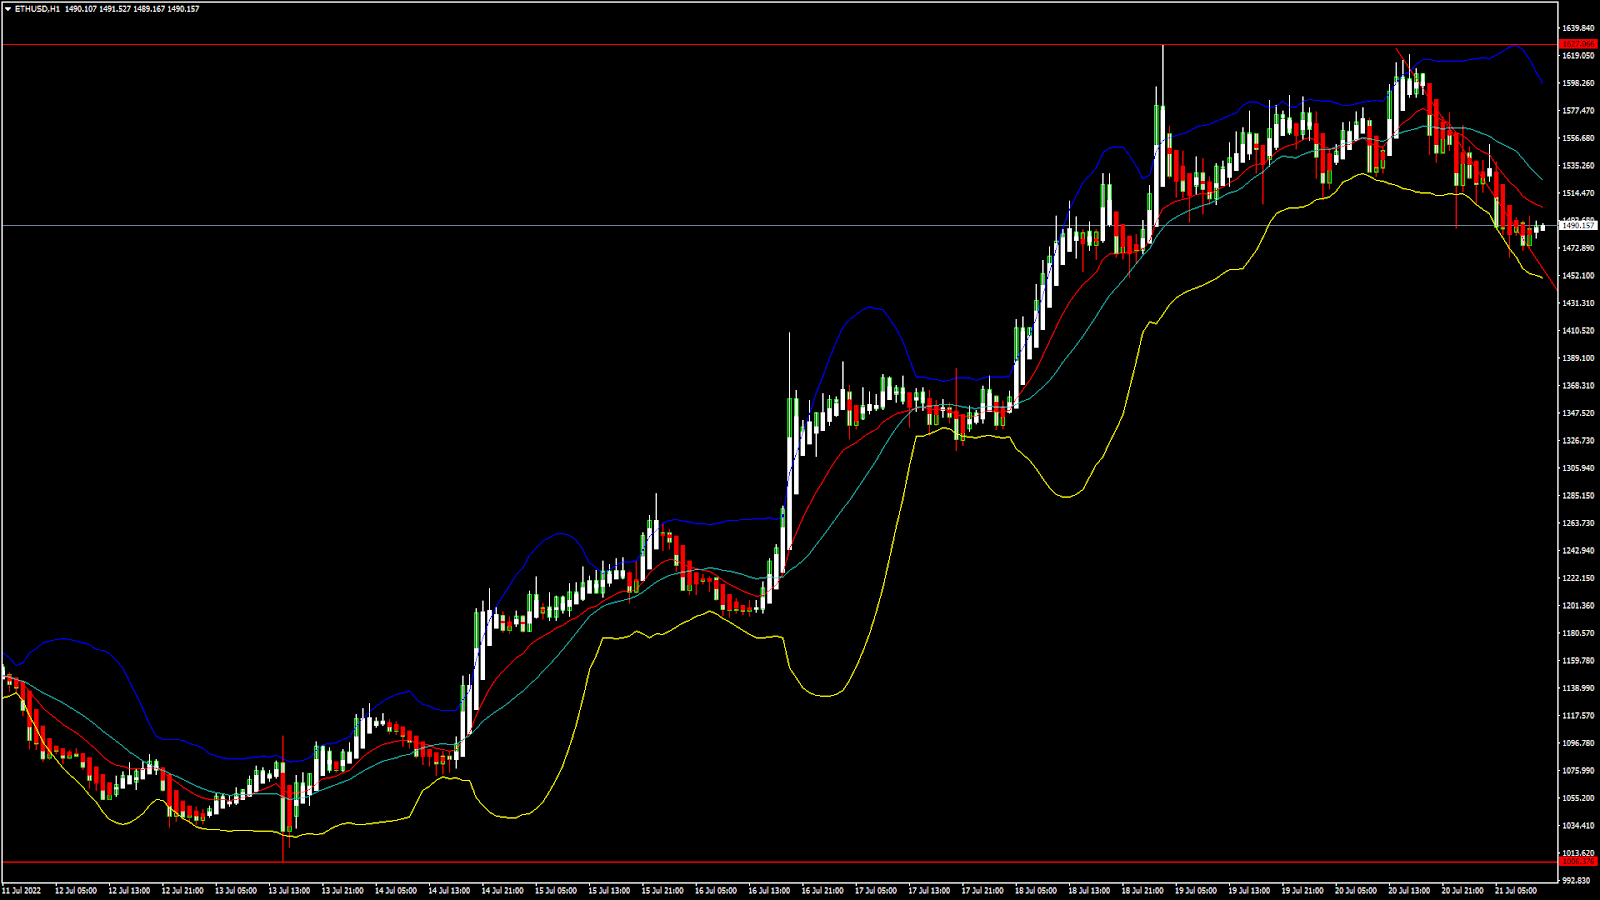
Ethereum has started its bullish momentum against the US dollar after moving into a consolidation channel last week and is now trading above the $1100 handle in the US trading session.

We can see a continued appreciation in the prices of Ethereum, mainly due to the buying seen at lower levels by the medium-term investors.

We can see the formation of a super trend in the 15-minute time frame above the $1100 handle, and now are looking at $1200 and $1250 as the immediate targets.

The prices touched an intraday low of $1155 in the Asian trading session and an intraday high of $1201 in the European trading session today.

We can clearly see a bullish doji star pattern above the $1040 handle which is a bullish pattern and signifies the end of a bearish phase and the start of a bullish phase in the markets.

ETH is now trading above its pivot level of 1182 and moving into a mildly bullish channel. The price of ETHUSD is now testing its classic resistance level of 1190 and Fibonacci resistance level of 1197 after which the path towards 1200 will get cleared.

The relative strength index is at 61 indicating a STRONG market and the continuation of the uptrend in the markets.

The STOCHRSI is indicating a NEUTRAL level, which means that the prices are expected to enter into a consolidation phase in the short-term range.

All of the technical indicators are giving a STRONG BUY market signal.

All of the moving averages are giving a STRONG BUY signal, and we are now looking at the levels of $1200 to $1250 in the short-term range.

ETH is now trading above its 100 hourly simple and exponential MAs.

  • Ether: bullish continuation seen above the $1040 mark
  • The short-term range appears to be mildly BULLISH
  • ETH continues to remain above the $1100 level
  • The average true range is indicating LESS market volatility

Ether: Bullish Continuation Seen Above $1040

ETHUSD is now moving into a mildly bullish channel with the prices trading above the $1100 handle in the European trading session today.

We have also detected the formation of an ascending contraction triangle pattern in the hourly time frame indicating that the price is likely to climb higher crossing the $1200 level.

We can see that the price of Ethereum is slowly recovering against the US dollar and continues to gain traction today.

The current price action is positive for the markets, and the prices are expected to remain above the $1200 levels in the US trading session today.

The key support levels to watch are $1100 and $1159, and the prices of ETHUSD need to remain above these levels for the continuation of the bullish trend.

ETH has decreased by 3.30% with a price change of 37$ in the past 24hrs and has a trading volume of 13.489 billion USD.

We can see a decrease of 20.16% in the total trading volume in the last 24 hrs. which appears to be normal.

The Week Ahead

The on-chain data shows that the number of ETH holders is increasing which suggests that the global user activity is at an all-time high leading to an increase in the global investor sentiment.

The prices of Ethereum continue to remain above the important psychological support level of $1100 and most of the technicals are now indicating a bullish market.

The immediate short-term outlook for Ether has turned strongly BULLISH; the medium-term outlook has turned NEUTRAL; and the long-term outlook for Ether is NEUTRAL in present market conditions.

This week, Ether is expected to move in a range between $1100 and $1300, and next week, it is expected to enter into a consolidation phase above $1200.

Technical Indicators:

The moving averages convergence divergence (12,26): at 9.93 indicating a BUY

The average directional change (14 days): at 33.57 indicating a BUY

The rate of price change: at 2.59 indicating a BUY

The ultimate oscillator: at 56.07 indicating a BUY

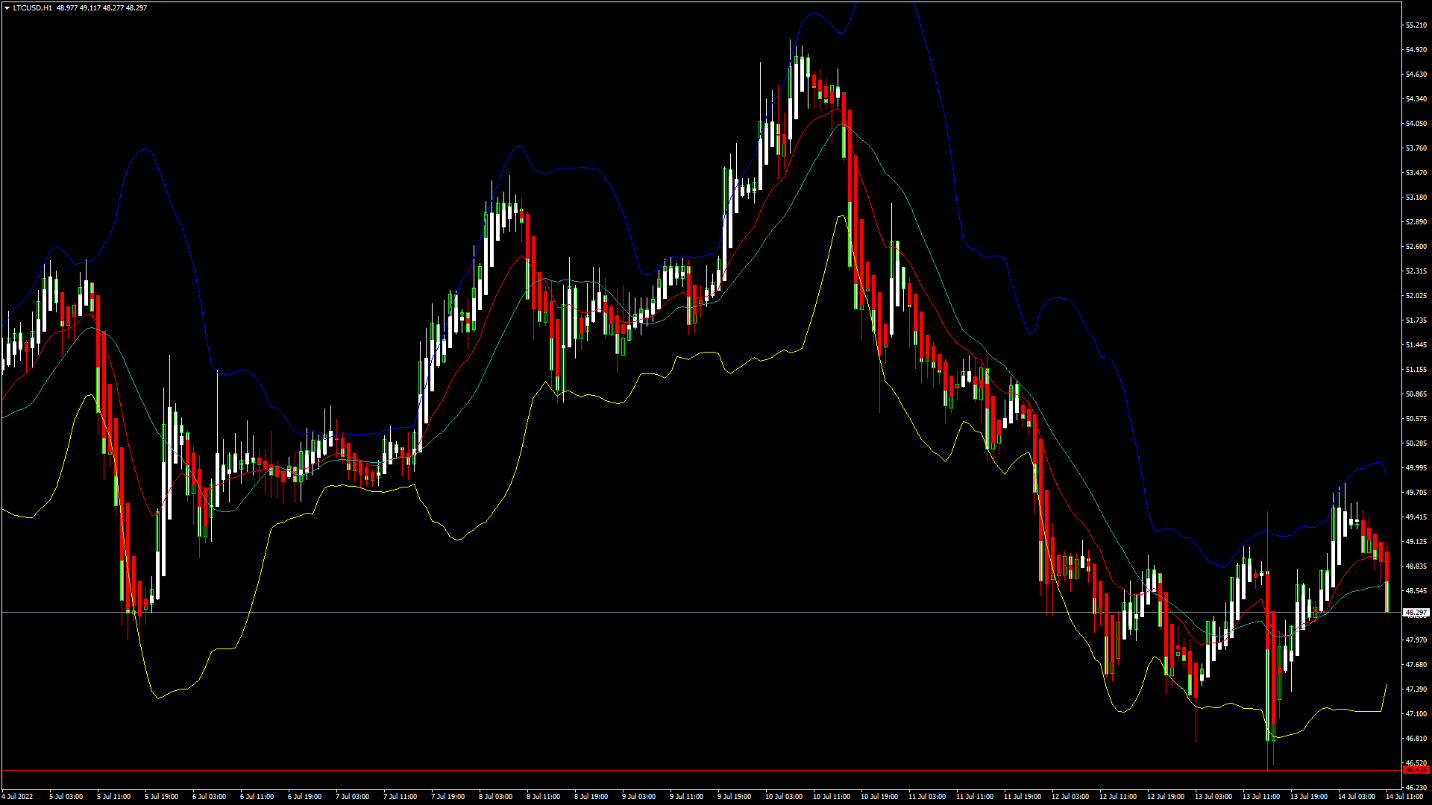
LTCUSD – Double Bottom Pattern Above $47

Litecoin was unable to sustain its bullish momentum last week, and after touching a high of 55.86 on 01st July started to decline heavily against the US dollar.

After the decline, the price of Litecoin has entered into a consolidation channel above the $48 handle. We can see the price trading above the pivot, indicating the bullish nature of the markets.

We can clearly see a double-bottom pattern above the $47 handle which is a bullish pattern and signifies the end of a bearish phase and the start of a bullish phase.

Litecoin is now trading above its 100 hourly simple and 100 hourly exponential MAs. The price of LTCUSD is just above its pivot level of 50.19.

The relative strength index is at 58 indicating a STRONG market and the continuation of the buying pressure this week.

The price of Litecoin continues to remain above most of the moving averages, which are now giving a BUY signal at current market levels of 50.20.

The STOCHRSI is indicating an overbought level, which means that the prices are due to correct downwards in the short-term range.

The short-term outlook for Litecoin has turned strongly BULLISH.

  • ALL of the technical indicators are giving a BUY signal
  • Litecoin: bullish reversal seen above the $47 level
  • The daily resistance above $50 is broken
  • The average true range is indicating LESS market volatility

Litecoin: Bullish Reversal Seen Above $47

We can see that the prices of Litecoin continue to remain in the consolidation phase and are trading above the $50 handle in the European trading session today.

The commodity channel index is indicating an overbought market which means that the prices are due to remain in the consolidation channel for some time.

Litecoin was able to clear its daily resistance level of $50 and is poised for an upwards rally in the markets aiming fresh targets of $55 and $60.

The price of LTCUSD is now facing its classic resistance levels of 50.42 and Fibonacci resistance levels of 50.57 after which the path towards $55 will get cleared.

The daily RSI is printing at 42 which is indicating a neutral market and the continuation of the consolidation phase in the short-term range.

LTC has decreased by 0.33% with a price change of 0.16$ in the past 24hrs and has a trading volume of 0.395 billion USD.

Litecoin trading volume has decreased by 29.51% compared to yesterday which appears to be normal.

The Week Ahead

We can see the formation of the Ichimoku bullish crossover pattern in the 4 hourly time-frame indicating the underlying bullish nature of the markets.

The prices of Litecoin need to remain above the $50 handle for the continuation of the uptrend.

The short-term outlook for Litecoin has turned MILDLY BULLISH; the medium-term outlook is NEUTRAL; and the long-term outlook is NEUTRAL at present market conditions.

This week, we are looking at levels of $50 to $55 and next week, Litecoin is expected to consolidate at levels above $55.

Technical Indicators:

The relative strength index (14 days): at 53 indicating a NEUTRAL market

The STOCHRSI (14): at 74.36 indicating a BUY

The average directional change (14): at 25.61 indicating a BUY

The bull/bear power (13): at 0.30 indicating a BUY

Gold Price Turns Red, Crude Oil Price Faces Hurdle

Gold price started a major decline below the $1,800 support zone. Crude oil price is attempting a recovery wave from the $93.20 zone.

Important Takeaways for Gold and Oil

· Gold price struggled above $1,800 and declined against the US Dollar.

· There is a key bearish trend line forming with resistance near $1,750 on the hourly chart of gold.

· Crude oil price started a downside correction from the $109 and $110 resistance levels.

· There is a major bearish trend line forming with resistance near $100.10 on the hourly chart of XTI/USD.

Gold Price Technical Analysis

Gold price struggled to gain pace above the $1,815 resistance zone against the US Dollar. The price started a fresh decline and traded below the $1,800 pivot level.

There was a clear move below the $1,785 support zone and the 50 hourly simple moving average. The price even traded below the $1,750 level and formed a low near $1,732. It is now consolidating losses above the $1,730 level.

Gold Price Hourly Chart

On the upside, the price is facing resistance near the $1,750 level. There is also a key bearish trend line forming with resistance near $1,750 on the hourly chart of gold.

The trend line is near the 23.6% Fib retracement level of the downward move from the $1,814 swing high to $1,732 low. A clear upside break above the trend line and the 50 hourly simple moving average could send the price towards $1,762.

The main resistance is now forming near the $1,775 level. It is near the 50% Fib retracement level of the downward move from the $1,814 swing high to $1,732 low.

A close above the $1,775 level could open the doors for a steady increase towards $1,800. The next major resistance sits near the $1,815 level. On the downside, an initial support is near the $1,735 level. The next major support is near the $1,725 level, below which there is a risk of a larger decline. In the stated case, the price could decline sharply towards the $1,700 support zone.

Oil Price Technical Analysis

Crude oil price also struggled to stay above the $110 level and started a fresh decline against the US Dollar. The price declined below the $105 support zone to move into a bearish zone.

There was a clear move below the $100 support zone and the 50 hourly simple moving average. The price traded as low as $93.16 and the price is now correcting losses. There was a move above the 23.6% Fib retracement level of the downward move from the $109.50 swing high to $93.16 low.

Oil Price Hourly Chart

On the upside, the price is facing resistance near the $100.00 level. There is also a major bearish trend line forming with resistance near $100.10 on the hourly chart of XTI/USD.

The next key resistance is near the $101.30 level or the 50% Fib retracement level of the downward move from the $109.50 swing high to $93.16 low, above which the price might accelerate higher towards $105 or even $110.

On the downside, an immediate support is near the $98.50 level. The next major support is near the $95.50 level. If there is a downside break, the price might decline towards $93.20. Any more losses may perhaps open the doors for a move towards the $90.00 support zone.

GBP/USD Faces Hurdles, EUR/GBP Could Correct Losses

GBP/USD started a fresh decline from the 1.2165 resistance. EUR/GBP declined heavily and tested the 0.8440 support zone.

Important Takeaways for GBP/USD and EUR/GBP

· The British Pound started a fresh decline from the 1.2165 zone against the US Dollar.

· There is a key bullish trend line forming with support near 1.1960 on the hourly chart of GBP/USD.

· EUR/GBP declined below the 0.8550 and 0.8500 support levels .

· There is a major bearish trend line forming with resistance near 0.8480 on the hourly chart.

GBP/USD Technical Analysis

The British Pound failed to gain strength above the 1.2200 level against the US Dollar. The GBP/USD pair started a fresh decline below the 1.2150 and 1.2120 support levels.

There was a clear move below the 1.2000 support level and the 50 hourly simple moving average. The bears even pushed the pair below the 1.1950 level. A low was formed near 1.1875 the pair is now correcting losses.

GBP/USD Hourly Chart

There was a move above the 1.1950 and 1.2000 resistance levels. The pair even climbed above the 50% Fib retracement level of the downward move from the 1.2165 swing high to 1.1875 low.

However, the pair faced sellers near the 1.2050 level. It struggled near the 61.8% Fib retracement level of the downward move from the 1.2165 swing high to 1.1875 low. On the upside, an initial resistance is near the 1.2020 level.

The next main resistance is near the 1.2050 zone. A clear upside break above the 1.2020 and 1.2050 resistance levels could open the doors for a steady increase in the near term. The next major resistance sits near the 1.2165 level.

If not, the pair might start a fresh decline below 1.1980. There is also a key bullish trend line forming with support near 1.1960 on the hourly chart of GBP/USD. The next major support is near the 1.1920 level. Any more losses could lead the pair towards the 1.1875 support zone or even 1.1800.

EUR/GBP Technical Analysis

The Euro struggled to continue higher above the 0.8680 level against the British Pound. The EUR/GBP pair started a fresh decline and traded below the 0.8550 support.

The pair even traded below the 0.8500 level and the 50 hourly simple moving average. It traded as low as 0.8440 and is currently attempting an upside break. The pair is now facing resistance near the 0.8480 level and the 50 hourly simple moving average.

EUR/GBP Hourly Chart

There is also a major bearish trend line forming with resistance near 0.8480 on the hourly chart. The trend line is close to the 23.6% Fib retracement level of the key decline from the 0.8678 high to 0.8440 low.

The next major resistance for the bulls is near the 0.8560 level. It is near the 50% Fib retracement level of the key decline from the 0.8678 high to 0.8440 low. A clear move above the 0.8560 resistance might push the price higher.

On the downside, an initial support is near the 0.8450 level. The next major support is near 0.8440. A downside break below the 0.8440 support might call for more downsides. In the stated case, the pair could decline towards the 0.8400 support level in the near term.

BTCUSD and XRPUSD Technical Analysis – 12th JULY 2022

BTCUSD: Double Top Pattern Below $22015

Bitcoin was unable to sustain its bullish momentum last week, and after touching a high of 22181 on 8th July, started to decline against the US dollar. The downfall of bitcoin continues today and is now trading below the $20000 handle in the European trading session.

The price of bitcoin failed to clear its resistance zone of $23000, and we can see that price is struggling to keep itself above the important psychological support level of $20000.

We can clearly see a double top pattern below the $22015 handle which is a bearish reversal pattern because it signifies the end of an uptrend and a shift towards a downtrend.

Bitcoin touched an intraday high of 20419 in the Asian trading session and an intraday low of 19570 in the European trading session today.

Both the STOCH and Williams percent range are indicating overbought levels which means that in the immediate short term, a decline in the prices is expected.

The relative strength index is at 29 indicating a weak demand for bitcoin at the current market level.

Bitcoin is now moving below its 100 hourly simple moving average and its 200 hourly simple moving average.

All of the major technical indicators are giving a strong sell signal, which means that in the immediate short term, we are expecting targets of 19500 and 19000.

The average true range is indicating lesser market volatility with a bearish momentum.

  • Bitcoin: a bearish reversal seen below $22015
  • The Williams percent range is Indicating an OVERBOUGHT level
  • The price is now trading just below its pivot level of $19729
  • All of the MAs are giving a STRONG SELL market signal

Bitcoin: Bearish Reversal Seen Below $22015

The prices of bitcoin continue to decline below the $20000 handle, and we are now testing the important support level of $19000 in the European trading session.

The global sentiments are weak, and the strength of the US dollar is causing bitcoin to lose its value in the short term.

We can see the formation of a falling trend channel, and now we are facing the immediate targets of $19500 and $19000.

Bitcoin continues to remain under short-term bearish pressure, and the prices are expected to enter into a consolidation channel above the $19000 handle.

The immediate short term outlook for bitcoin is bearish, the medium term outlook has turned neutral; and the long-term outlook remains neutral under present market conditions.

The Bitcoin support zone is located at $18607, and the price continues to remain above these levels during the bearish phase of the markets.

The price of BTCUSD is now facing its classic support levels of 19373 and Fibonacci support level of 19639 after which the path towards 19000 will get cleared.

In the last 24hrs BTCUSD has increased by 4.12% by 845$ and has a 24hr trading volume of USD 26.023 billion. We can see a decrease of 5.08% in the trading volume as compared to yesterday, which appears to be normal.

The Week Ahead

The prices of bitcoin are moving in a bearish momentum, and the immediate targets are $19500 and $18500.

The daily RSI is printing at 35 which means that the medium range demand continues to be weak.

We can see the formation of a contraction triangle below the $21752 and further downside breaks are expected this week.

The price of BTCUSD will need to remain above the important support level of $18000 this week.

The weekly outlook is projected at $18500 with a consolidation zone of $18000.

Technical Indicators:

The average directional change (14 days): at 38.07 indicating a SELL

The ultimate oscillator: at 38.89 indicating a SELL

The rate of price change: at -4.36 indicating a SELL

The commodity channel index (14 days): at -140 indicating a SELL

XRPUSD: Bearish Engulfing Pattern Below 0.3565

Ripple was unable to continue its bullish momentum last week, and after touching a high of 0.3563 on 8th July started to decline against the US dollar as the selling pressure continued pushing it down below the 0.3100 levels in the European trading session.

We can see that Ripple failed to clear its resistance of 0.3600 and the prices continue to correct lower against the US dollar.

We can clearly see a bearish engulfing pattern below the 0.3565 handle which is a bearish reversal pattern because it signifies the end of an uptrend and a shift towards a downtrend.

Ripple touched an intraday high of 0.3229 in the Asian trading session and an intraday low of 0.3080 in the European trading session today.

Both the STOCH RSI and Williams percent range are indicating an oversold level which means that in the immediate short term, an upwards correction in the prices is expected.

The relative strength index is at 33 which signifies a weak demand for Ripple at the current market prices and the continuation of the selling pressure this week.

All of the moving averages are giving a strong sell signal at the current market level of 0.3092.

Ripple is now trading below its pivot level of 0.3138 and is now facing its classic support level of 0.3082 and Fibonacci support level of 0.3109 after which the path towards 0.3000 will get cleared.

All of the major technical indicators are giving a strong sell signal.

  • Ripple: a bearish reversal seen below the 0.3565 level
  • The Williams percent range is indicating an oversold level
  • The average true range indicates high market volatility
  • Global sentiments continue to remain weak

Ripple: Bearish Reversal Seen Below 0.3565

We can see that the price of Ripple continues to decline and is now moving below the 0.3200 handle in the European trading session today.

The prices of Ripple are forming a bearish trend below the 0.3473 levels and a continued progression is seen towards the 0.3109 level.

The short term outlook for Ripple has turned bearish; the medium-term outlook is neutral; and the long term outlook is neutral under present market conditions.

We can see that the downside wave is strong and no bounce is seen from the lower levels suggesting a weak demand for Ripple in the global markets.

The price of XRPUSD has decreased by 4.45% with a price change of $0.01432 in the past 24hrs and has a trading volume of 0.914 billion USD.

We can see a decrease of 23.89% in the trading volumes of Ripple as compared to yesterday, which is due to the heavy selling by the medium-term investors.

The Week Ahead

Ripple is expected to incur fresh losses due to its ongoing case against the US SEC. The continuation of the downtrend is expected towards the levels of 0.2400 next week.

The prices of XRPUSD are expected to enter into a consolidation channel above the 0.3000 handle and a recovery is expected in the markets.

We can see the continuation of the bearish trendline from last week and the prices continue to remain below the important support level of 0.3200.

The weekly outlook for Ripple is projected at 0.3100 with a consolidation zone of 0.3000.

Technical Indicators:

The commodity channel index: at -174 indicating a SELL

The ultimate oscillator: at 46.86 indicating a SELL

The rate of price change: at -4.03 indicating a SELL

The average directional change (14 days): at 41.16 indicating a SELL

Big tech earnings awaited; the strong US Dollar could be their achilles heel

The Big Tech stocks which are listed on prominent North American stock exchanges have been unusually volatile recently.

Large technology companies such as Microsoft, Apple and Google are often regarded by traders as steady, non-volatile investments which only move very slightly, hence their wide-ranging popularity among all kinds of traders and investors.

Recently, however, things have been somewhat different. There was a considerable collapse in the value of the stock of many big tech companies recently, which even as recently as May this year was being described by the mainstream media as ‘far from over’.

Such volatility is rare, however now there is another element which is important to consider; the strong US Dollar.

The US Dollar has been surprisingly strong against its rival major currencies recently, and this strength is looking likely to affect the performance of the stocks of American big tech firms with a global audience such as Apple, Meta (Facebook), Alphabet (Google), Netflix and Tesla as their largest percentage of sales and revenue is generated outside the United States.

Therefore, being US-headquartered companies, the strong dollar vs weaker currencies in the regions in which these companies conduct most of their business means that there is a potential impact on revenues looming.

Asian currencies have fallen much less than the euro, and hedging and shifting production can cut currency volatility. This may seem an extreme logistics and organizational exercise, but it is possible given the global footprint of these multinational giants and the need to hedge against the currency market’s considerable movements between US Dollar and other currencies lately.

To demonstrate how this actually works, it is worth looking at the 11% increase this year against a basket of currencies that the US Dollar has achieved, and especially the 12% it has gained against the euro.

This could potentially create a major issue as earnings season begins. For example, many companies included in the S&P500 index generate 29% of their sales from outside the United States according to Goldman Sachs.

These companies often sell those products or services in local currencies, then report financial results including those sales in dollars. Therefore, if Nike sells a pair of shoes for 100 euros, it was worth about $7 less at the end of its quarter than at the beginning of the same quarter.

Given the economic woes that exist in the United States such as spiraling inflation which is at its highest point in 40 years, and a cost of living crisis, it may be difficult to understand why the US Dollar is rising against other majors such as the Euro and British Pound, both of which are legal tender in regions that face the exact same economic woes as the United States. Mainland Europe and Britain are both mired in high inflation and cost of living crises, but the Dollar is trumping the Euro and Pound.

One possible explanation for this could be that the dollar has risen for the reason it often does during global economic weakness, in that it is viewed as the world’s reserve currency, and therefore a safe haven.

Perhaps Bitcoin had been viewed that way as it is decentralized and away from the politicians and central banks, but the US Dollar is even performing well against Bitcoin and has been for a number of weeks now.

This matter in which the US Dollar’s strength may impact corporate earnings is interesting, therefore the big publicly listed stocks are equally interesting to watch as the earnings reports are released.

EUR/USD Dives To Parity, USD/JPY Eyes More Upsides

EUR/USD extended decline and tested the 1.0000 support. USD/JPY is rising and might continue to gain pace towards the 140.00 resistance

Important Takeaways for EUR/USD and USD/JPY

· The Euro started a fresh decline and even tested the 1.0000 support.

· There is a major bearish trend line forming with resistance near 1.0035 on the hourly chart of EUR/USD.

· USD/JPY gained pace after it broke the 136.00 resistance zone.

· There is a key rising channel forming with support near 135.70 on the hourly chart.

EUR/USD Technical Analysis

This past week, the Euro started a major decline from well above the 1.0500 level against the US Dollar. The EUR/USD pair declined below the 1.0320 and 1.0250 support levels.

The bears even pushed the pair below the 1.0100 level. There was a close below 1.0100 and the 50 hourly simple moving average. It tested the parity zone and a low is formed near 1.0000 on FXOpen.

EUR/USD Hourly Chart

It is now consolidating losses and trading above the 1.0020 level. An immediate resistance on the upside is near the 1.0035 level. There is also a major bearish trend line forming with resistance near 1.0035 on the hourly chart of EUR/USD.

The trend line is near the 23.6% Fib retracement level of the downward move from the 1.0189 swing high to 1.0000 low. The next major resistance is near the 1.0070 level and the 50 hourly simple moving average.

The main resistance is near the 1.0100 level. It is near the 50% Fib retracement level of the downward move from the 1.0189 swing high to 1.0000 low. An upside break above 1.0100 could set the pace for a steady increase.

If not, the pair might drop and test the 1.0000 support. The next major support is near 0.9950, below which the pair could drop to 0.9900 in the near term.

USD/JPY Technical Analysis

The US Dollar started a fresh increase above the 135.00 resistance zone against the Japanese Yen. The USD/JPY pair broke the 135.50 level to move further into a positive zone.

It gained pace for a close above the 136.20 level and the 50 hourly simple moving average. A new multi-year high is formed near the 137.75 level. The pair is now consolidating gains near the 137.00 level.

USD/JPY Hourly Chart

An initial support on the downside is near the 136.70 level. It is near the 38.2% Fib retracement level of the upward move from the 134.95 swing low to 137.75 high. The next major support is near the 136.35 level.

The 50% Fib retracement level of the upward move from the 134.95 swing low to 137.75 high is also near the 136.35 zone. Besides, there is a key rising channel forming with support near 135.70 on the hourly chart.

Any more downsides might lead the pair towards the 135.65 support zone, below which the bears might aim a test of the 135.00 support zone.

On the upside, an initial resistance is near the 137.70 level. The next major resistance is near the 138.20. Any more gains could send the pair towards the 138.80 level. The next key hurdle is near the 140.00 level.

ETHUSD and LTCUSD Technical Analysis – 14th JULY, 2022

ETHUSD: Ascending Triangle Pattern Above $1006

Ethereum was unable to sustain its bullish momentum, and after touching a high of 1251 on 9th July started to decline against the US dollar touching a low of 1006 on 13th July.

After this steep decline, we can see that the prices have recovered and started upwards correction with a bullish momentum.

We can see that ETH is gaining traction against the US dollar as the price remains supported above the $1050 handle in the European trading session today.

The prices touched an intraday low of $1075 and an intraday high of $1125 in the Asian trading session today.

We can clearly see an ascending triangle pattern above the $1006 handle which is a bullish pattern and signifies the end of a bearish phase and the start of a bullish phase in the markets.

ETH is now trading below its pivot levels of 1101 and is moving into a mildly bullish channel. The price of ETHUSD is now testing its classic resistance level of 1107 and Fibonacci resistance level of 1112 after which the path towards 1200 will get cleared.

The relative strength index is at 54 indicating a NEUTRAL market and the continuation of the uptrend in the markets.

The Williams percent range and commodity channel index are indicating NEUTRAL levels, which means that the prices are expected to enter into a consolidation phase in the short-term range.

Some of the technical indicators are giving a BUY market signal. Some of the moving averages are giving a BUY signal, and we are now looking at the levels of $1100 to $1150 in the short-term range.

ETH is now trading below both its 100 hourly simple and exponential moving averages.

  • Ether: bullish continuation seen above the $1006 mark
  • Short-term range appears to be mildly BULLISH
  • ETH continues to remain above the $1000 level
  • The average true range is indicating LESS market volatility

Ether: Bullish Continuation Seen Above $1006

ETHUSD is now moving in a mildly bullish channel with the prices trading above the $1050 handle in the European trading session today.

We have also detected the formation of MA20 and MA50 crossover patterns in the hourly time frame indicating that the price is likely to climb higher crossing the $1150 level.

We can see that the prices of Ethereum are slowly preparing for the next move above the $1100 level today.

The STOCHRSI is indicating an oversold market, which means that the prices are due to correct upwards in the short-term range.

The current price action is positive for the markets, and the prices are expected to remain above the $1000 level in the US trading session today.

The key support levels to watch are $1085 and $1093, and the prices of ETHUSD need to remain above these levels for the continuation of the bullish trend.

ETH has increased by 2.90% with a price change of 30$ in the past 24hrs and has a trading volume of 18.112 billion USD.

We can see an increase of 39.80% in the total trading volume in the last 24 hrs which is due to buying seen at lower levels by the medium-term investors.

The Week Ahead

On an upside potential $1300 remains as a major hurdle, and the price of Ethereum will test this resistance zone next week.

The price of Ethereum continues to remain above the important psychological support level of $1000 and some of the technicals are now indicating a bullish market.

The immediate short-term outlook for Ether has turned mildly BULLISH; the medium-term outlook has turned NEUTRAL; and the long-term outlook for Ether is NEUTRAL in present market conditions.

This week, Ether is expected to move in a range between $1000 and $1150, and next week, it is expected to enter into a consolidation phase above $1150.

Technical Indicators:

The STOCH (9,6): at 57.54 indicating a BUY

The moving averages convergence divergence (12,26): at 10.20 indicating a BUY

The rate of price change: at 0.321 indicating a BUY

Bull/Bear power (13): at 1.08 indicating a BUY

LTCUSD: Double Bottom Pattern Above $46

Litecoin was unable to sustain its bullish momentum last week and after touching a high of 54.95 on 10th July started to decline heavily against the US dollar, touching a low of $46.56 on 13th July.

We can see that after this decline, the prices of Litecoin have entered into a consolidation channel above the $47 handle. We have seen a bullish gap opening of the markets this week indicating the bullish nature of the markets.

We can clearly see a double-bottom pattern above the $46 handle which is a bullish pattern and signifies the end of a bearish phase and the start of a bullish phase.

Litecoin is now trading below its 100 hourly simple moving averages and 100 hourly exponential moving averages. The price of LTCUSD is just below its pivot level of 48.89.

The relative strength index is at 50 indicating a NEUTRAL market and the move towards the consolidation channel.

The price of Litecoin continues to remain below most of the moving averages, some of which are now giving a BUY signal at current market levels of 48.30.

The STOCHRSI is indicating an oversold level, which means that the prices are due to correct upwards in the short-term range.

The short-term outlook for Litecoin has turned mildly BULLISH.

  • Some of the technical indicators are giving a BUY signal
  • Litecoin: Bullish reversal seen above $46
  • The commodity channel index is indicating a neutral level
  • The average true range is indicating LESS market volatility

Litecoin: Bullish Reversal Seen Above $46

We can see that the prices of Litecoin continue to remain in the consolidation phase and are now trading above the $47 handle in the European trading session today.

We can see a bearish price exhaustion at $40, and a bullish correction wave has started, which can continue its propagation beyond the $55 and $60 levels in the coming week.

The price of LTCUSD is now facing its classic resistance level of 49.10 and Fibonacci resistance level of 49.23 after which the path towards $50 will get cleared.

Litecoin’s price continues to suffer losses due to the strength of the US dollar as many medium-term investors are selling due to weaker global sentiments.

We have also detected the formation of a bullish harami pattern above the $47 handle in the hourly time frame indicating the underlying bullish nature of the markets.

The daily RSI is printing at 41 which is indicating a neutral market and continuation of the consolidation phase in the short-term range.

LTC has decreased by 1.22% with a price change of 0.58$ in the past 24hrs and has a trading volume of 0.440 billion USD.

Litecoin’s trading volume has increased by 19.28% compared to yesterday which appears to be normal.

The Week Ahead

We can see the formation of a bearish engulfing pattern in the 30-minutes time frame indicating the weakness in the markets, but a positive correction is expected next week.

The price of Litecoin needs to remain above the $47 handle for the continuation of the uptrend.

The short-term outlook for Litecoin has turned mildly BULLISH; the medium-term outlook is NEUTRAL; and the long-term outlook is NEUTRAL at present market conditions.

This week, we are looking at levels of $46 to $52, and next week, Litecoin is expected to consolidate at levels above $52.

Technical Indicators:

The relative strength index (14 days): at 50 indicating a NEUTRAL market

The moving averages convergence divergence (12,26): at 0.162 indicating a BUY

The STOCHRSI (14): at 0.00 indicating an OVERSOLD market

The Williams percent range: at -89.44 indicating an OVERSOLD market

AUD/USD and NZD/USD Eye Key Upside Break

AUD/USD is attempting a recovery wave above the 0.6750 resistance. NZD/USD is also eyeing a key upside break above the 0.6140 resistance.

Important Takeaways for AUD/USD and NZD/USD

· The Aussie Dollar started a fresh decline below the 0.6800 support zone against the US Dollar.

· There is a key bearish trend line forming with resistance near 0.6750 on the hourly chart of AUD/USD.

· NZD/USD also started a major decline from the 0.6200 resistance zone.

· There is a major bearish trend line forming with resistance near 0.6135 on the hourly chart of NZD/USD.

AUD/USD Technical Analysis

The Aussie Dollar attempted a fresh increase above the 0.6800 and 0.6810 levels against the US Dollar. However, the AUD/USD pair failed to continue higher above 0.6800 and started another decline.

There was a move below the 0.6750 and 0.6720 support levels. There was a close below the 0.6750 level and the 50 hourly simple moving average. The pair traded as low as 0.6681 and is currently correcting losses.

AUD/USD Hourly Chart

There was a move above the 0.6725 resistance level. The pair climbed above the 50% Fib retracement level of the downward move from the 0.6803 swing high to 0.6681 low.

On the upside, the AUD/USD pair is facing resistance near the 0.6750 level. It is near the 61.8% Fib retracement level of the downward move from the 0.6803 swing high to 0.6681 low. There is also a key bearish trend line forming with resistance near 0.6750 on the hourly chart of AUD/USD.

The next major resistance is near the 0.6800 level. A close above the 0.6800 level could start a steady increase in the near term. The next major resistance could be 0.6880.

On the downside, an initial support is near the 0.6725 level. The next support could be the 0.6700 level. The main support is near the 0.6680 level. If there is a downside break below the 0.6680 support, the pair could extend its decline towards the 0.6650 level.

NZD/USD Technical Analysis

The New Zealand Dollar also followed a similar path from the 0.6200 zone against the US Dollar. The NZD/USD pair traded below the 0.6150 support zone to enter a bearish zone.

There was a clear move below the 0.6150 zone and the 50 hourly simple moving average. The pair traded as low as 0.6060 and is currently correcting losses. There was a steady move above the 0.6100 resistance zone.

NZD/USD Hourly Chart

The pair climbed above the 50% Fib retracement level of the downward move from the 0.6171 swing high to 0.6060 low. On the upside, an initial resistance is near the 0.6135 level.

There is also a major bearish trend line forming with resistance near 0.6135 on the hourly chart of NZD/USD. The trend line is near the 61.8% Fib retracement level of the downward move from the 0.6171 swing high to 0.6060 low.

The next major resistance is near the 0.6150 level. A clear move above the 0.6150 level might even push the pair towards the 0.6200 level. If not, the pair might continue lower. On the downside, an initial support is near the 0.6110 level.

The next support could be the 0.6085 zone. If there is a downside break below the 0.6085 support, the pair could extend its decline towards the 0.6000 level.

Watch FXOpen’s July 11 - 15 Weekly Digest Video

In this video, FXOpen UK COO Gary Thomson sums up the week’s happenings and discusses the most significant news reports.

  • Euro and dollar reach parity.
  • Inflation in the US rises again.
  • Analysts’ forecasts on Coca-Cola shares.
  • Watch our short and informative video, and stay updated with FXOpen.

FXOpen YouTube

GBP/USD Eyes Recovery While USD/CAD Is Sliding

GBP/USD could gain pace if it clears the 1.1900 resistance zone. USD/CAD is sliding and could extend losses below the 1.3000 level.

Important Takeaways for GBP/USD and USD/CAD

· The British Pound is attempting an upside correction from the 1.1800 support zone.

· There is a key bearish trend line forming with resistance near 1.1900 on the hourly chart of GBP/USD.

· USD/CAD started a fresh decline from the 1.3220 resistance zone.

· There was a break below a connecting bullish trend line with support near 1.3070 on the hourly chart.

GBP/USD Technical Analysis

After facing sellers near 1.2055, the British Pound started a fresh decline against the US Dollar. GBP/USD declined heavily below the 1.2000 support zone.

There was a move below the 1.1900 support zone and the 50 hourly simple moving average. The pair traded as low as 1.1761 and is currently correcting higher. There was a clear move above the 1.1850 resistance zone.

GBP/USD Hourly Chart

The pair climbed above the 50% Fib retracement level of the downward move from the 1.1967 swing high to 1.1761 low. An immediate resistance is near the 1.1900 level.

There is also a key bearish trend line forming with resistance near 1.1900 on the hourly chart of GBP/USD. The next key resistance is near the 1.1920 level. It is near the 76.4% Fib retracement level of the downward move from the 1.1967 swing high to 1.1761 low.

If there is an upside break above the 1.1920 zone, the pair could rise towards 1.2000. The next key resistance could be 1.2050, above which the pair could gain strength.

On the downside, an initial support is near the 1.1860 area. The first major support is near the 1.1840 level. If there is a break below 1.1840, the pair could extend its decline. The next key support is near the 1.1760 level. Any more losses might call for a test of the 1.1700 support.

Read Full on FXOpen Company Blog…

Gold begins to move upwards, but 1-year low still lingering

Gold has been struggling to maintain the values that it reached during the spring of 2022 over recent months, and by the middle of July it had reached a 1-year low.

Whereas the prices in May had reached $1,980 per ounce, Gold had dropped to $1,700 by July 14.

Today, however, a slight upturn in the value of Gold has begun to make itself evident, and this morning during the Asian trading session, Gold had risen to $1,720 per ounce.

Admittedly, this is still a low value compared to any time during the past twelve months, but the factors which are now beginning to influence the value of gold away from its two-month long decline to the low value reached at the end of last week.

This morning, Gold rose to $1,717 per ounce, which some are attributing to a weakness in the US Dollar. Ordinarily commodities and stores of value such as Gold would not be so influenced by the currency market, but the US Dollar’s value is intrinsic to the value of Gold because Gold is valued in US Dollars and bought and settled in US Dollars.

Another US Dollar-related factor which could be contributing to the slight rise in the value of Gold is that the US Federal Reserve Bank intervened to cool down market expectations of a 1.0% rate hike on Friday, which in turn helped the Gold Price to defend the yearly low that it reached on Thursday.

Talk of interest rate increases in the United States are enough to blunt enthusiasm, especially when considering that there have already been a few this year, and that The Index of Consumer Expectations declined to its lowest level since May 1980 at 47.3. These very low figures were released alongside a 0.20% contraction by the US Industrial Production for June to favor Gold buyers or traders of the US Dollar against Gold.

There are talks of a 1% interest rate rise at the next Federal Reserve meeting, and that is a clear indicator that inflation is still a major concern for policymakers in the United States, just as it is in Europe.

The difference is that commodity prices are affected by these economic decisions which involve the US Dollar.

FXOpen Blog

British Pound begins to rise, but still faces challenges

The British Pound has been subjected to an onslaught of challenges recently.

These challenges have not been short term ones, either.

Over the past two years, there have been factors which have had an overreaching effect on the economic circumstances of most Western nations, including government-enforced lockdowns, which were the first in a series of policies which have had a domino effect.

In the United Kingdom, adherence to lockdowns was enforced in a different way to those in many other nations. Instead of policing the movements of people, the British government introduced a furlough scheme which effectively paid people to stay at home.

This has cost the country’s coffers a fortune, and along with a £400 billion borrowing program led by Chancellor of the Exchequer (finance minister) Rishi Sunak, it all has to be paid back by a nation whose productivity was adversely affected for over two years.

The inflation and cost of living crisis that ensued has added further woes to the economic situation and the Pound has languished.

Now, however, it has begun to rise again as the forecast for the Consumer Price Index (CPI) will be released today and it is anticipated to be an almost unbelievable 9.1% year-on-year according to a Bloomberg survey. The Bank of England will meet 4th August to decide on how much to hike rates.

This is certainly not good reading for conservative investors, and really shows the extent of the inflation problem.

The anomaly is the US Dollar’s strength. The US Dollar remains very strong against all majors, the British Pound being no exception, especially given that the United States is in equally dire straits in terms of inflation which is at a 40 year high.

Productivity in the United States is quite good, however, whereas in the United Kingdom there are still many large organizations which are still not operating at anything like full capacity.

Perhaps another important factor to consider is that the British Prime Minister resigned amid a myriad of chaotic circumstances at the time when the economy is teetering, with many fingers aiming the blame directly at the incumbent government for the state of the nation’s finances.

Therefore, the GBP/USD remains in a downtrend like many other markets as overall US Dollar strength continues.

FXOpen Blog

BTCUSD and XRPUSD Technical Analysis – 19th JULY 2022

BTCUSD: Triple Bottom Pattern Above $19640

Bitcoin was unable to sustain its bearish momentum and after touching a low of 18991 on 13th July started to correct upwards breaching the $22000 handle on 18th July.

We can see a continued appreciation in the price of bitcoin as global investor sentiments have improved leading to buying action seen in the markets at levels above $19000.

The price of bitcoin is poised to clear the resistance zone located at $23000 after which we will see a continuous upsurge in the levels of BTCUSD.

We can clearly see a triple-bottom pattern above the $19640 handle which is a bullish reversal pattern because it signifies the end of a downtrend and a shift towards an uptrend.

Bitcoin touched an intraday high of 22937 in the Asian trading session and an intraday low of 21588 in the European trading session today.

Both the STOCH and Williams percent range are indicating overbought levels which means that in the immediate short term, a decline in the prices is expected.

The relative strength index is at 50 indicating a neutral demand for bitcoin at the current market levels.

Bitcoin is now moving above its 100 hourly simple moving average and 200 hourly simple moving averages.

Some of the major technical indicators are giving a buy signal, which means that in the immediate short term, we are expecting targets of 22000 and 23000.

The average true range is indicating less market volatility with a bullish momentum.

  • Bitcoin: bullish reversal seen above $19640
  • The Williams percent range is indicating an overbought level
  • The price is now trading just above its pivot level of $21805
  • Most of the moving averages are giving a buy market signal

Bitcoin: Bullish Reversal Seen Above $19640

The price of Bitcoin continues to appreciate above the $21000 handle, and we are now testing the important resistance level of $23000 in the European trading session.

The global sentiments continue to improve leading to broad-based buying by the medium-term investors.

We can see the formation of a rising trend channel and are facing the immediate targets of $22000 and $22700.

Bitcoin’s bearish bias was invalidated above $19000, and we can see a correction wave that is stronger than the previous one.

We can see the formation of a bullish ABCD pattern in the hourly time frame which indicates that we are heading towards the $25000 level.

The immediate short-term outlook for bitcoin is bullish; the medium-term outlook has turned neutral; and the long-term outlook remains neutral under present market conditions.

Bitcoin’s support zone is located at $20500, and the prices continue to remain above this level for the continuation of the bullish phase of the markets.

The price of BTCUSD is now facing its classic resistance level of 21868 and Fibonacci resistance level of 21963 after which the path towards 22000 will get cleared.

In the last 24hrs, BTCUSD has declined by 1.73% by 385$ and has a 24hr trading volume of USD 45.154 billion. We can see an increase of 39.50% in the trading volume as compared to yesterday, which is due to the buying seen by the medium-term investors.

The Week Ahead

The price of bitcoin is moving in a bullish momentum, and the immediate targets are $22500 and $23500.

The daily RSI is printing at 53 which means that the medium range demand continues to remain neutral.

We can see the continuation of the recovery mode in bitcoin with the prices touching the $23000 and $24000 levels next week.

The price of BTCUSD will need to remain above the important support level of $20000 this week.

The weekly outlook is projected at $23500 with a consolidation zone of $22500.

Technical Indicators:

The average directional change (14 days): at 25.10 indicating a buy

The ultimate oscillator: at 59.03 indicating a buy

The rate of price change: at 8.61 indicating a buy

The commodity channel index(14days): at 136 indicating a buy

Read Full on FXOpen Company Blog…

EUR/USD Starts Recovery While USD/CHF Dips Below Support

EUR/USD started a recovery wave above the 1.0200 level. USD/CHF is declining and broke a key support near the 0.9750 zone.

Important Takeaways for EUR/USD and USD/CHF

· The Euro started a decent recovery wave above the 1.0150 zone against the US Dollar.

· There is a key bullish trend line forming with support near 1.0225 on the hourly chart of EUR/USD.

· USD/CHF started a fresh decline after it failed to clear the 0.9880 resistance zone.

· There is a major bearish trend line forming with resistance near 0.9720 on the hourly chart.

EUR/USD Technical Analysis

This past week, the Euro gained pace below the 1.0100 support against the US Dollar. The EUR/USD pair even spiked below the parity level and traded as low as 0.9952 on FXOpen.

Recently, there was a recovery wave above the 1.0000 and 1.0100 resistance levels. The pair climbed above the 1.0150 level and the 50 hourly simple moving average. The pair traded as high as 1.0268 and is currently showing positive signs.

EUR/USD Hourly Chart

There was a minor drop and a test of the 23.6% Fib retracement level of the upward move from the 1.0119 swing low to 1.0268 high.

An immediate resistance is near the 1.0255 level. The next major resistance is near the 1.0270 level. A clear move above the 1.0270 resistance zone could set the pace for a larger increase towards 1.0350. The next major resistance is near the 1.0450 zone.

On the downside, an immediate support is near the 1.0230 level. There is also a key bullish trend line forming with support near 1.0225 on the hourly chart of EUR/USD.

The next major support is near the 1.0200 level. It is near the 50% Fib retracement level of the upward move from the 1.0119 swing low to 1.0268 high. A downside break below the 1.0200 support could start another decline.

Read Full on FXOpen Company Blog…

Big Tech stock languishes, whilst UK inflation rampages

This week started off with very big moves among the Big Tech stocks on North America’s markets, a dynamic which has continued throughout the week so far.

On Monday, Apple stock fell more than 2% in its worst trading session in almost three weeks after Bloomberg revealed the company’s plans to slow hiring and spending to cope with a potential economic downturn. Yesterday, Meta (previously Facebook) was in the news, with its CEO Mark Zuckerberg stating quite ruthlessly that the company will simply tell all of its employees that it ‘does not need’ to simply go home.

There are now some commentators who consider that the big tech stocks listed on New York’s prominent exchanges have even further to fall.

Apple stock has decreased in value by a remarkable 17% during the course of 2022, and other large software giants and internet stalwarts such as Microsoft and Google (Alphabet) having fallen in value over a sustained period of time.

A point of interest with this otherwise gloomy outlook is that the declining nature of Apple stock is having a bearing on the total value of all big tech stocks.

The spread between the prospective earnings multiples of the S&P 500 Information Technology Sector and the benchmark S&P 500 started this year at the highest it had been since 2004, which is encouraging, and shows that perhaps a few of the giants which have been struggling to keep the value of their shares up have affected the entire outlook for big tech when in reality there are firms doing well.

Overall, however, the differential between the downturn in big tech stock values in New York and other stocks on prominent exchanges elsewhere is interesting.

London’s FTSE 100, largely consisting of less tech-focused stocks and more on long-established, age-old blue chip companies in mining, manufacturing, pharmaceuticals, finance, consumer retail and engineering industries, has been stable despite the United Kingdom’s economic situation having reached a milestone inflation level which is now at its highest in 40 years.

It is apparent that many investors in the United Kingdom are looking for inflation-busting opportunities, and are taking a cautious approach, especially given that many London listed stocks are valued in Pounds and Pence, and at a time during which the governmental changes are creating uncertainty.

FXOpen Blog

ETHUSD and LTCUSD Technical Analysis – 21st JULY, 2022

ETHUSD: Hanging Man Pattern Below $1627

Ethereum was unable to sustain its bullish momentum and after touching a high of 1627 on 19th July started to decline against the US dollar coming down below the $1500 handle in the European trading session today.

We can see that ETH is losing ground against the US dollar and no major uptrend formation was seen.

The prices touched an intraday low of $1466 and an intraday high of $1565 in the Asian trading session today.

We can clearly see a hanging man pattern below the $1627 handle which is a bearish pattern and signifies the end of a bullish phase and the start of a bearish phase in the markets.

ETH is now trading just above its pivot levels of 1485 and moving into a mildly bearish channel. The price of ETHUSD is now testing its classic support level of 1450 and Fibonacci support level of 1476 after which the path towards 1300 will get cleared.

The relative strength index is at 39 indicating a weak market and the continuation of the downtrend in the markets.

We can see the progression of a bearish trendline formation from $1627 to $1488 which indicates that we are heading towards $1436.

Both the commodity channel index and Williams percent range are indicating a neutral market.

All of the technical indicators are giving a strong sell market signal.

Most of the moving averages are giving a sell signal, and we are now looking at the levels of $1400 to $1350 in the short-term range.

ETH is now trading above both its 100 hourly simple and exponential moving averages.

  • Ether: bearish reversal seen below the $1627 mark
  • Short-term range appears to be mildly bearish
  • ETH continues to remain above $1400
  • The average true range is indicating less market volatility

Ether: Bearish Reversal Seen Below $1627

[ETHUSD] is now moving into a mildly bearish channel with the prices trading below the $1500 handle in the European trading session today.

We have also detected the formation of MA20 and MA50 crossover patterns located at 1529 and 1545 in the hourly time frame indicating that the price is likely to descend below.

We can see that the prices of Ethereum are slowly preparing for moving into a consolidation channel above the $1400 handle.

We can also see the formation of three black crows patterns in the 15-minute time frame indicating the bearish nature of the markets.

In the 2-hour time frame, the super trend indicator is giving bearish reversal signals.

The key support levels to watch are $1385 and $1335, and the prices of ETHUSD need to remain above these levels for any potential bullish reversal in the markets.

ETH has decreased by 2.79% with a price change of 42$ in the past 24hrs and has a trading volume of 23.086 billion USD.

We can see an increase of 2.31% in the total trading volume in the last 24 hrs. which appears to be normal.

The Week Ahead

We can see that ETH failed to clear the resistance zone located at $1650, and with the continued bearish reversal, we are now heading towards the $1400 level.

The prices of Ethereum are preparing to enter into a consolidation phase below the $1500 level and we can see some range-bounded movements between the $1400 and $1500 levels this week.

The immediate short-term outlook for Ether has turned mildly bearish; the medium-term outlook has turned neutral; and the long-term outlook for Ether is neutral in present market conditions.

The price of ETHUSD will need to remain above the important support level of $1400 this week.

The weekly outlook is projected at $1550 with a consolidation zone of $1400.

Technical Indicators:

STOCH (9,6): at 22.50 indicating a sell

The moving averages convergence divergence (12,26): at -17.75 indicating a sell

The rate of price change: at -3.93 indicating a sell

The ultimate oscillator: at 46.50 indicating a sell

Read Full on FXOpen Company Blog…

Gold Price and Crude Oil Price Aim Fresh Increase

Gold price started a major decline below the $1,725 support zone. Crude oil price is attempting a fresh increase from the $88.80 support zone.

Important Takeaways for Gold and Oil

· Gold price struggled above $1,740 and declined against the US Dollar.

· Recently, there was a break above a key bearish trend line with resistance near $1,705 on the hourly chart of gold.

· Crude oil price started a downside correction from the $100 and $101 resistance levels.

· There was a break below a major bullish trend line with support near $98.95 on the hourly chart of XTI/USD.

Gold Price Technical Analysis

Gold price struggled to gain pace above the $1,750 resistance zone against the US Dollar. The price started a fresh decline and traded below the $1,725 pivot level.

There was a clear move below the $1,712 support zone and the 50 hourly simple moving average. The price even traded below the $1,700 level and formed a low near $1,680 on FXOpen. It is now correcting losses above the $1,695 level.

Gold Price Hourly Chart

There was a break above a key bearish trend line with resistance near $1,705 on the hourly chart of gold. The price even climbed above the $1,712 level but struggled to clear $1,720.

A high is formed near $1,720 and the price is now consolidating gains. On the downside, an initial support is near the $1,710 level. It is near the 23.6% Fib retracement level of the upward move from the $1,680 swing low to $1,720 high.

The next major support is near the $1,700 level or the 50% Fib retracement level of the upward move from the $1,680 swing low to $1,720 high, below which there is a risk of a larger decline. In the stated case, the price could decline sharply towards the $1,680 support zone.

On the upside, the price is facing resistance near the $1,720 level. A clear upside break above the $1,720 resistance could send the price towards $1,735. The main resistance is now forming near the $1,750 level. A close above the $1,750 level could open the doors for a steady increase towards $1,780.

Read Full on FXOpen Company Blog…

Watch FXOpen’s July 18 - 22 Weekly Digest Video

In this video, FXOpen UK COO Gary Thomson sums up the week’s happenings and discusses the most significant news reports.

British pound begins to rise, but still faces challenges
EUR/USD starts recovery while USD/CHF dips below support
What will make oil prices skyrocket?
Big Tech stock languishes, whilst UK inflation rampages

Watch our short and informative video, and stay updated with FXOpen.

FXOpen YouTube

GBP/USD Faces Resistance And GBP/JPY Is Sliding

GBP/USD started a recovery wave above the 1.1950 resistance zone. GBP/JPY declined and remains at a risk of more losses below 163.00.

Important Takeaways for GBP/USD and GBP/JPY

· The British Pound started a recovery wave above the 1.1950 resistance against the US Dollar.

· There is a major bullish trend line forming with support near 1.1960 on the hourly chart of GBP/USD.

· GBP/JPY declined steadily after it failed to clear the 166.20 resistance zone.

· There was a break below a key bullish trend line with support near 165.60 on the hourly chart.

GBP/USD Technical Analysis

This past week, the British Pound found support near the 1.1750 zone against the US Dollar. The GBP/USD pair started a recovery wave and was able to settle above the 1.1850 zone.

There was a steady increase above the 1.1900 zone and the 50 hourly simple moving average. The pair even traded above the 1.2000 resistance zone. However, the bears were active near the 1.2050 and 1.2060 levels.

GBP/USD Hourly Chart

A high was formed near 1.2063 on FXOpen and the pair is now correcting lower. There was a move below the 1.2000 support zone. It even broke the 50% Fib retracement level of the upward move from the 1.1916 swing low to 1.2063 high.

An immediate support is near the 1.1975 and the 50 hourly simple moving average. The next major support is near the 1.1960 level. There is also a major bullish trend line forming with support near 1.1960 on the hourly chart of GBP/USD.

If there is a break below the 1.1960 support, the pair could test the 1.1920 support. Any more losses might send GBP/USD towards 1.1850. On the upside, the pair is facing resistance near the 1.2000 level and the 1.2020.

An upside break above 1.2020 could set the pace for a move towards the 1.2060 resistance zone. The next major resistance sits near the 1.2120 level.

GBP/JPY Technical Analysis

The British Pound started a fresh decline from the 166.20 zone against the Japanese Yen. The GBP/JPY pair gained pace below the 165.50 and 165.00 support levels.

There was a clear move below the 164.20 level and the 50 hourly simple moving average. The pair even declined below 164.00 support and traded as low as 163.00. It is now consolidating losses above the 163.00 pivot level.

GBP/JPY Hourly Chart

On the upside, GBP/JPY is facing resistance near the 163.70 level. It is near the 23.6% Fib retracement level of the downward move from the 166.23 swing high to 163.00 low.

The next key resistance could be 164.60 and the 50 hourly simple moving average. It is near the 50% Fib retracement level of the downward move from the 166.23 swing high to 163.00 low. A clear break above the 164.60 resistance could push the pair towards the 166.00 resistance.

On the downside, an initial support is near the 163.00 level. The next major support is near the 162.50. If there is a downside break below the 162.50 support, the pair could decline towards the 161.50 support zone. Any more losses might send the pair towards the 160.50 level in the near term.

Read Full on FXOpen Company Blog…

Oil price bonanza may trigger dividend hike for big firms

The incessant increase in the price of oil over recent months has been a moot point for many people, especially those in western countries who are now having to battle with the cost of paying for their domestic heating or the painful cost of buying fuel for their car.

What appeared inconceivable last year when oil prices were very low and had only just begun to recover from the negative equity position that crude oil was in in March 2020, is now a very harsh reality for many domestic and commercial consumers, just as it is for commodities traders who have to make their investment in crude oil work against the backdrop of a surprisingly strong US Dollar.

Currently, the price of oil is still extremely high, with Brent Crude commanding a price of $103 per barrel at July 25, and oil companies are quite simply raking in the profits.

The sanctions which were placed on companies in all sectors of industry based in Russia earlier this year have also had an impact on the price of crude oil, as Russia is an OPEC country and has a vast oil and raw materials industry which exports its products globally.

Once the ability for Russian oil companies to access their settlement payments for oil and gas in Euros or US Dollars via European and North American banks became impossible due to the freezing of those accounts, and Russian oil companies ended up insisting that European and American customers settle their oil and gas purchases in Rubles via Russian banks, the US Dollar became less connected to the commodities settlement business and the ruble shot up, but of course overall demand for oil remained very high.

As a result, the dollar value of oil is still high indeed.

Some of the top international oil majors have already announced expectations of extremely high revenues, especially in their refining divisions, for the second quarter of this year.

A number of analysts expect at least some of them to step up share buybacks and some even to announce an increase in dividends due to record cash flows and record or near-record earnings.

Some Western oil companies are doing very well indeed, as this is a global phenomenon and a global supply and demand issue.

French supermajor TotalEnergies said last week that “Refining & Chemicals results are expected to be exceptional given the very high levels of distillate and gasoline cracks.”

American oil giant ExxonMobil revealed in an SEC filing earlier this month that the rise in industry margins is set to add between $4.4 billion and $4.6 billion to its Q2 results.

At Shell, which recently moved its headquarters from its native Holland to London purely so that it can be in the global trading center for electronic financial services, the refining margin nearly tripled in Q2 compared to Q1 and is expected to add between $800 million and $1.2 billion to the second quarter results of Shell’s Products division compared to the first quarter of 2022.

Therefore, not only are oil stocks in view, but oil prices themselves.

FXOpen Blog