Daily Market Analysis by IC Markets

GBP/USD:

[B]4hr TF.
[/B]
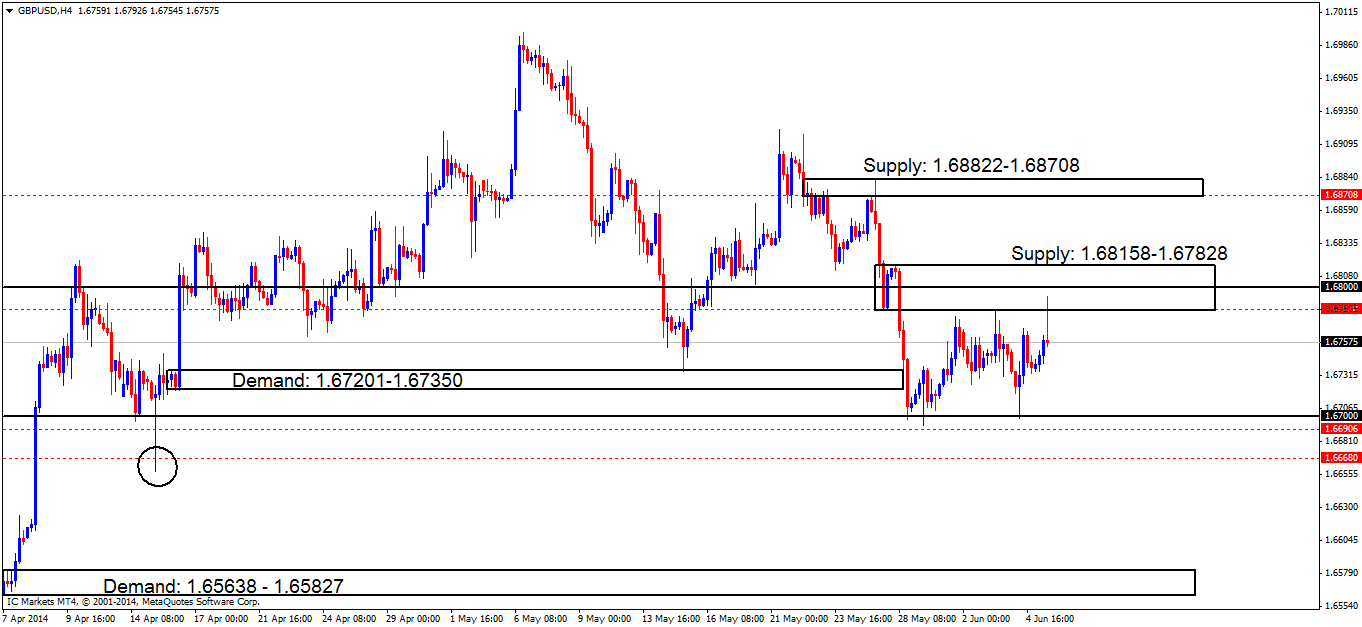
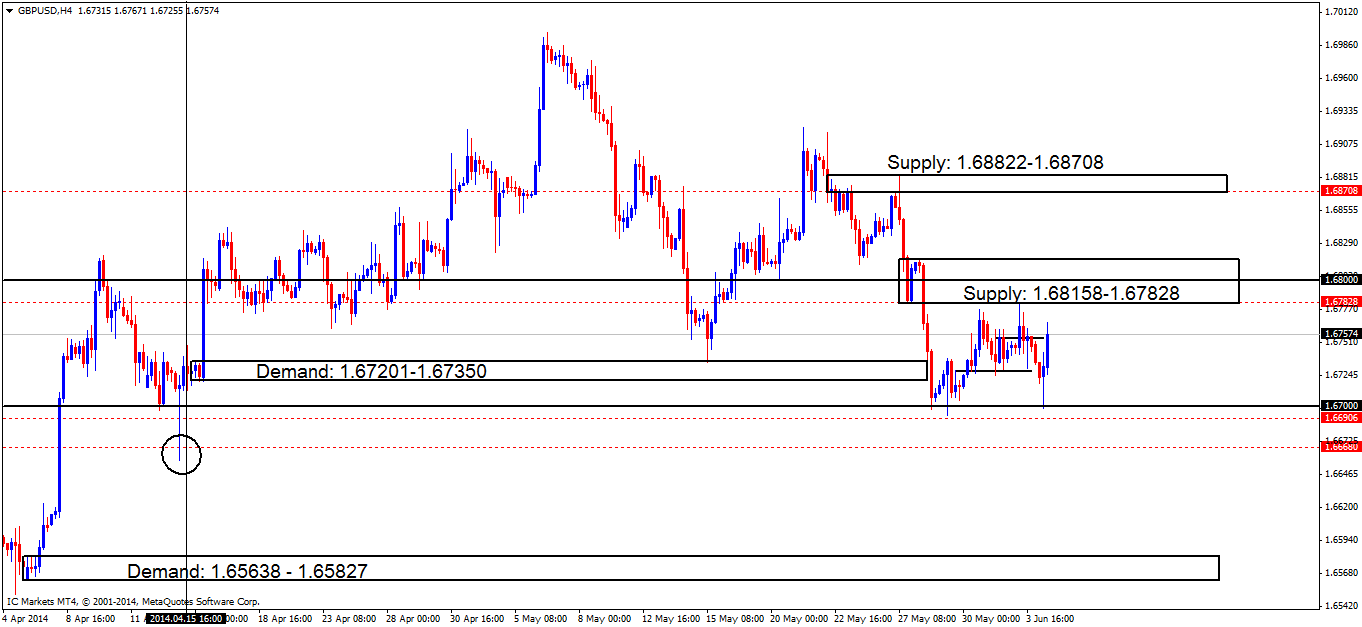
The pound saw a decent drop in value, spiking the round number [B]1.67000[/B]. Price still remains capped between the round number just mentioned and supply above at [B]1.68158 – 1.67828[/B]. Notice how easily price dropped through previous price action happened, this was because of the way price approached supply ([B]levels above[/B]) by essentially spiking lower while rallying price north, consuming buyers, clearing the path for a likely sell off which did happen.

[ul]
[li]Buy orders remain the same (marked with red-dashed lines) at [B]1.66906[/B] below the round number[B]0.67000[/B] which was nearly filled, missing the order by about 8 pips. As explained yesterday, a likely break below the round number mentioned above could see price testing the daily S/R flip level at [B]1.66631[/B], permitting the need for a buy order set just above at [B]1.66680[/B].[/li][li]Sell orders (marked with red-dashed lines) remain the same as yesterday; the near-term sell orders are seen around supply ([B]1.68158 – 1.67828[/B]) at [B]1.67828[/B]. If a break is seen above this capped supply area at [B]1.68158 – 1.67828[/B], this could force price to test the supply area at [B]1.68822 – 1.68708[/B]. Sell orders could then be set at [B]1.68708[/B].[/li][/ul]
[ul]
[li][B]Areas to watch for buy orders:[/B] 1.66906 (SL: 1.66534 TP: [1] 1.67828 [2] 1.68708). Impending orders: 1.66680 (SL: 1.66534 TP: Dependent on future price approach).[/li][li][B]Areas to watch for sell orders[/B]: 1.67828 (SL: 1.68216 TP: 1.67000). Impending orders: 1.68708 (SL: 1.68860 TP: Will be decided on future price approach).[/li][li][B]Most likely scenario: [/B]Similar to the last analysis, a drop in price is still favorable due to higher-timeframe influence, however a spike to either supply area above may happen, the lowest seen at 1.68158 – 1.67828, the highest at 1.68828 – 1.68708.[/li][/ul]
AUD/USD:

[B]4hr TF.
[/B]
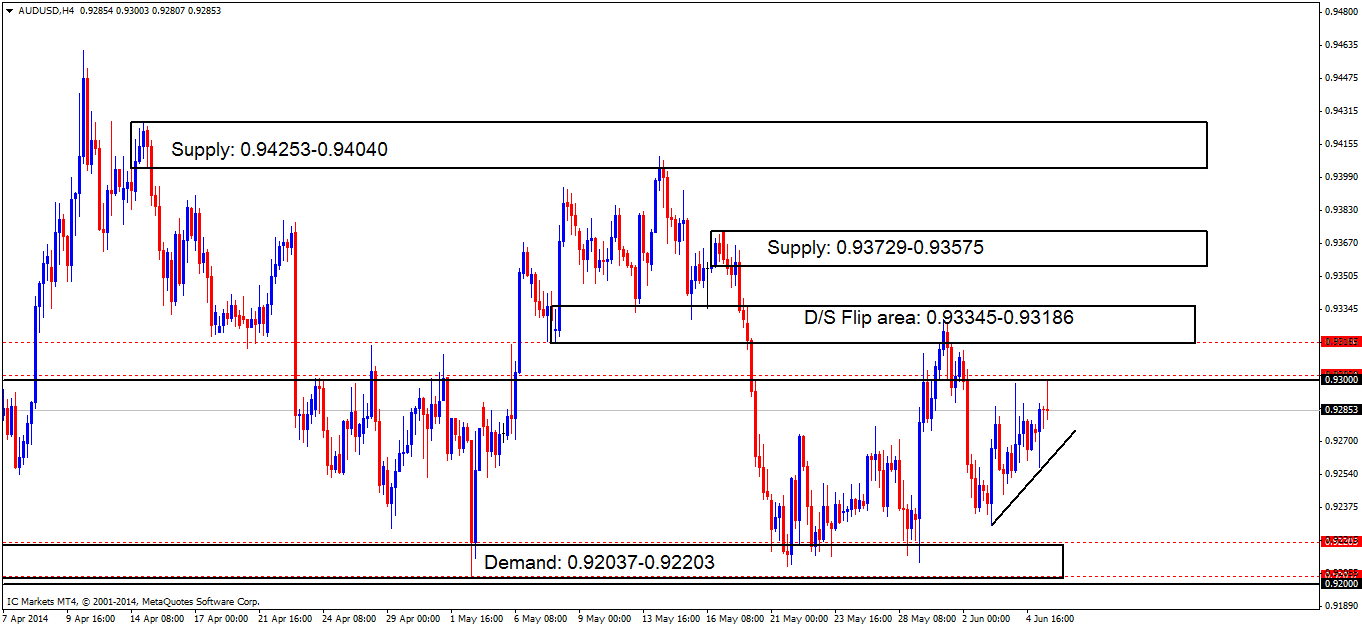
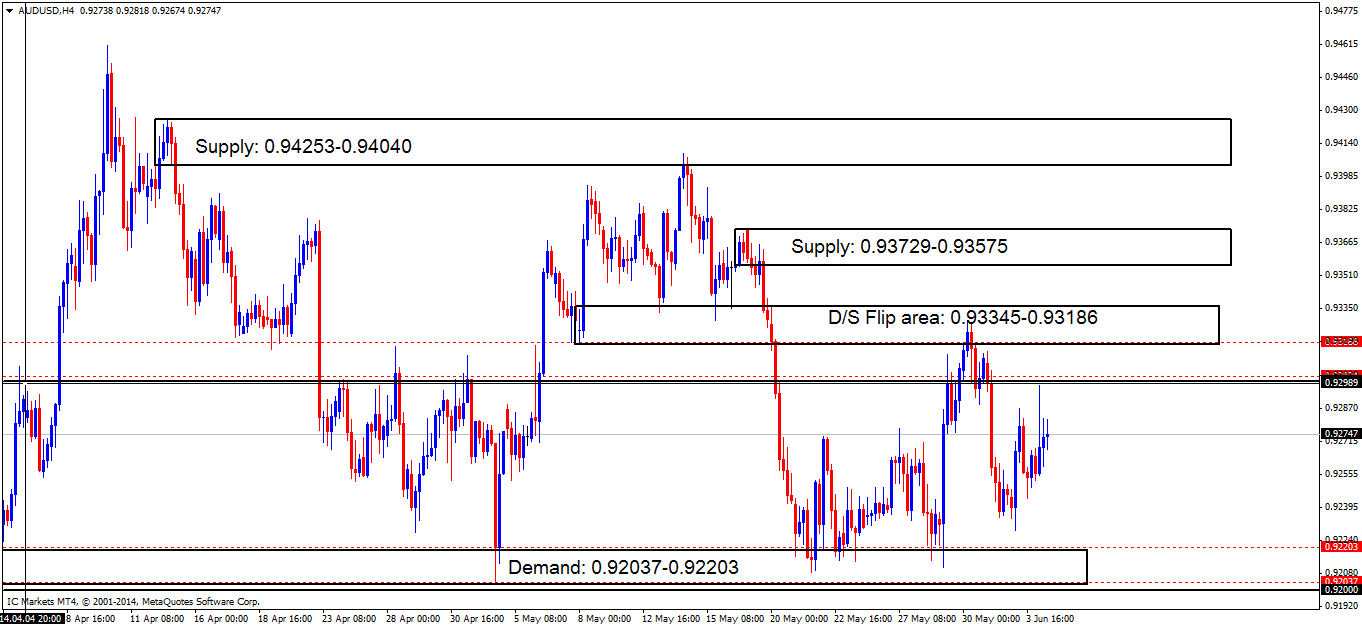
The capped area has yet to see a breach of either supply ([B]0.93345 – 0.93186[/B]) or demand ([B]0.92037 – 0.92203[/B]). An attempt to test the round number [B]0.93000 [/B]was seen, clearly supply around this area is very strong as the buyers were unable to touch the level, let alone consume it.

[ul]
[li]Buy orders (marked with red-dashed lines) are still seen at [B]0.92203[/B] around the demand area below ([B]0.92037 – 0.92203[/B]). Due to the amount of touches this demand area has seen over the recent weeks, pro money may decide to push price lower on its next visit, testing the lower limits of the demand area, so buy orders are seen just above the round number([B]0.92000[/B]) at [B]0.92037[/B].[/li][li]Sell orders (marked with red-dashed lines) are set at [B]0.93186[/B] around the supply area above ([B]0.93345-0.93186[/B]). Due to recent price action (briefly mentioned above), new sell orders are seen just above the round number [B]0.93000[/B] at [B]0.93027[/B].[/li][/ul]
[ul]
[li][B]Areas to watch for buy orders:[/B] 0.92203 (SL: 0.91942 TP: [1] 0.93000 [2] 0.93186) 0.92037 (SL: 0.91942 TP: [1] 0.93000 [2] 0.93186).[/li][li][B]Areas to watch for sell orders[/B]: 0.93186 (SL: 0.93381 TP: [1] 0.93000 [2] Dependent on the way price action approaches this area but will likely be at 0.92203 ) 0.93027 (SL: 0.93381 TP 0.92203)[/li][li][B]Most likely scenario: [/B]Due to higher-timeframe influence, selling seems to be in order at the moment. Pro money will likely spike north above the round number 0.93000 triggering sell orders at the D/S flip area at 0.93345 – 0.93186, for an overall bigger push down, bullish reactions are expected around the demand area at 0.92037 – 0.92203.[/li][/ul]
USD/JPY:

[B]Daily/4hr TFs.
[/B]
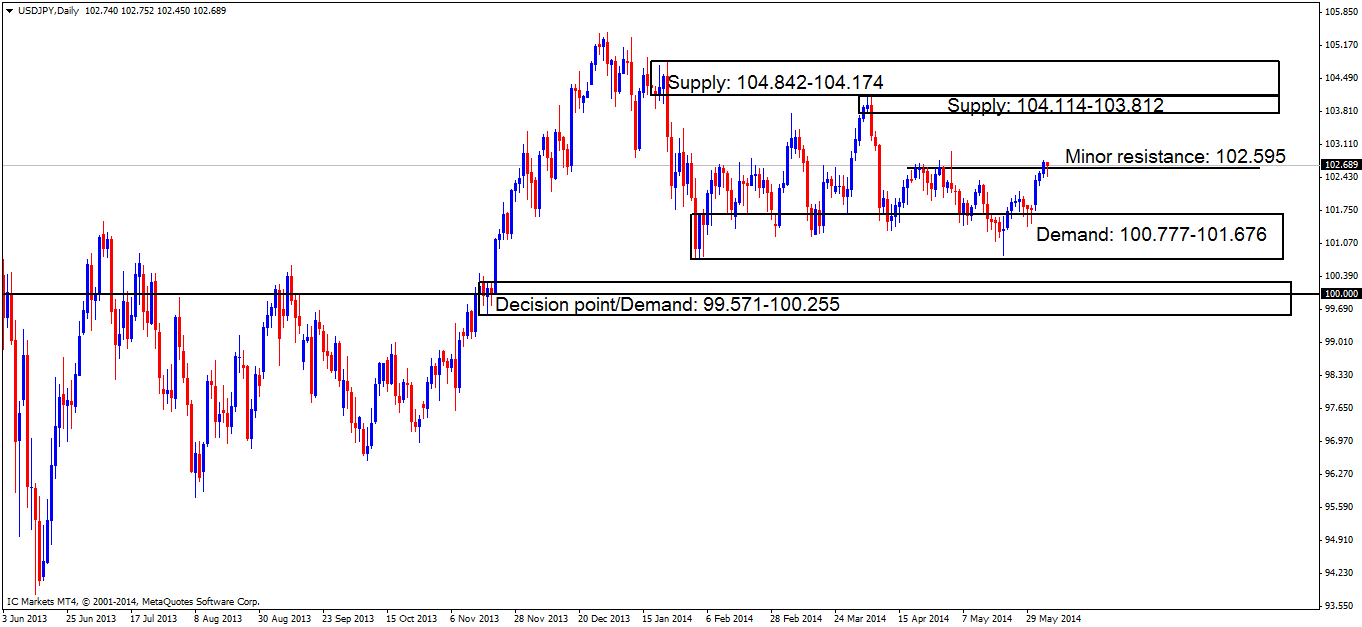
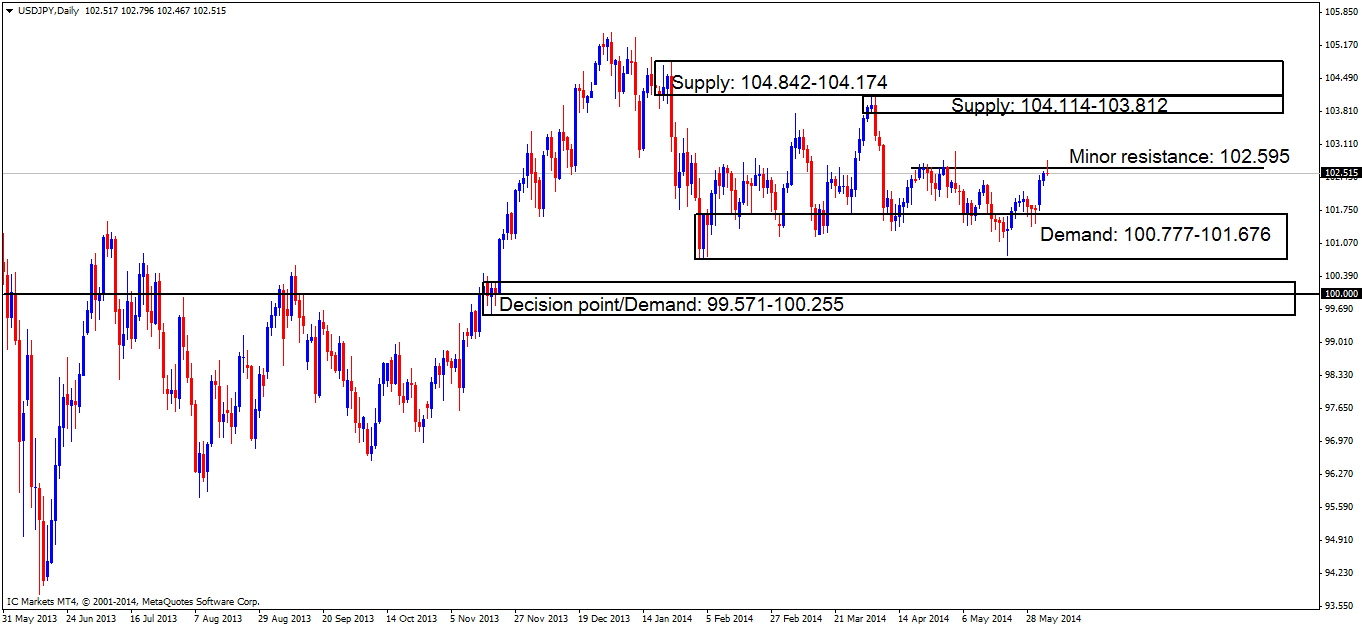
Below is the daily timeframe showing what the bigger picture looks like, the buyers really did take charge recently, but have hit minor resistance at [B]102.595[/B]. If price were to consume the sellers here, this would open a beautiful-looking price void up until supply at [B]102.114 – 103.812
[/B]

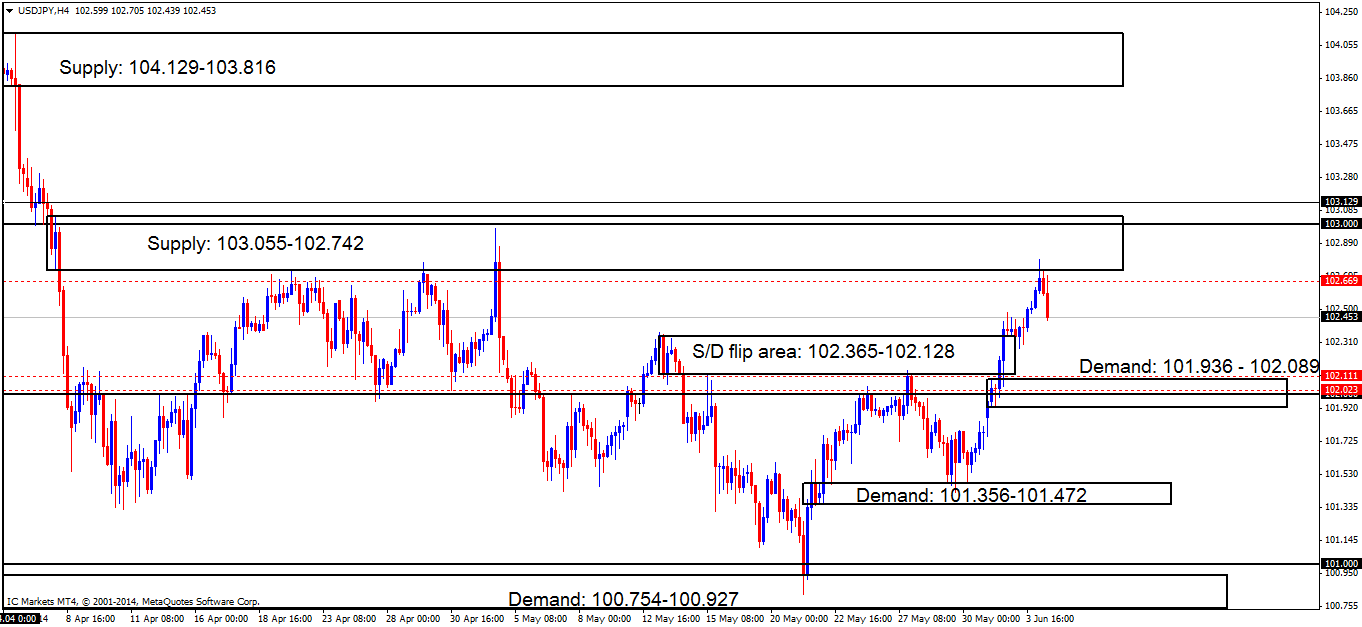
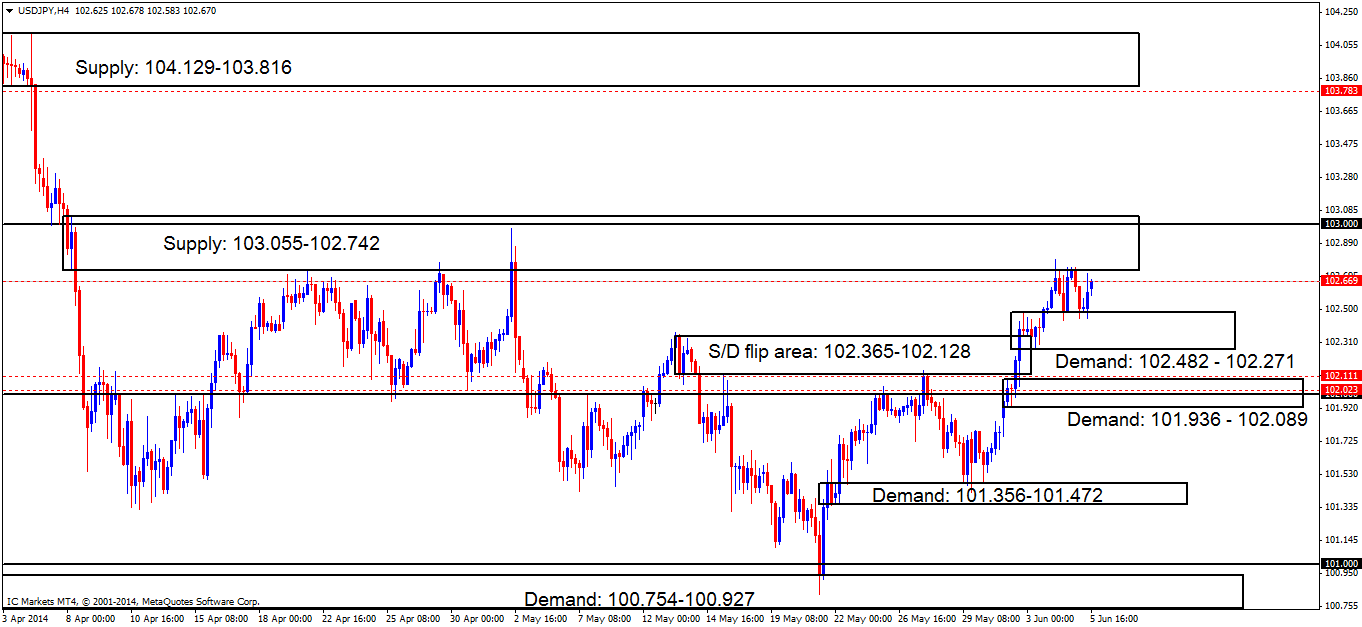
The buyers on the 4hr timeframe (shown below) had recently taken control rallying straight through the price void (room for profit) to supply at [B]103.055 – 102.472[/B], where a reaction is currently taking place.

The 4hr chart also shows how neatly price reacted off of supply at [B]103.055 – 102.472[/B], which is expected to at least reach the demand area below at [B]101.936 – 102.089[/B]. Do bear in mind though, we are still currently reacting off of weekly support at [B]101.254[/B], so any sudden bullish surge should be noted down and expected.

[ul]
[li]Buy orders (marked with dashed red lines) are seen at [B]102.111[/B] and also at [B]102.023[/B], incorporated in and around demand at [B]101.936 – 102.089[/B].which is where price will likely head to next after a reaction has already been seen at supply ([B]levels above)[/B].[/li][li]The sell orders at [B]102.699[/B] have been executed and at the time of writing, are in a nice profit possibly heading down to demand below at [B]101.936 – 102.089[/B].[/li][/ul]

[ul]
[li][B]Areas to watch for buy orders:[/B] 102.111 (SL: 101.899 TP: [At the time of writing] 102.699) 102.023 (SL: 101.899 TP: [At the time of writing] 102.699).[/li][li][B]Areas to watch for sell orders /B 102.699 (SL: 103.088 TP: [At the time of writing] [1] 102.111 [2] 101.511).[/li][li][B]Most likely scenario: [/B]Price has currently reacted off of supply at 103.055 – 102.472 and will likely now head south towards demand at 1-1.936 – 102.089.[/li][/ul]

EUR/GBP:

[B]Weekly/Daily/4hr TFs.
[/B]
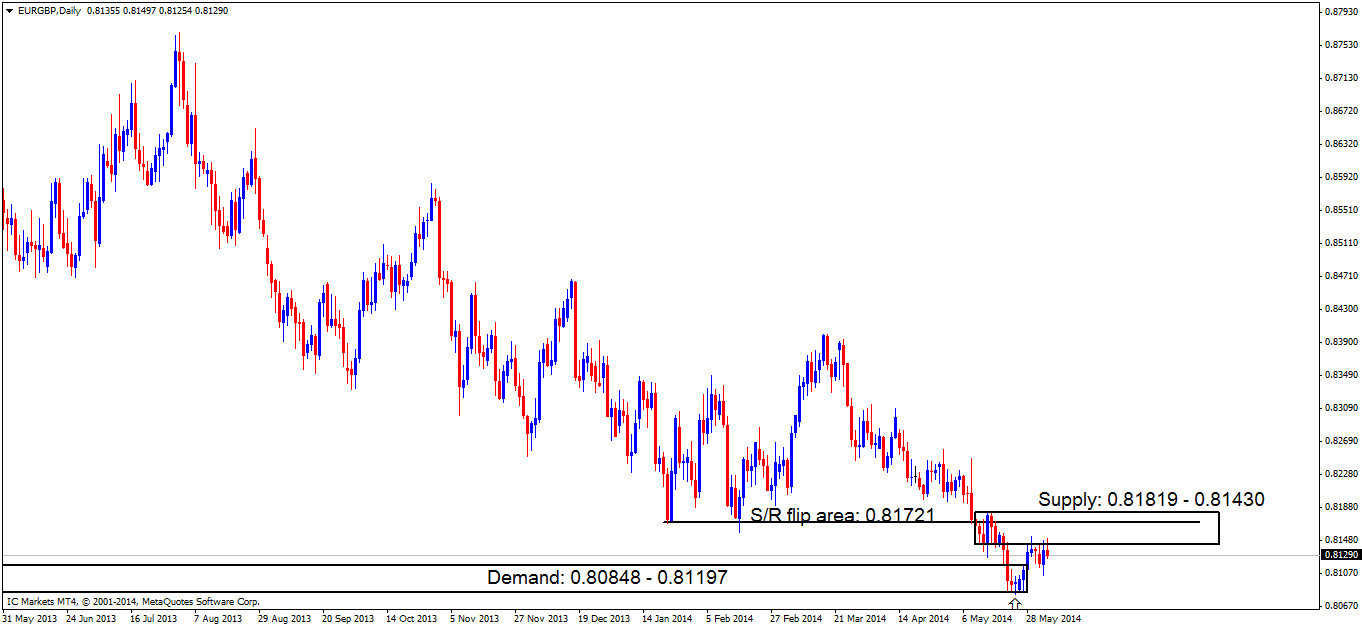
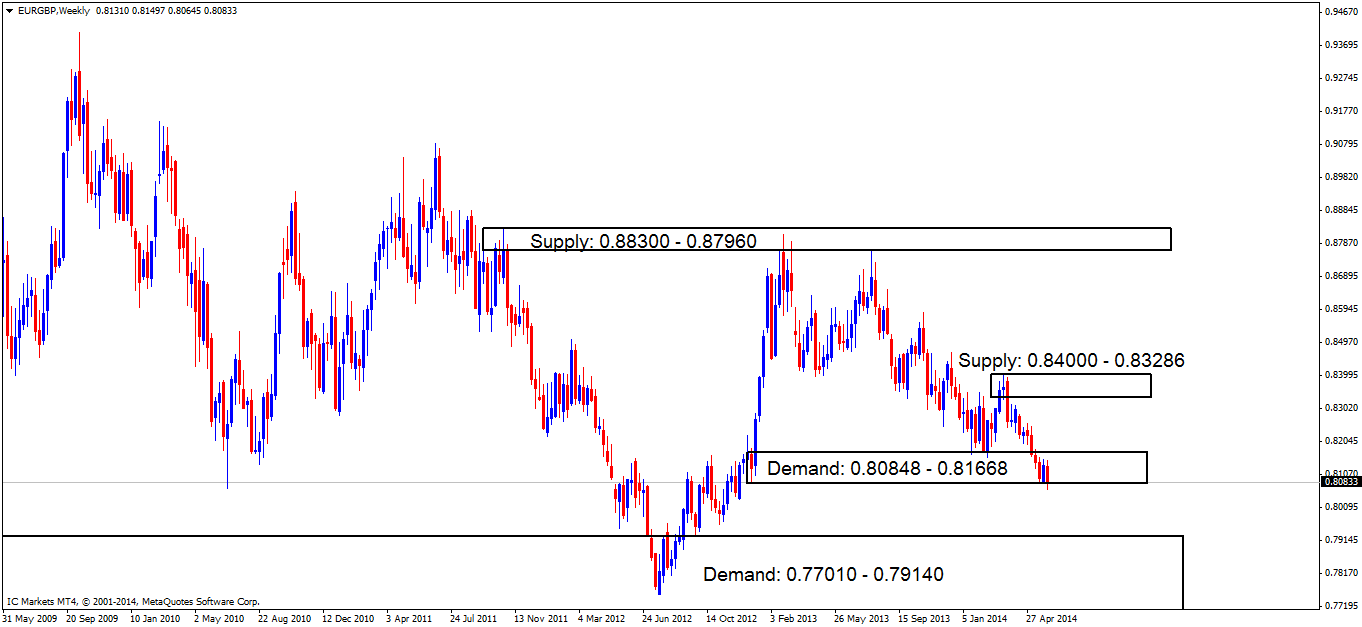
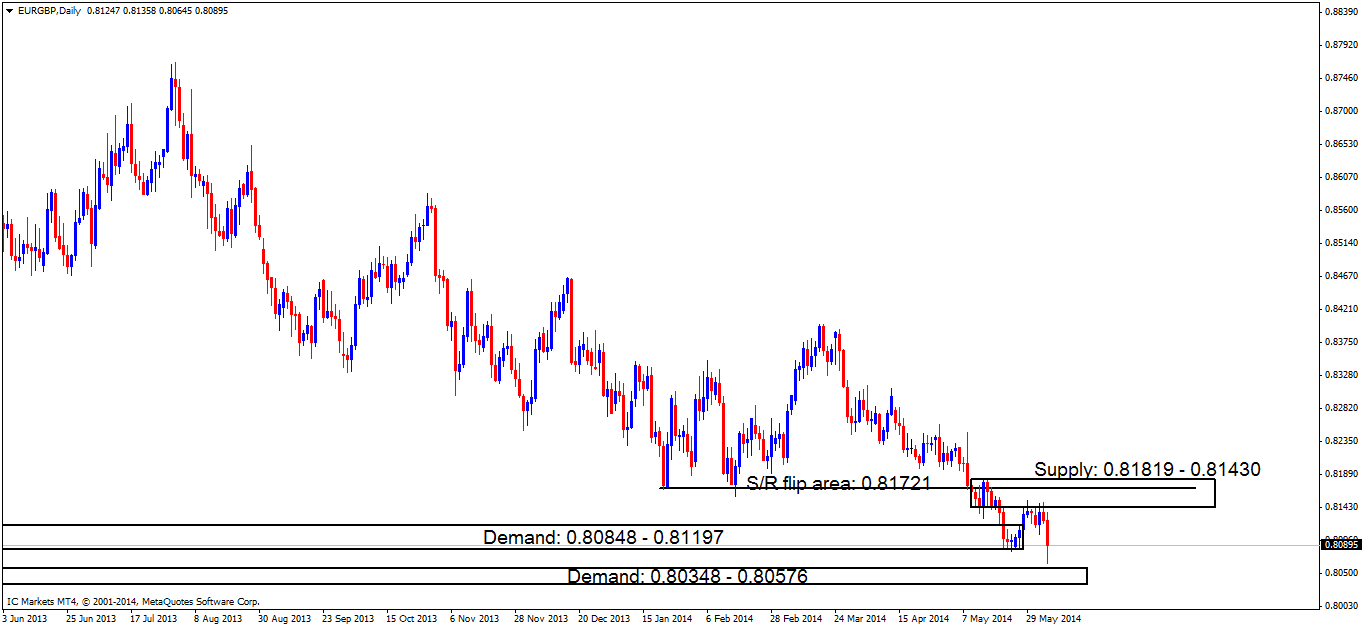
Whilst the weekly timeframe is in demand (shown on the chart 1 below) at [B]0.80848 – 0.81668[/B], the daily timeframe (chart 2) is showing price struggling at supply ([B]0.81819 – 0.81430[/B]), we are beginning to see a conflict in signals here.

Chart 1:

Chart 2:


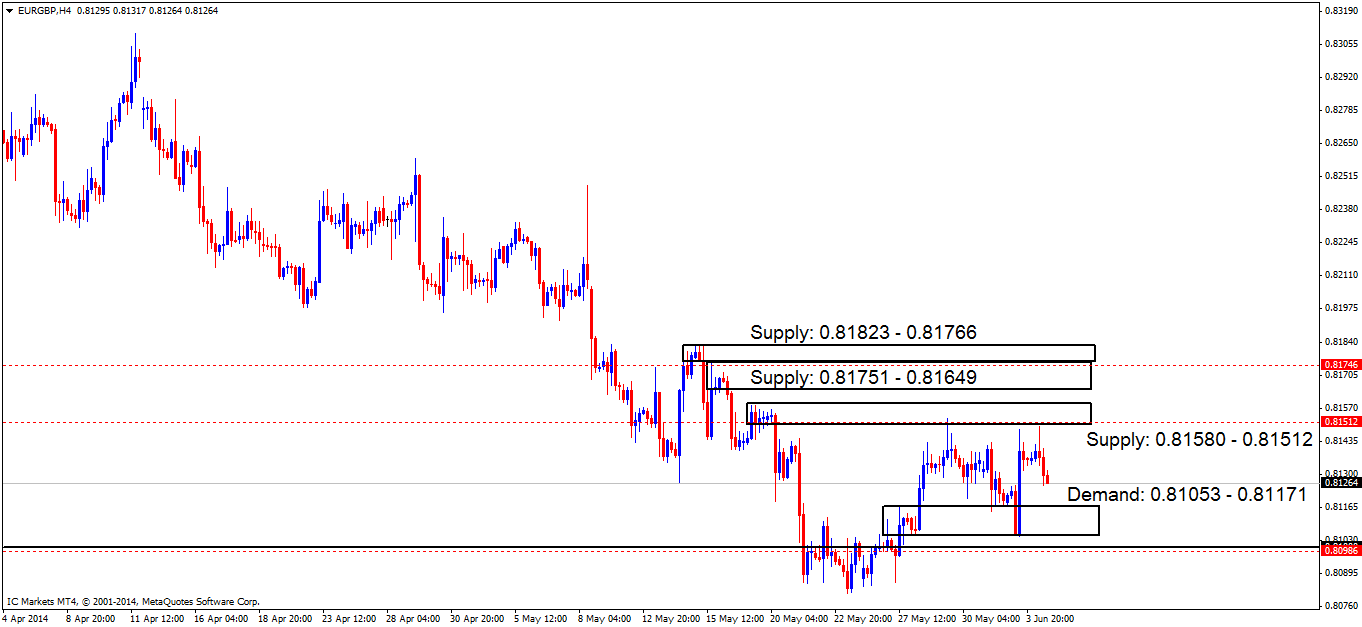
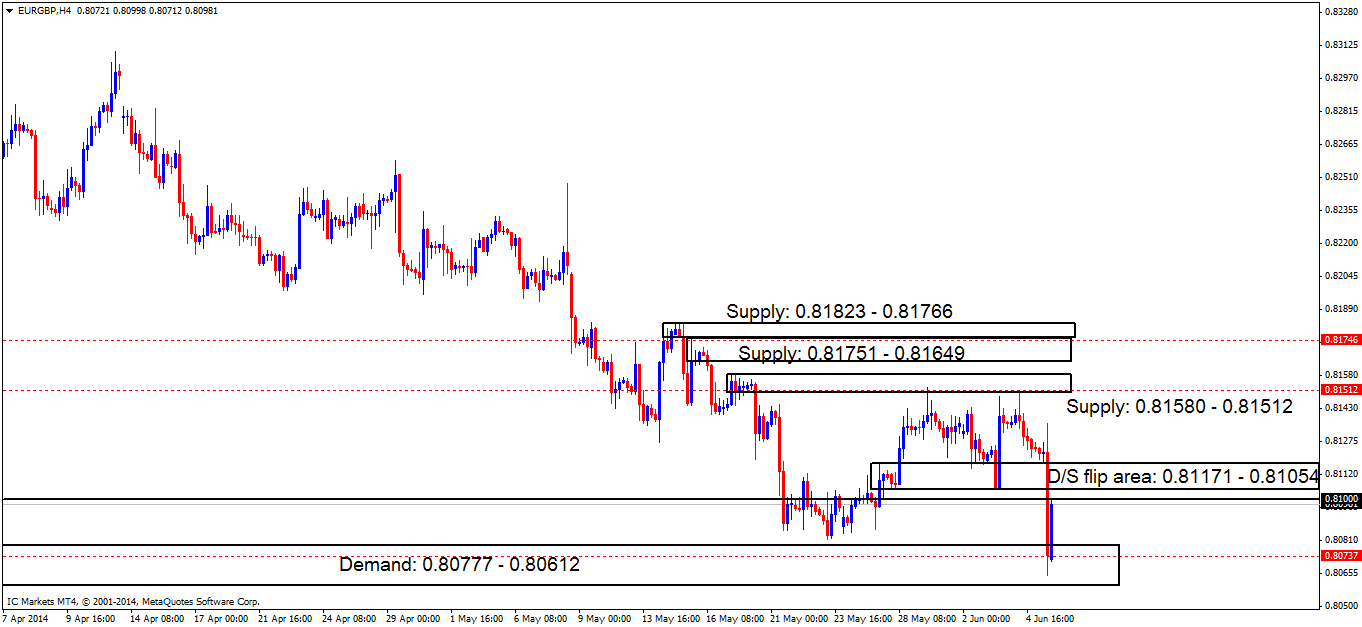
On the 4hr timeframe (shown on the chart below), price still remains capped between demand at[B]0.81053 – 0.81171[/B] and supply at [B]0.81580 – 0.81512[/B]. Theoretically, we should see higher prices with the weekly timeframe demand taking precedence over the daily supply ([B]levels above[/B]).

[ul]
[li]New buy orders (marked with red-dashed lines) are now seen below demand ([B]0.81053 – 0.81171[/B]) and below the round number [B]0.81000[/B] at [B]0.80986[/B]. Because the analysis above is saying higher prices are to be expected, pro money will require liquidity for this, so a spike south below demand and below the round number ([B]levels above[/B]) to [B]0.80986[/B] seems logical, this will likely stop out a lot of buyers handing over lots of sell orders for pro money to buy into.[/li][li]It is unbelievable, look how close price came to filling the sell orders orders (marked with red-dashed lines) at [B]0.81512[/B]! If the sell order is eventually triggered, and price hits the stop, the break of this supply would possibly see a rally up to the highest of the 3 stacked supply areas at [B]0.81823 – 0.81766[/B], as price usually tests the extreme zones when areas are stacked similar to this. Impending sell orders will be set just below the supply area just mentioned at [B]0.81746[/B].[/li][/ul]

[ul]
[li][B]Areas to watch for buy orders:[/B] 0.80988 (SL: 0.80799 TP: [1] 0.81512 [2] 0.81746).[/li][li][B]Areas to watch for sell orders[/B]: 0.81512 (SL: 0.81605 TP: 0.81171). Impending orders: 0.81746 (SL: 0.81845 TP: Will be decided depending on approaching price action)[/li][li][B]Most likely scenario: [/B]Pro money will likely spike south below demand at 0.81053 – 0.81171, and also below the round number 0.81000 to 0.80986 likely stopping out lots of buyers (creating sell orders) in the process, allowing pro money to buy into these orders for an overall bigger push north, as the higher timeframe is indicating.[/li][/ul]

USD/CAD:

[B]Daily/4hr TFs.
[/B]
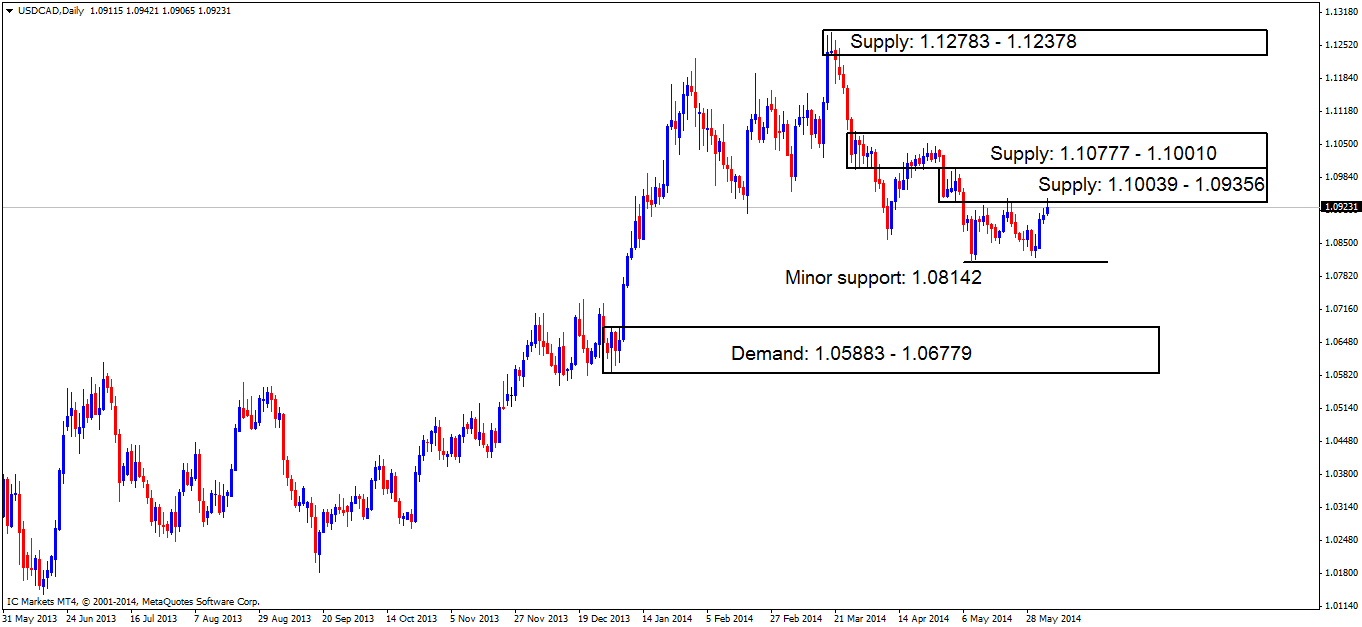
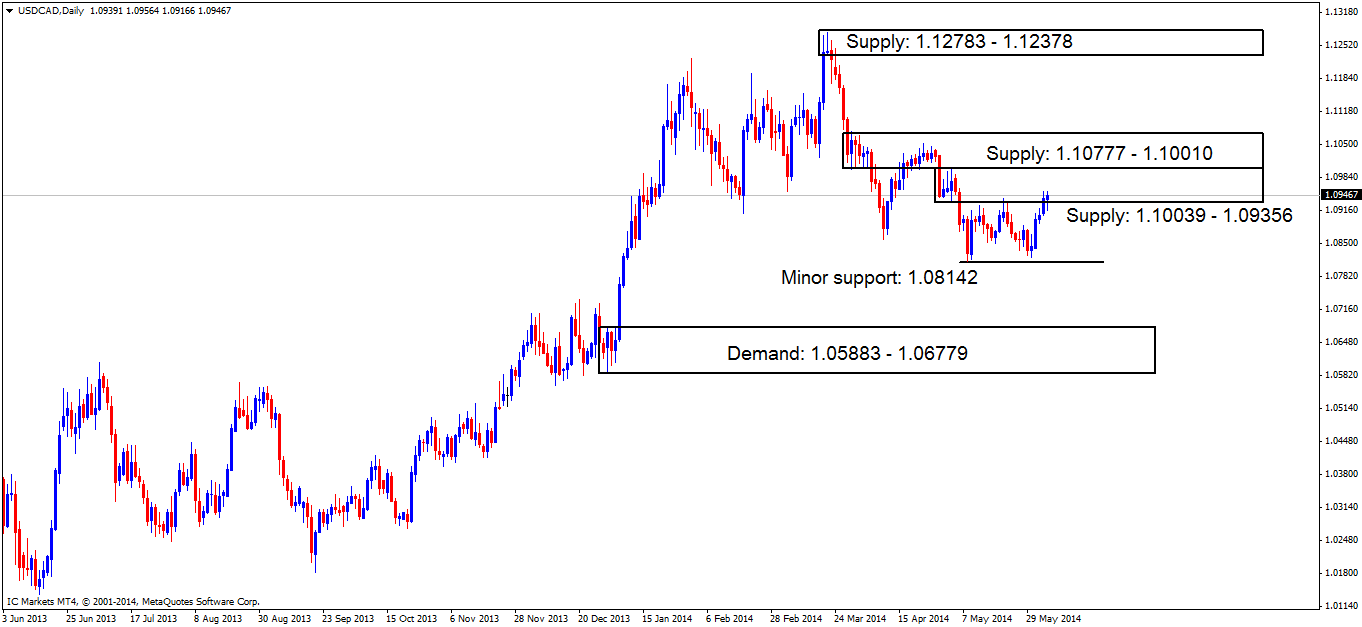
The Daily timeframe is currently trading in the lowest of the two stacked supply areas at [B]1.10039 – 1.09356[/B] seeing a small bearish reaction.


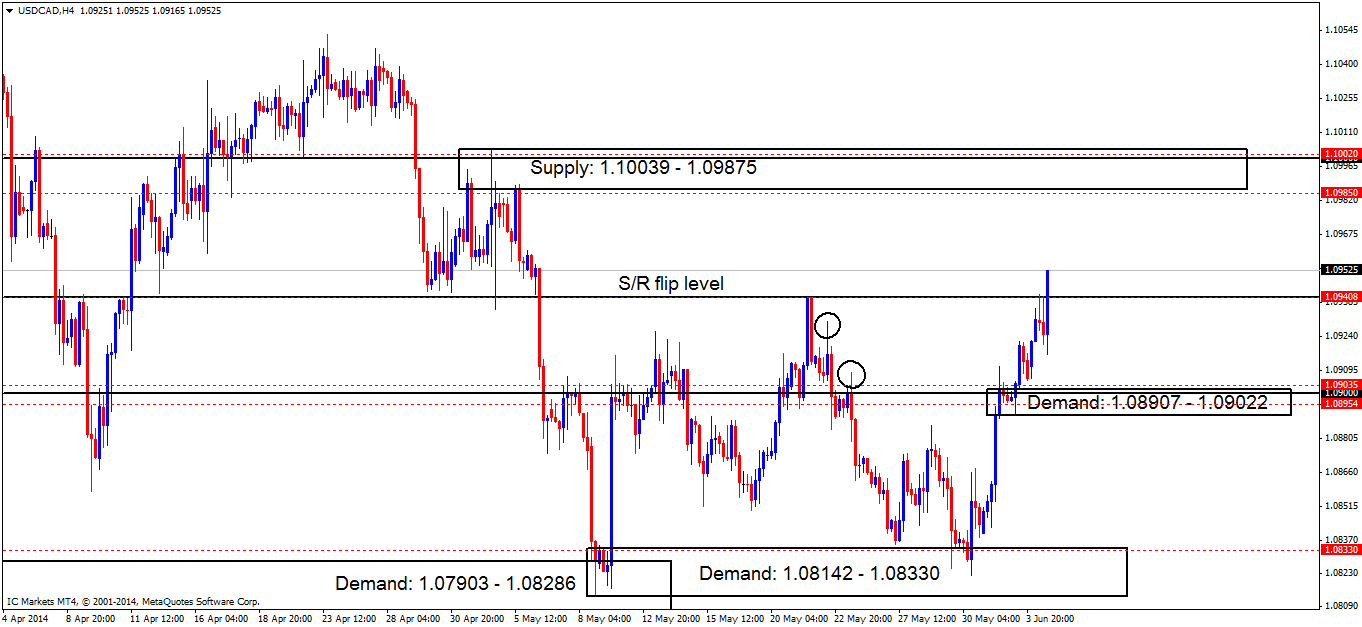
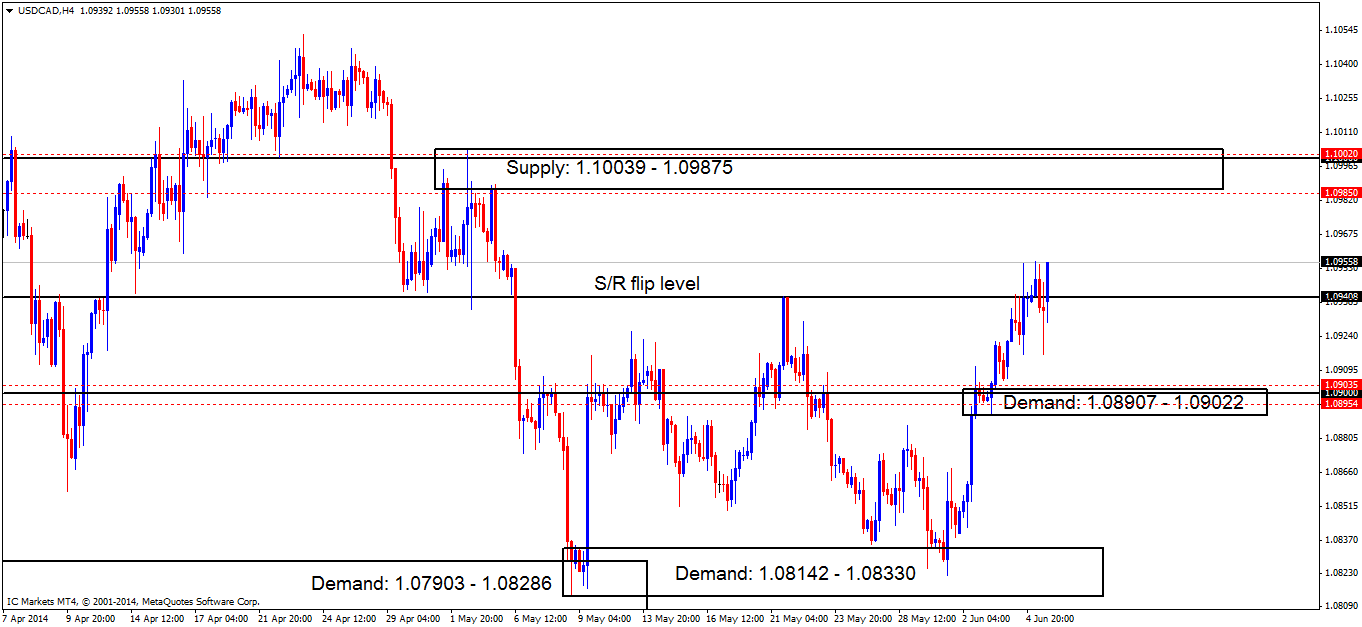
Price rallied beautifully into the S/R flip level at [B]0.09408 [/B](seen below on the 4hr chart) and is currently seeing a bearish reaction with two beautiful-looking spikes. It was reported that price may do this in yesterday’s analysis because of the two wicks to the left (circled). These wicks indicated supply consumption, telling us price can rally with little selling pressure.

At the time of writing price is currently capped between the S/R flip level just mentioned above and demand below at [B]1.08907 – 1.09022[/B].

[ul]
[li]Buy orders (marked with a red-dashed line) are currently seen around the newly-formed demand ([B]1.08907 – 1.09022[/B]) at [B]1.09035[/B] and [B]1.08954[/B] on the expectation a retracement may happen from the daily supply area ([B]levels above[/B]).[/li][li]The sell orders (marked with a red-dashed line) at the S/R flip level ([B]0.09408[/B]) have been executed, if this trade is stopped out new sell orders are seen above, in and around supply at[B]1.10039 – 1.09875[/B], The nearest being seen just under supply at [B]1.09850[/B], the next seen just above the round number ([B]1.10000[/B]) at [B]1.10020[/B] as pro money absolutely love to spike these big figure levels to stop traders giving them easy liquidity.[/li][/ul]

[ul]
[li][B]Areas to watch for buy orders:[/B] Impending orders: 1.08330 (SL: 1.08114 TP: Dependent on approaching price action) 1.09035 (SL: 1.08886 TP: 1.09408)1.08954 (SL: 1.08886 TP: 1.09408).[/li][li][B]Areas to watch for sell orders[/B]: (Active) 1.09408 (SL: 1.09564 TP: 1.09035). Impending orders: 1.09850 (SL: 1.10063 TP: Dependent on approaching price action nearer the time) 1.10020 (SL: 1.10063 TP: Dependent on approaching price action nearer the time).[/li][li][B]Most likely scenario: [/B]Price will likely see a drop in value today due to price currently trading in daily supply at [B]1.10039 – 1.09356[/B], but do not discount the possibility of a push north before this happens. If the drop is seen today, price will likely visit demand at [B]1.08907 – 1.09022[/B].[/li][/ul]

USD/CHF:

[B]Daily/4hr TFs.
[/B]
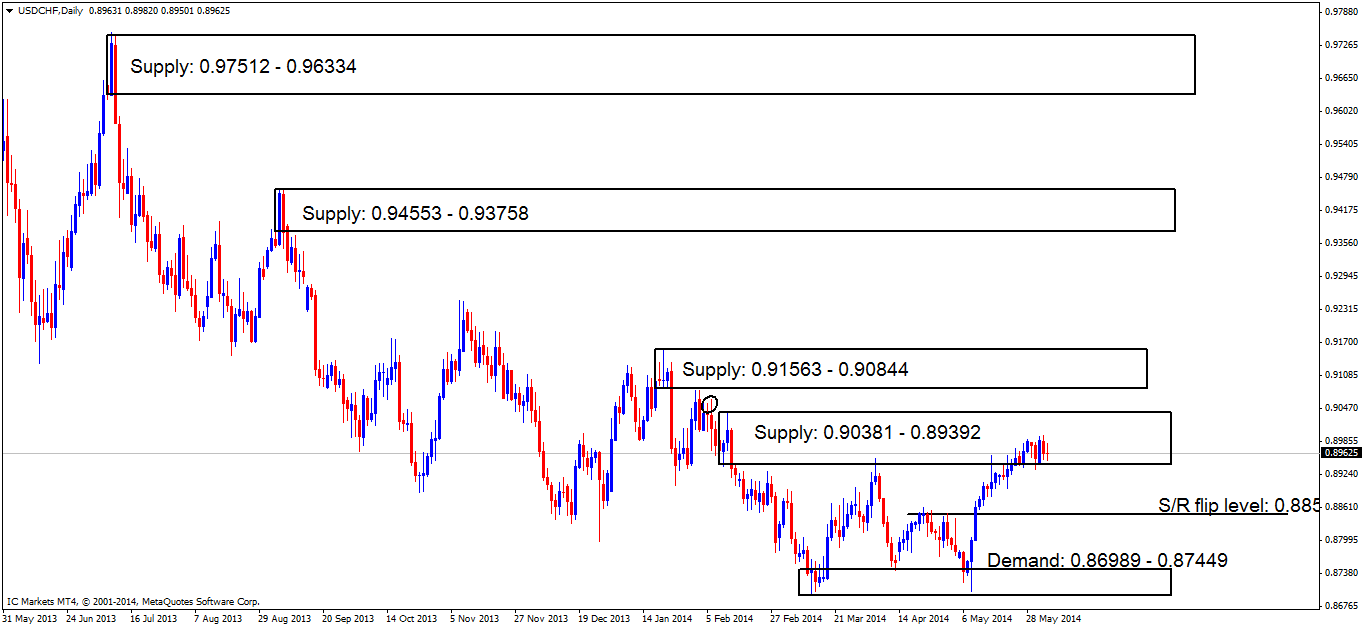
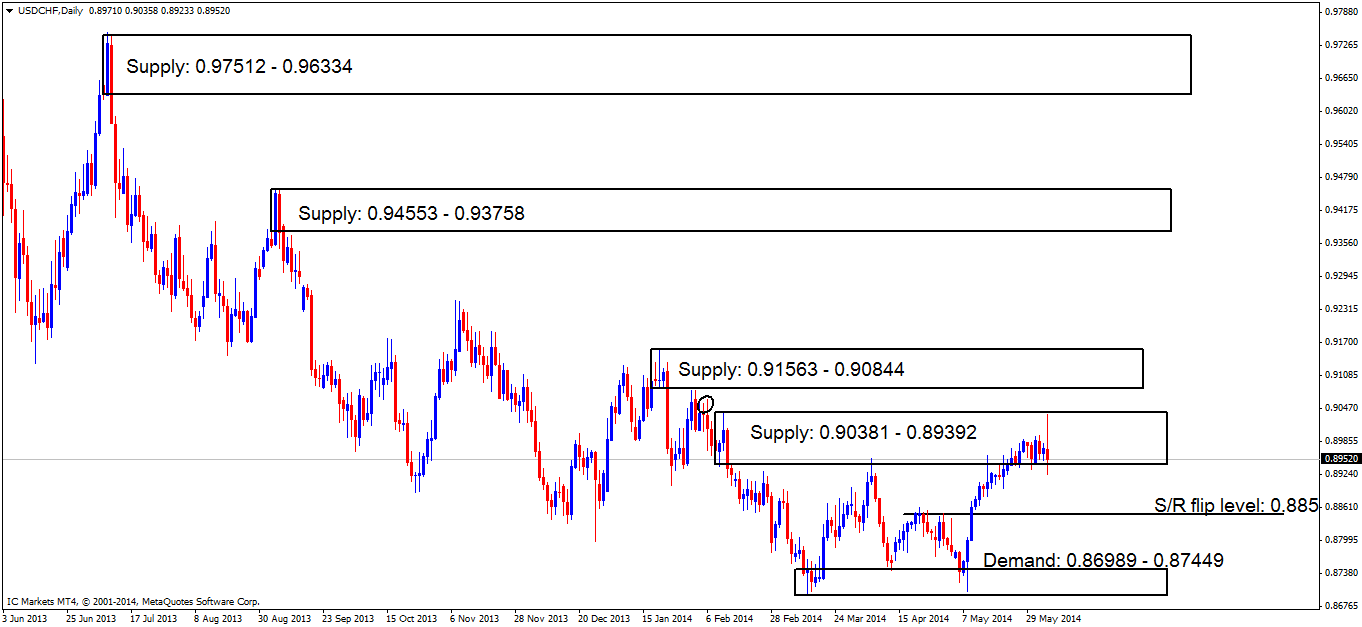
The daily timeframe is currently seen trading in supply at [B]0.90381 – 0.89392[/B] (below).


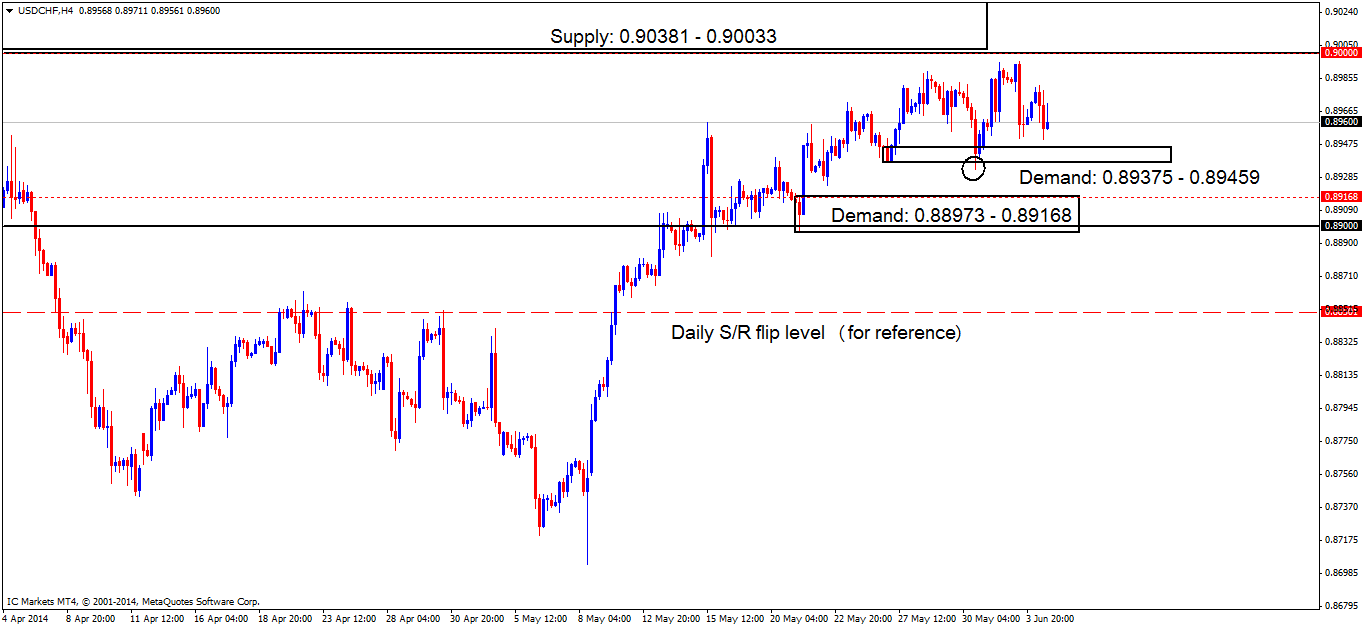
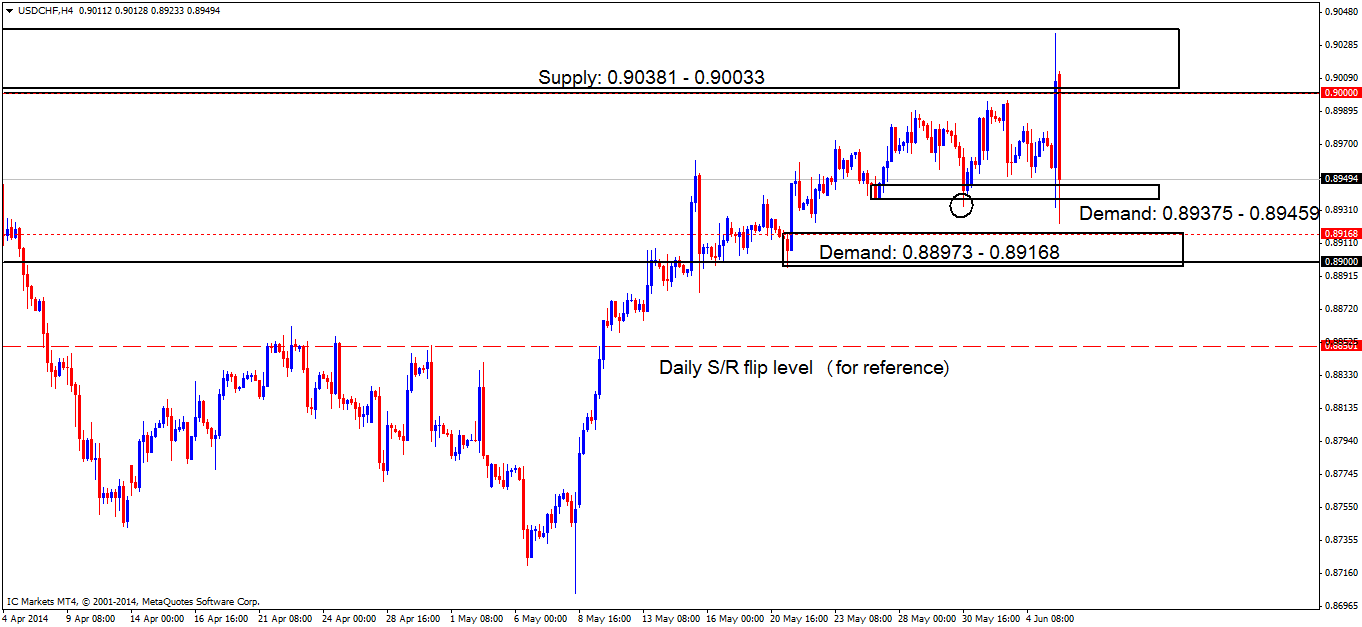
The 4hr timeframe has not seen any developments since the last analysis, this pair is becoming very frustrating to trade at the moment, however, it is worth remembering the circled tail that consumed demand at [B]0.89375 – 0.89459[/B] is a very important signal indicating lower prices may be seen to at least the next demand ([B]0.88973 – 0.89168[/B]) below.

[ul]
[li]Buy orders (marked with a red-dashed line) remain the same as the last analysis with orders seen below at [B]0.89168 [/B]around the base of demand ([B]0.88973 – 0.89168[/B])[/li][li]Sell orders also remain the same being seen at the big figure level [B]0.90000[/B], as pro money may spike this level north to collect seller’ stops (buy orders) along with breakout buyers orders to sell into for the overall likely push south.[/li][/ul]

[ul]
[li][B]Areas to watch for buy orders:[/B] 0.89168 (SL: 0.88942 TP: (Overall) 0.90000, but subject to change depending on price action).[/li][li][B]Areas to watch for sell orders[/B]: 0.90000 (SL: 0.90398 TP: 0.89168).[/li][li][B]Most likely scenario:[/B] Price will likely retrace north from where price is currently trading at the time of writing, up to the round number [B]0.90000[/B] area to collect liquidity for a possible drop in price.[/li][/ul]

XAU/USD (GOLD)

[B]Daily/4hr TFs.
[/B]
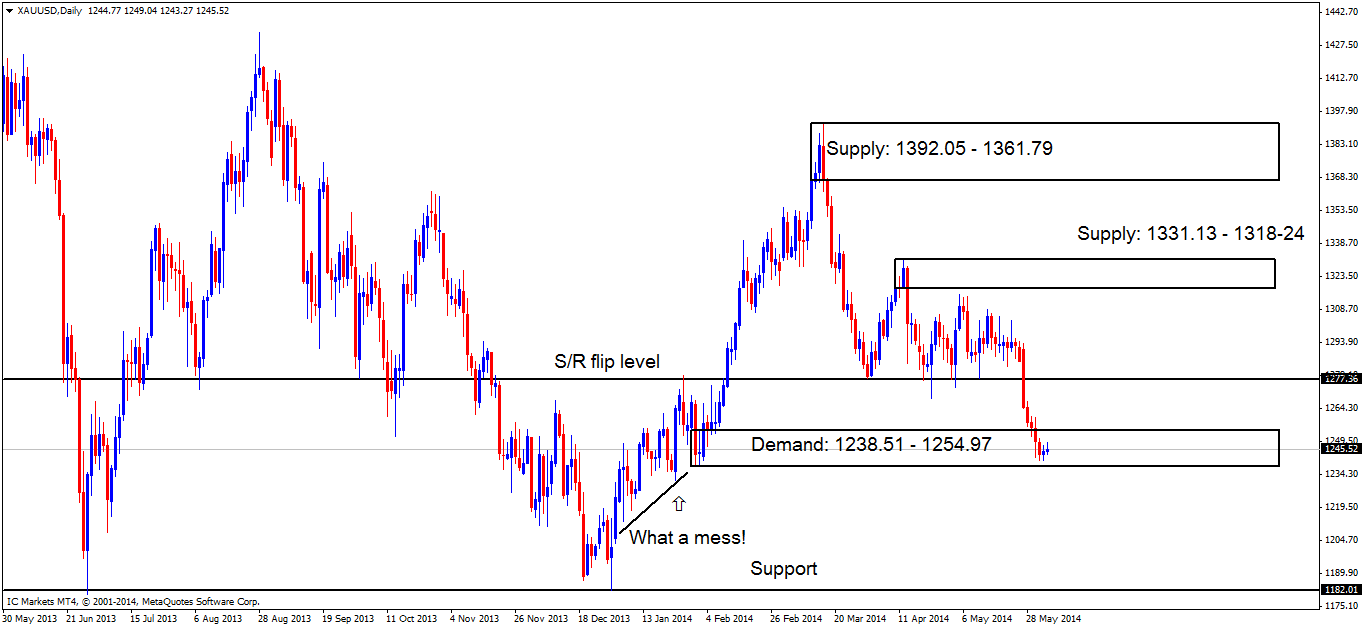
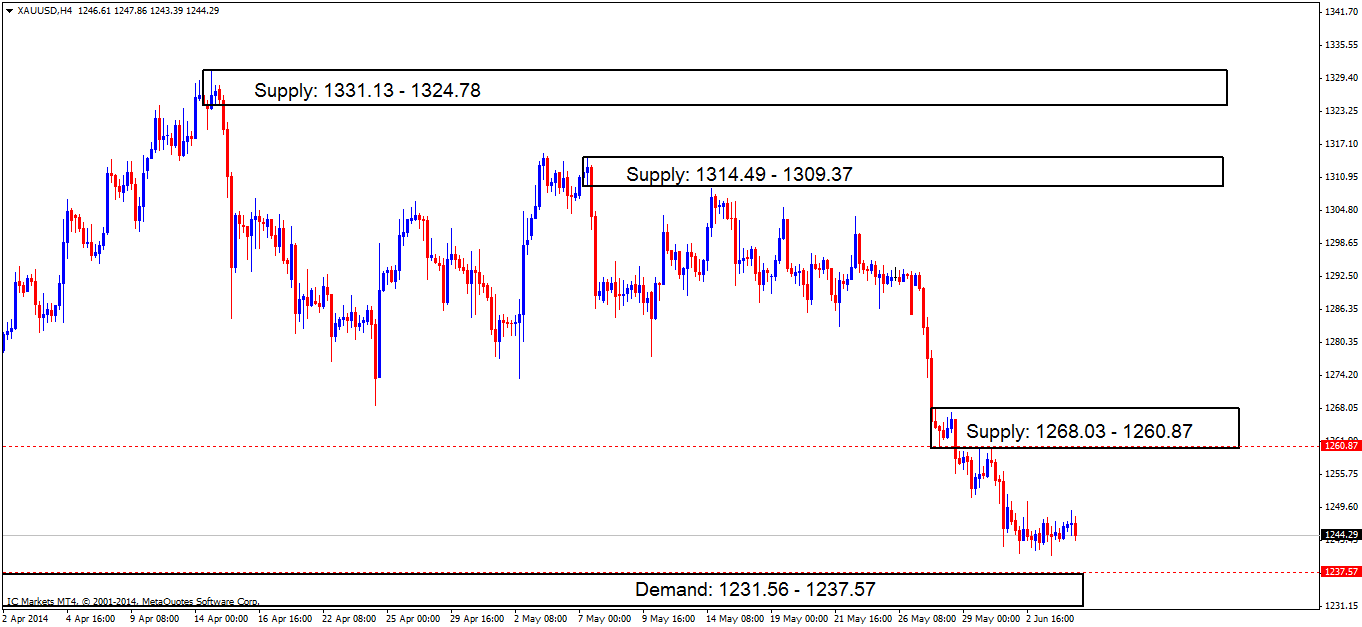
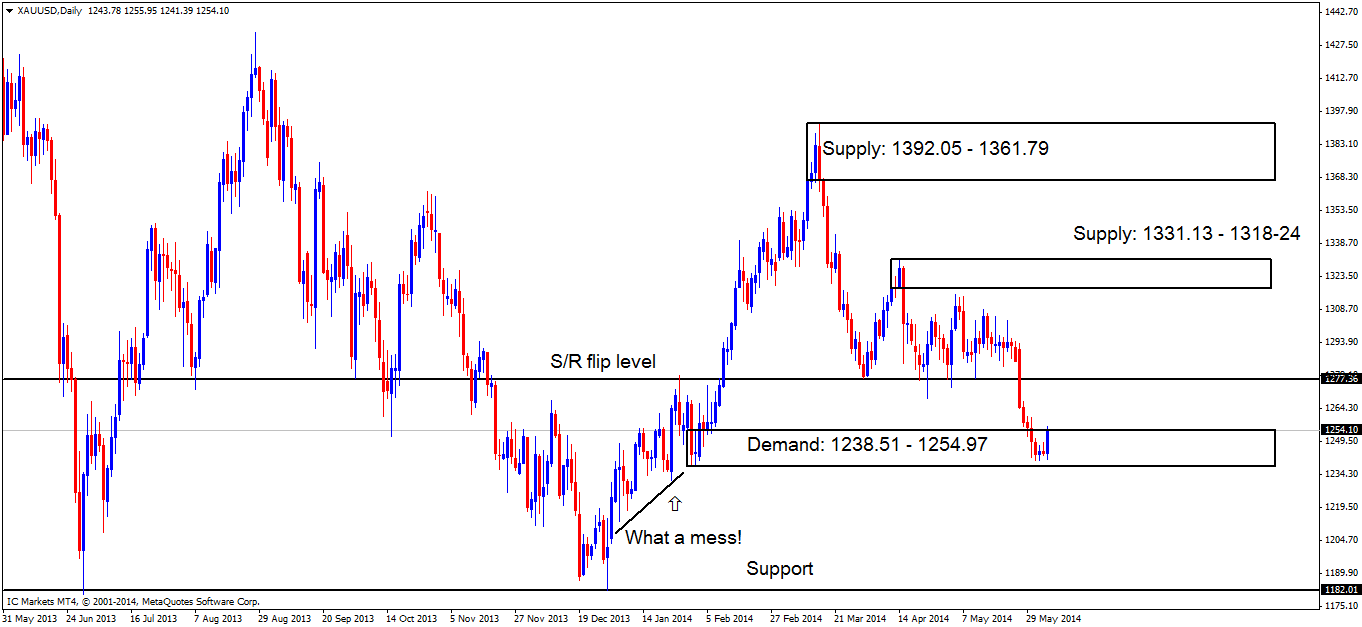
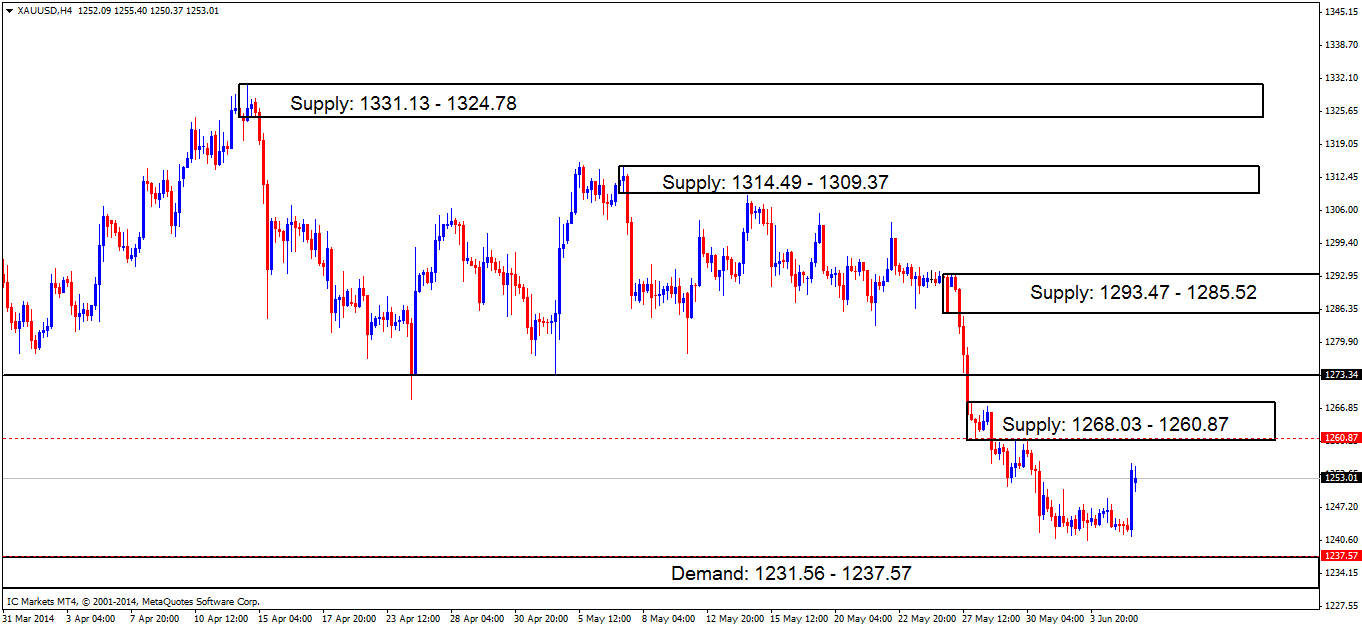
The daily chart shows price is still trading within a great-looking demand area at [B]1238.51 – 1254.97[/B].


The 4hr timeframe shows stagnant price action, exhibiting no development whatsoever in the recent days trading.

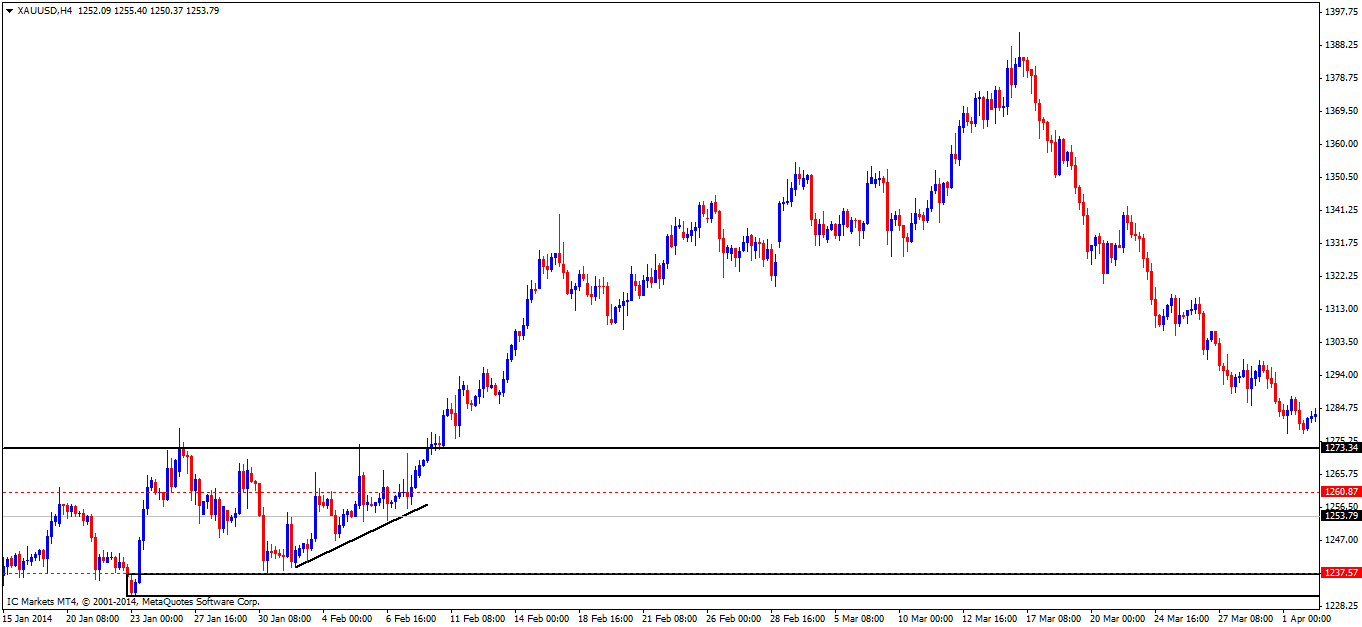
Near-term supply is seen at [B]1268.03 – 1260.87[/B] with near-term demand being seen below at [B]1231.56 – 1237.57 [/B]which is just beneath daily demand at [B]1238.51 – 1254.97[/B].

[ul]
[li]Buy orders (marked with a red-dashed line) are seen around demand ([B]1231.56 – 1237.57[/B]) just below where price is currently ranging at [B]1237.57[/B]. Price may spike below this ranging price action to stop out any lower-timeframe buyers playing the limits of this range, gaining the much-needed liquidity (sell stops) to buy into.[/li][li]Sell orders (marked with a red-dashed line) remain the same (marked with a red-dashed line) around supply ([B]1268.03 – 1260.87[/B]) at [B]1260.87[/B].[/li][/ul]

[ul]
[li][B]Areas to watch for buy orders:[/B] 1237.57 (SL: 1230.48 TP: 1260.87).[/li][li][B]Areas to watch for sell orders[/B]: 1260.87 (SL: 1268.99 TP: 1237.57).[/li][li][B]Most likely scenario: [/B]Price will likely spike below demand at [B]1236.56 – 1237.57[/B], possibly pushing prices higher from there.[/li][/ul]

EUR/USD

[B]Daily/4hr TFs.
[/B]
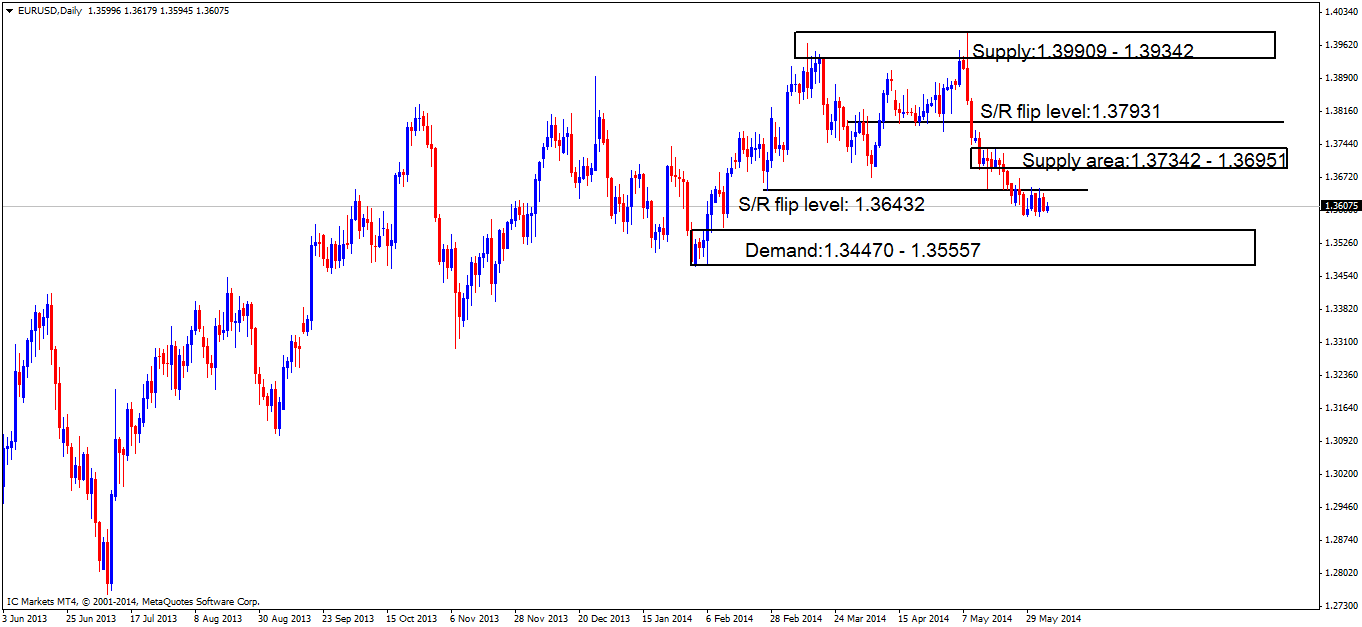
Price is still trading within weekly demand at [B]1.34770 – 1.36771[/B], so higher prices are naturally expected, but how far do the sellers take price before we see any sign that buyers are interested? The Daily chart shows demand below at [B]1.34770 – 1.35557[/B], this could be a possible area sellers will trade price to before buyers take over, which is at the time of writing, about 50 points below where price is currently trading at now.


Price still remains trading between supply at [B]1.36687 – 1.36542[/B] and demand at [B]1.35623 – 1.35984[/B] on the 4hr timeframe. The NFP announcement due later today is well known for its volatile price swings; therefore, with this additional strength, a positive break is likely to be seen.

Pro money will likely sell, and sell hard, hammering price deep into 4hr demand at [B]1.35623 – 1.35984[/B]possibly even spiking below, as we know from the analysis above, higher-timeframe demand is just below ([B]levels above[/B]).

[ul]
[li]The buy order set yesterday at [B]1.35774[/B] has been changed because of the NFP announcement, as the last thing we want happening is for price to spike deep into our buy order giving us huge drawdown. A new buy order has been set lower at [B]1.35677 [/B](marked with a red line) to be placed a few pips above the daily demand ([B]levels above[/B]).[/li][li]Sell orders (marked with red lines) remain mostly unchanged from yesterday’s analysis. The first sell order, the lowest of the two, is seen at [B]1.36542[/B] around the base of supply ([B]1.36687 – 1.36542[/B]). If a break above this supply area materializes, this could force price to test supply at[B]1.37235 –1.37005[/B] with sell orders seen below the round number [B]1.37000[/B] at [B]1.36968[/B]. However, assuming that these orders actually get filled, do not hesitate to exit your sell positions at the first sign of trouble as today will show no mercy around NFP time.[/li][/ul]

[ul]
[li][B]Areas to watch for buy orders:[/B] 1.35677 (SL: 1.35460 TP: [1] 1.36432 [2] 1.36968 [3] 1.37419).[/li][li][B]Areas to watch for sell orders[/B]: 1.36542 (SL: 1.36741 TP: 1.36000). Distant orders: 1.36968 (SL: 1.37289 TP: Dependent on future price approach).[/li][li][B]Most likely scenario: [/B]Price will likely spike south into demand at 1.35623 – 1.35984, before seeing the buyers take control, pushing prices north to at least the supply area at 1.36687 – 1.36542.[/li][/ul]

GBP/USD:

[B]4hr TF.
[/B]
The pound, at the time of writing has produced a beautiful looking pin bar to supply at [B]1.68158 – 1.67828[/B]which is capping price to the upside, with demand seen below at the round number [B]1.67000[/B] capping price to the downside.

[ul]
[li]The buy orders seen yesterday (marked with red lines) are to be left unchanged, the highest one of the two at [B]1.66906[/B] below the round number [B]1.67000[/B] along with an order seen around the daily S/R flip level ([B]1.66631[/B]) at [B]1.66680[/B].[/li][li]The sell order (marked with red line) at [B]1.67828[/B] has been filled, and at the time of writing is in a nice profit which will likely hit its target soon. If a break is seen above this supply area at [B]1.68158 – 1.67828[/B], this could force price to test the supply area at [B]1.68822 – 1.68708[/B]. Sell orders could then be set at [B]1.68708[/B].[/li][/ul]

[ul]
[li][B]Areas to watch for buy orders:[/B] 1.66906 (SL: 1.66534 TP: [1] 1.67828 [2] 1.68708). Distant orders: 1.66680 (SL: 1.66534 TP: Dependent on future price approach).[/li][li][B]Areas to watch for sell orders[/B]: (Active) 1.67828 (SL: 1.68216 TP: 1.67000). Distant orders: 1.68708 (SL: 1.68860 TP: Will be decided on future price approach).[/li][li][B]Most likely scenario: [/B]Price will likely see a drop towards the round number [B]1.67000[/B] due to the higher-timeframe indicating a sell off. Be prepared for price to possibly break the round number, trading deeper into the daily S/R flip area at [B]1.66631[/B] for any type of bullish reaction to be seen.[/li][/ul]

AUD/USD:

[B]Daily/4hr TFs
[/B]
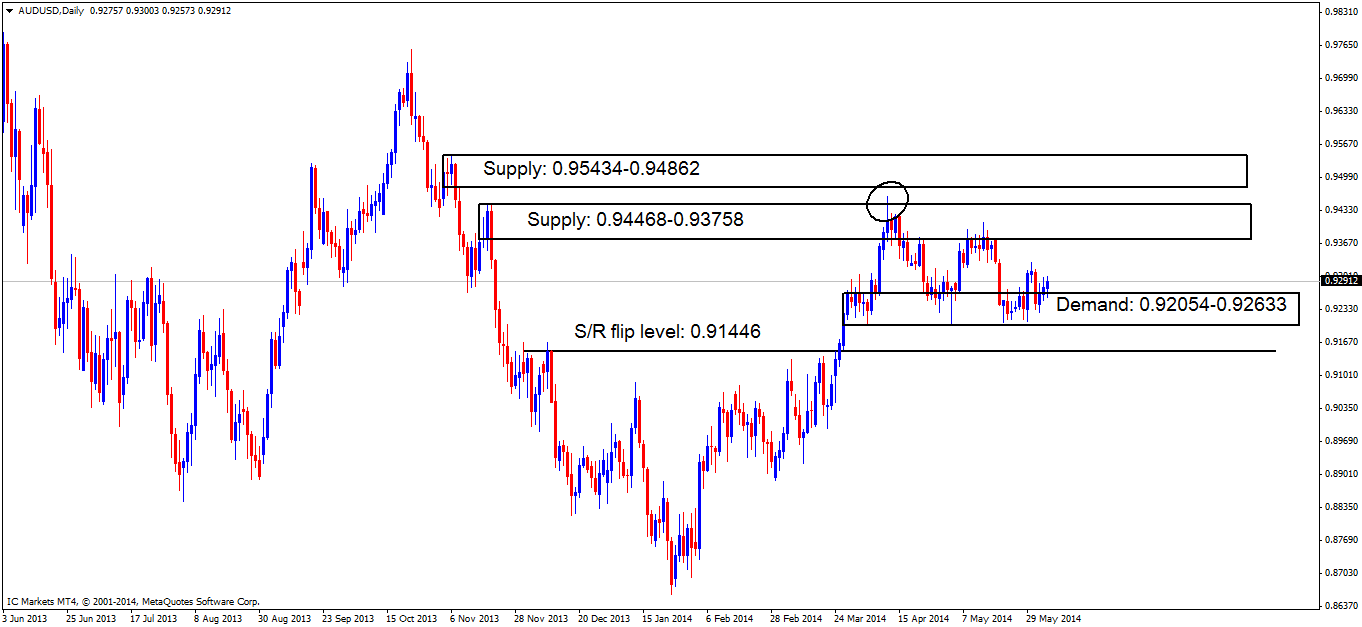
A quick reminder of what the higher timeframe is telling us. Price remains capped within a medium-term consolidation between supply at[B] 0.94468 – 0.93758[/B] and demand below at [B]0.92054 – 0.92633[/B]. The circled wick indicates most of the sellers may have been consumed there, as a result a push higher is likely possible, but also remembering that the weekly time frame is trading around resistance at[B]0.93718[/B], so a fakeout north collecting liquidity may happen to bring prices south as this would agree with the higher-timeframe analysis.


The 4hr timeframe still remains capped with supply being seen above at [B]0.93345 – 0.93186[/B] and demand below at [B]0.92037 – 0.92203[/B]. A second attempt has been seen at the round number [B]0.93000[/B]where a bearish reaction is occurring.

[ul]
[li]Exactly the same as yesterday’s analysis, buy orders (marked with red lines) are still seen at[B]0.92203[/B] around the demand area below ([B]0.92037 – 0.92203[/B]). Due to the amount of touches this demand area has seen over the recent weeks, pro money may decide to push price lower on its next visit, testing the lower limits of the demand area, so buy orders are may also be lurking just above the round number [B]0.92000[/B] at [B]0.92037[/B].[/li][li]The sell order (marked with a red line) set just above the round number [B]0.93000[/B] at [B]0.93027 [/B]nearly filled, missing the entry level by about 2-3 pips, we may still see this order filled, as pro money may want more stops sitting just above the round number ([B]levels above[/B]). Adding to this, take a look at the small trendline placed on the chart, this may be pro money consuming demand whilst rallying price, clearing the path south for an easy sell off. Sell orders (marked with red lines) set at[B]0.93186[/B] around the supply area above ([B]0.93345-0.93186[/B]) remain unchanged.[/li][/ul]

[ul]
[li][B]Areas to watch for buy orders:[/B] 0.92203 (SL: 0.91942 TP: [1] 0.93000 [2] 0.93186) 0.92037 (SL: 0.91942 TP: [1] 0.93000 [2] 0.93186).[/li][li][B]Areas to watch for sell orders[/B]: 0.93027 (SL: 0.93381 TP 0.92203) 0.93186 (SL: 0.93381 TP: [1] 0.93000 [2] Dependent on the way price action approaches this area but will likely be at 0.92203.[/li][li][B]Most likely scenario: [/B]With lower prices expected as per higher-timeframe analysis, price will likely spike higher today, above the round number[B] 0.93000[/B] up to supply at [B]0.93345 – 0.93186[/B] for an overall bigger move south, but also remembering high volatility is expected today with the NFP due out, so keep a close eye on where your pending orders are set, taking into consideration correct stop-loss placements etc…[/li][/ul]

USD/JPY:

[B]Daily4hr TF.
[/B]
Price made a positive close above resistance ([B]102.925[/B]) on the daily timeframe (shown below), opening up the possibility of higher prices up until supply at [B]104.114 – 103.812[/B], coinciding with the weekly timeframe which is seen at support ([B]101.254[/B]).


The 4hr timeframe shows price is seeing support around demand at [B]102.482 – 102.271[/B] capping price to the downside. Supply at [B]103.055 – 102.742[/B] appears to be struggling at the moment with no major selling happening yet

[ul]
[li]Buy orders remain the same (marked with red lines) at [B]102.111[/B] and [B]102.023[/B], incorporated in and around demand at [B]101.936 – 102.089[/B]. Both the daily and the weekly timeframes are showing signs that more buying is to come, however, a retracement (selling) may still happen, with the NFP due out today, price may spike through demand at [B]102.482 – 102.271[/B] to demand below at[B]101.936 – 102.089[/B] possibly filling both pending buy orders.[/li][li]The sell order (marked with a red line) at [B]102.669[/B] is still active with price being held up at immediate demand below at [B]102.482 – 102.271[/B]. This sell order will remain active until either the target below is hit at [B]102.111[/B] (target 2 has been cancelled), or the stop loss order is hit. If a break above this supply area is seen, price will more than likely rally to supply at [B]104.129 – 103.816[/B] with a new sell order (marked with a red line) set just below at [B]103.783[/B].[/li][/ul]

[ul]
[li][B]Areas to watch for buy orders:[/B] 102.111 (SL: 101.899 TP: [At the time of writing] 102.669) 102.023 (SL: 101.899 TP: [At the time of writing] 102.669).[/li][li][B]Areas to watch for sell orders /B 102.669 (SL: 103.088 TP: [At the time of writing] 102.111) 103.783 (SL: 104.159 TP: Dependent on how price approaches the supply area).[/li][li][B]Most likely scenario: [/B]With NFP volatility expected today, price will likely spike through demand at[B]102.482 – 102.271[/B] to demand below at [B]101.936 – 102.089[/B] possibly filling both pending buy orders before rallying higher.[/li][/ul]

EUR/GBP:

[B]Weekly/Daily/4hr TFs.
[/B]
Weekly demand at [B]0.80848 – 0.81668[/B] has, at the time of writing seen a spike south, this may well be a fakeout though, let’s take look down lower for more information.


How can we tell this may be a fakeout? Look on the daily chart below, notice that price came within 5-7 pips of the demand area at [B]0.80348 – 0.80576[/B] which could be a perfect place for pro money to facilitate a fakeout such as this this.


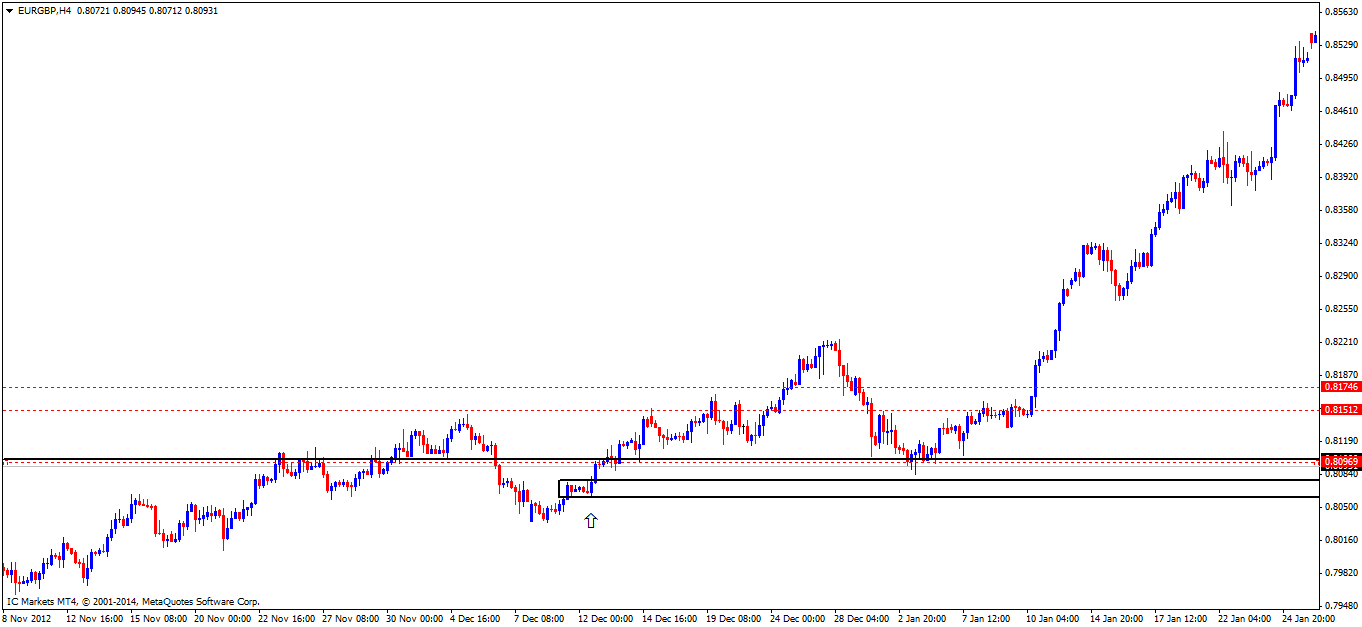
Price has just smashed right through demand at [B]0.81053 – 0.81171[/B] along with the round number[B]0.81000[/B] right into demand seen at [B]0.80777 – 0.80612 [/B]which has remained a fresh zone since the year 2012 as shown on chart 1 below marked with an arrow.

Chart 1:

[ul]
[li]The buy order at [B]0.80988[/B] (marked with a red line) set yesterday has been well and truly stopped out! New buy orders are seen around demand ([B]0.80777 – 0.80612[/B]) at [B]0.80737[/B].[/li][li]What a fantastic trade that would have been if the sell order at [B]0.81512 [/B]had filled! Sell orders (marked with red lines) remain the same as yesterday’s analysis, the lower of the two being seen around supply ([B]0.81580 – 0.81512[/B]) at [B]0.81512[/B], and the next order being seen around the highest of the three stacked supply areas ([B]0.81823 – 0.81766[/B]) at [B]0.81746[/B].[/li][/ul]

[ul]
[li][B]Areas to watch for buy orders:[/B] 0.80737 (SL: 0.80574 TP: [1] 0.81054 [2] 0.81512).[/li][li][B]Areas to watch for sell orders[/B]: 0.81512 (SL: 0.81605 TP: 0.81171). Distant orders: 0.81746 (SL: 0.81845 TP: Will be decided depending on approaching price action)[/li][li][B]Most likely scenario: [/B]Pro money will likely spike back down to demand at 0.80777 – 0.80612 to pick up any unfilled orders left there before rallying higher.[/li][/ul]

USD/CAD:

[B]Daily/4hr TF.
[/B]
The daily timeframe below is not showing any bearish signs in supply at [B]1.10039 – 1.09356[/B].


The price action resembles what the daily timeframe is telling us, only. We’re seeing it in greater detail. Price has been spiking north and south, possibly stopping millions of traders out both ways around the S/R flip level [B]1.09408[/B].

[ul]
[li]Buy orders (marked with red lines) seen below at [B]1.08330[/B] have been cancelled for now since current price is quite a distance from this area. There are still two pending orders set around demand ([B]1.08907 – 1.09022[/B]) at [B]1.09035 [/B]and [B]1.08954[/B] that may be filled sometime later today.[/li][li]The active sell order (marked with a red line) around the S/R flip level [B]0.09408[/B] has been stopped out nearly to the pip! Sell orders are seen above, in and around supply at [B]1.10039 – 1.09875[/B], the nearest being seen just under supply at [B]1.09850[/B], the next seen just above the round number ([B]1.10000[/B]) at [B]1.10020[/B].[/li][/ul]

[ul]
[li][B]Areas to watch for buy orders:[/B] 1.09035 (SL: 1.08886 TP: 1.09408)1.08954 (SL: 1.08886 TP: 1.09408).[/li][li][B]Areas to watch for sell orders[/B]: 1.09850 (SL: 1.10063 TP: 1.09408) 1.10020 (SL: 1.10063 TP: 1.09408).[/li][li][B]Most likely scenario: [/B]Due to recent price action on the higher timeframes, price will likely rally higher up to supply at [B]1.10039 – 1.09875[/B], meaning price will be trading at the extreme upper edge of daily supply at [B]1.10039 – 1.09356[/B] before we see any type drop in price.[/li][/ul]

USD/CHF:

[B]Daily/4hr TFs
[/B]
The daily chart below shows how deep price has spiked within daily supply at [B]0.90381 – 0.89392[/B].


The circled tail mentioned in Wednesday’s analysis reported that this was demand ([B]0.89375 – 0.89459[/B]) consumption, allowing price to trade lower due to the lack of buyers left around this area. Price has spiked the round number [B]0.90000 [/B]and the supply area above at [B]0.90381 – 0.90033[/B] whilst the sellers also made an attempt to touch demand at [B]0, 88973 – 0.89168[/B] missing it by only a few pips.

[ul]
[li]The buy order (marked with a red line) seen below at [B]0.89168 [/B]around the base of demand ([B]0.88973 – 0.89168[/B] nearly got filled yesterday, the order will be left in place as price spiking away from demand like this normally indicates strong demand, so we may yet see a second visit.[/li][li]The sell order at the round number[B] 0.90000 [/B]has been filled, with price just missing its target by about 7 pips or so. The order will remain active until the target is hit, however, it would be wise for anyone trading this move to at least lock in some profit now just to be on the safe side.[/li][/ul]

[ul]
[li][B]Areas to watch for buy orders:[/B] 0.89168 (SL: 0.88942 TP: (Overall) 0.90000, but subject to change depending on price action).[/li][li][B]Areas to watch for sell orders[/B]: (Active) 0.90000 (SL: 0.90398 TP: 0.89168).[/li][li][B]Most likely scenario:[/B] Pro money will likely continue to sell until price at least reaches demand at[B]0.88973 – 0.89168[/B], where a bullish reaction may be seen.[/li][/ul]

XAU/USD (GOLD)

[B]Daily/4hr TFs.
[/B]
The daily timeframe is at last showing some action with price beginning to trade north out of demand at[B]1238.51 – 1254.97[/B].

The 4hr chart still remains capped between supply at [B]1268.03 – 1260.87[/B] and demand at [B]1231.56 – 1237.57[/B] with an attempt to break either area yet to be seen. Chart 1 (below) is a quick reminder of what the price action is like to the left marked with a trend line. This area shows little active demand on this timeframe because buyers have likely already been consumed with all those tails down to small demand pockets before price took off north.

[ul]
[li]The buy order (marked with a red line) at [B]1237.57[/B] still remains unchanged. Patience is definitely required at the moment if considering trading this pair on this timeframe.[/li][li]The sell order (marked with a red line) remains the same being seen around supply ([B]1268.03 – 1260.87[/B]) at [B]1260.87[/B].[/li][/ul]

Chart 2 (below) shows where price is currently trading between supply and demand ([B]levels above[/B])

[ul]
[li][B]Areas to watch for buy orders:[/B] 1237.57 (SL: 1230.48 TP: 1260.87).[/li][li][B]Areas to watch for sell orders[/B]: 1260.87 (SL: 1268.99 TP: 1237.57).[/li][li][B]Most likely scenario: [/B]Price is currently trading in daily demand at [B]1238.51 – 1254.97[/B], so higher prices are naturally expected, the 4hr supply area at [B]1268.03 – 1260.87[/B] will likely see some action today as the NFP announcement will likely give this pair the added strength it requires.[/li][/ul]

[B]For the readers’ benefit:
[/B]
[B]Price action confirmation[/B]: simply means traders will likely wait for price action to confirm a level by consuming the opposing supply or demand area, then entering a trade on a possible retracement, this may occur on the lower timeframes also.

[B]Pending orders:[/B] means pending orders are likely seen.


EUR/USD:

[B]Weekly TF.[/B]
Taking into consideration the last weekly analysis, a weak bullish reaction had been reported. Last week saw the buyers take over; resulting in a beautiful-looking tail being formed in the process. This occurred within demand at 1.34770-1.36771, resulting in higher prices likely being seen this week.

Price is currently still trading between the demand area already mentioned, and supply above at 1.42470-1.38580.

[B]Daily TF.[/B]
Price had reacted beautifully off of demand at 1.34770-1.35557, coming within around 10 pips or so of supply at 1.37342-1.36890, resulting in a positive close above the S/R Flip level at 1.36432.

[B]4hr TF.[/B]
This pair saw fairly volatile price action on Thursday and Friday. A new demand area at 1.35036-1.35312 formed in the process, with price closing for the week below minor resistance at 1.36666.

With major players in Europe (France/Germany/Switzerland) and Australia on holiday today, do not expect much price action to unfold. However, do remain aware that there are a few high-impacting news events due out, mainly in Australia, so do keep an eye on those.

[ul]
[li]Pending buy orders (Green line) are seen at 1.35378 just above demand at 1.35036-1.35312 as there may be unfilled buy orders sitting there. P.A confirmation buy orders (Red line) are visible just below the round number 1.36000 at 1.35924. A pending order is not logical around this level because previous price action indicates there may be limited unfilled orders available here, making a reversal unlikely. Price is more likely to test the lower demand already mentioned at 1.35036-1.35312 for an overall bigger push up as indicated by the higher timeframes.[/li][/ul]

[ul]
[li]Pending sell orders (Green line) are seen at 1.36955 just below supply at 1.37235-1.37005 due to the fact that this level remains untouched, and unfilled orders are likely still around this area. P.A confirmation sell orders (Red line) are seen higher up at 1.37405 just below supply at 1.37749-1.37450. This level requires confirmation because of how close the supply areas (levels above) are together, thus making a logical target area unavailable. Do be on your guard with these orders; the higher-timeframes are indicating higher prices may be seen this week.[/li][/ul]

[ul]
[li][B]Areas to watch for buy orders:[/B] P.O: 1.35378 (SL: 1.34971 TP: [1] 1.36000 [2] 1.36666) P.A.C: 1.35924 (SL: Decided if/when price ‘confirms’ the level T.P: Decided if/when price ‘confirms’ the level).[/li][li][B]Areas to watch for sell orders[/B]: P.O: 1.36955 (SL: 1.37270 TP: [1] 1.36666 [2] 1.36000) P.A.C: 1.37405 (SL: More than likely at 1.37791 TP: Dependent on where price ‘confirms’ the level).[/li][li][B]Most likely scenario: [/B]Due to major players in Europe being on holiday today, price will likely trade between supply above at 1.37235-1.37005 and the round number below at 1.36000.[/li][/ul]

GBP/USD:

[B]Weekly TF.
[/B]
On this timeframe, price seems to be very indecisive. Last week saw price trade within the range of the previous weeks high and low (1.68822-1.66930) making it very difficult to analyze this pair’s next movement.

Price remains trading at the top of the long-term consolidation area at 1.67980 and supply above at 1.76290-1.70490.

[B]Daily TF.[/B]
The low 1.67353 marked with an arrow has seen the majority of buyers consumed by sellers around this area. Near term demand is seen at the S/R flip level below at 1.66631, while near-term supply is seen above at 1.69963-1.69514. There is a small supply area at 1.69210-1.68697 (not marked) which is likely invalid, at least for a touch trade. The wick (circled) has likely consumed a lot of the supply/sellers around this area, making this a very risky trade indeed.


[B]4hr TF.[/B]
Like the Euro, this pair saw quite volatile price action Thursday and Friday, with price closing just below the round number 1.68000 at 1.67992. The minor S/R flip level seen below at 1.67686 is currently capping price to the downside with supply above at 1.68822-1.68708 capping price to the upside.

[ul]
[li]Pending buy orders (Green line) are seen below at 1.65874 just above demand at 1.65518-1.65827. This area shows great potential due to the momentum away from the base indicating unfilled orders may still be in play. The next pending buy order (Green line) is seen just above the round number 1.67000 at 1.67043, this area will likely see a reaction due to the amount of credible touches this level has seen, making it an area to watch out for. Small P.A.confirmation buy orders (Red line) are seen below at 1.67727 just above the minor S/R flip level (1.67686), a pending order set here would be too risky, due to there being no logical area for a stop loss, that is why it is better to wait for price to ‘confirm’ this area beforehand.[/li][li]Pending sell orders (Green line) are visible below supply (1.68822-1.68708) at 1.68673 due to the nice-looking momentum away from this area indicating unfilled order may still be hiding there. P.A confirmation sell orders (Red line) are seen at 1.69696 just below supply at 1.69963-1.69726. The reason this level requires confirmation is due to all those wicks spiking the area as price left the base (circled) warning us sellers may have already been consumed.[/li][/ul]

[ul]
[li][B]Areas to watch for buy orders:[/B] P.O: 1.65874 (SL: 1.65472 TP: Dependent on approaching price action nearer the time) 1.67043 (SL: 1.66527 TP: [1]1.67686 [2] 1.68000 [3] 1.68708) P.A.C: 1.67727 (SL: Decided if/when price ‘confirms’ the level T.P: Decided if/when price ‘confirms’ the level).[/li][li][B]Areas to watch for sell orders[/B]: P.O: 1.68673 (SL: 1.68846 1 TP: [1] 1.68000 [2] 1.67686) P.A.C: 1.69696 (SL: More than likely will be at 1.70030 TP: Dependent on where price ‘confirms’ the level).[/li][li][B]Most likely scenario: [/B]Price will likely trade down to the minor S/R flip level at 1.67686 possibly seeing a reaction, then trading in between the S/R flip level just mentioned and supply above at 1.68822-1.68708 for the remainder of the day.[/li][/ul]

AUD/USD:

[B]Weekly TF.[/B]
The buyers have made yet another attempt at the weekly S/R flip level (0.93718). Last week’s action saw price closing above the previous week’s high (0.93294) at 0.93341, a close above the high is irrelevant in this situation, due to price trading right into resistance (level above). Pro money are likely accumulating a position with this ranging action, but the big question is, where are they planning to take price to after they’ve finished accumulating their positions?


[B]Daily TF.[/B]
Price remains capped within a medium-term consolidation between supply at 0.94468 – 0.93758 and demand below at 0.92054 – 0.92633. The circled wick indicates most of the sellers may have been consumed there, as a result a push higher is likely possible on this timeframe, but also remembering that the weekly time frame is trading around resistance at 0.93718, a fakeout north to collect liquidity may happen on the daily timeframe to bring prices south, as higher timeframes normally overrule lower timeframes.

[B]4hr TF.[/B]
Price is presently trading in between the D/S flip area at 0.93186-0.93345 and supply above at 0.93729-0.93572. Retail buy and sell orders are seen between these two areas just mentioned, so our orders should not be set there.

A break above supply (levels above) could force price to test the supply area above at 0.94253-0.94040, as most of the supply between this area is likely consumed due to the wick in between (circled), allowing price to rally without meeting too many sellers. A break below demand (levels above) could see price testing the round number 0.93000.

[ul]
[li]At the time of writing there are no pending buy orders available due to current price action. P.A confirmation buy orders (Red line) are seen at 0.92231 just above demand at 0.92037-0.92203. It would be too risky to set a pending order here, since there have been some very deep spikes into this demand area (levels above), meaning there could be few buyers left here, so, it’s better to wait for confirmation. The next batch of P.A confirmation buy orders (Red line) are visible just above the round number 0.93000 at 0.93025, as previous price action has shown that this area is a magnet for deep tests (spikes); we want to avoid this happening to us by waiting for confirmation.[/li][li]Pending sell orders (Green line) are seen just below supply (0.94253-0.94040) at 0.94021. This supply area, although not fresh, has only seen a small test to the lower base meaning there are likely active sellers lurking within, permitting pending orders to be set.[/li][/ul]

[ul]
[li][B]Areas to watch for buy orders:[/B] P.O: No pending orders are seen with current price action. P.A.C: 0.92231 (SL: more than likely will be at 0.91984 TP: Decided if/when price ‘confirms’ the level) 0.93025 (SL: Dependent on where price ‘confirms’ the level TP: Dependent on where price ‘confirms’ the level)[/li][li][B]Areas to watch for sell orders[/B]: P.O: 0.94021 (SL: 0.94277 TP: [1] 0.93729 [2] 0.93345 [3] 0.93000) P.A.C: No P.A confirmation orders seen with current price action.[/li][li][B]Most likely scenario: [/B]It is unlikely price will see much action today. Price will likely trade within where price is currently capped (Supply: 0.93729-0.93572 Demand: 0.93186-0.93345). If in the unlikely event price does break above supply, look for sellers to come into the market around the upper supply area at 0.94253-0.94040, conversely, a break below demand could see buyers coming into the market around the round number 0.93000.[/li][/ul]

USD/JPY:

[B]Weekly TF.[/B]
This pair had an exciting week. The weekly candle recently closed showed that the buyers were in control for the majority of the trading week. Friday’s close was seen at 102.503, subsequently seeing price close above the previous monthly high at 102.365.

Price still remains capped between supply above at 105.441-104.075 and demand below (S/R flip level) at 101.254.

[B]Daily TF.[/B]
Price made a positive close above resistance (102.645) on the daily timeframe (shown below), opening up the possibility of higher prices up to supply at 104.114 – 103.812, coinciding with the weekly timeframe which has been seen reacting off of support at 101.254.

[B]4hr TF.[/B]
Price is currently capped between supply at 103.055-102.742 and demand (S/R flip level) at 102.117. A break above this supply could see price testing supply at 104.129-103.816; conversely, a break below the S/R flip level (demand) could see price testing demand at 101.427-101.660.

[ul]
[li]Pending buy orders (Green line) are seen just above demand (101.427-101.660) at 101.679, as this demand remains fresh and likely still hold unfilled orders. P.A confirmation orders (Red line) are seen at 102.141 just above the S/R flip level (102.117). This area may well hold, but there is always the chance of a deep spike to the round number 102.000 below, which could stop us out, so the best bet is to wait for added confirmation.[/li][li]Pending sell orders (Green line) are visible at 102.980, deep within supply (103.055-102.742), and just below the round number 103.000. The supply area may well be weak now, but the way price reacted at the circled area indicates pro money activity, meaning sell orders may be left unfilled there.[/li][/ul]

[ul]
[li][B]Areas to watch for buy orders:[/B] P.O:101.679 (SL: 101.404 TP: [1] 102.000 [2] 102.742) P.A.C: 102.141 (SL: Likely to be set at 101.925 TP: Decided if/when price ‘confirms’ the level).[/li][li][B]Areas to watch for sell orders[/B]: P.O: 102.980 (SL: 103.108 TP: 102.117, but may well change if the market sees any developments). P.A.C: No P.A confirmation orders seen with current price action.[/li][li][B]Most likely scenario: [/B]Price will likely trade within where it is currently capped (Supply: 103.055-102.742 Demand: 102.117) bearing in mind major players in Europe and Australia are on holiday today.[/li][/ul]

EUR/GBP:

[B]Weekly TF.[/B]
A deeper spike below demand at 0.80848-0.81668 has been seen, no doubt this move stopped out a lot of buyers in the process. If most of the buyers have been consumed here, this means the path is clear to the next demand area below seen at 0.79596-0.80299, however price may still retrace all the way back up to supply at 0.84000-0.83286 before the lower demand area is visited.

At the time of writing, price still remains capped between demand at 0.80848-0.81668 and supply at 0.84000-0.83286.

[B]Daily TF.[/B]
The daily timeframe shows how the tail seen on the weekly may well be just a fakeout south to gather liquidity. Look at the circled tail, notice how close price came to touching demand seen at 0.80348-0.80576, this area could be what pro money was using to facilitate a fakeout unknown to any long-term traders just following the weekly timeframe and above.

Price is now capped between supply (S/R Flip level) at 0.81430 and demand below at 0.80348-0.80576.

[B]4hr TF.[/B]
Price reacted beautifully off of demand at 0.80612-0.80777, no doubt leaving buy orders unfilled around that area. Buyers then smashed through the round number 0.81000, and then retested it on Friday with the market closing be at 0.81195.

[ul]
[li]Pending buy orders (Green line) are seen at 0.80543 just above demand at 0.80348-0.80511 as this will be the likely level pro money pushes price down to if they want to collect more liquidity for a bigger push up. P.A confirmation orders (Red line) are seen at 0.80741 sitting within demand at 0.80612-0.80777, there will likely be orders left unfilled here, but with a great-looking demand area (levels above) lurking just below, it becomes a too risky for a pending order as price could very easily fake this demand area to the one below. The last P.A confirmation buy order is above the round number 0.81000 at 0.81017, this area will likely see a deep spike through it and no logical area for a stop loss order, hence the need for a more confirmed entry.[/li][li]Pending sell orders (Green line) are spotted just under fresh supply (0.81751-0.81627) at 0.81612 due to the area being fresh giving the impression orders may still remain unfilled there. P.A confirmation orders (Red line) under the S/R flip level 0.81403 at 081393 is an area where a reaction is likely, however there were too many wicks north seen marked with arrows, indicating sellers are drying up, thus, the need to wait for more confirmation.[/li][/ul]

[ul]
[li][B]Areas to watch for buy orders:[/B] P.O:0.80543 (SL: 0.80328 TP: [1] 0.81000 [2] 0.81403) P.A.C: 0.80741 (SL: Likely to be set at 0.80586 TP: Decided if/when price ‘confirms’ the level) 0.81017 (SL: Decided if/when price ‘confirms’ the level TP: Decided if/when price ‘confirms’ the level).[/li][li][B]Areas to watch for sell orders[/B]: P.O: 0.81612 (SL: 0.81784 TP: [1] 0.81403 [2] 0.81000) P.A.C: 0.81393 (SL: Will be likely set at 0.81564 TP: Will be likely set at the round number 0.81000).[/li][li][B]Most likely scenario: [/B]Price will likely trade in between the round number 0.81000 and the S/R flip level 0.81403 during the lower-volume sessions, a break may be seen once London opens up, but, do keep in mind two major players are on holiday in Europe today (France and Germany).[/li][/ul]