Daily Market Analysis by IC Markets

GBP/USD:

[B]4hr TF.[/B]
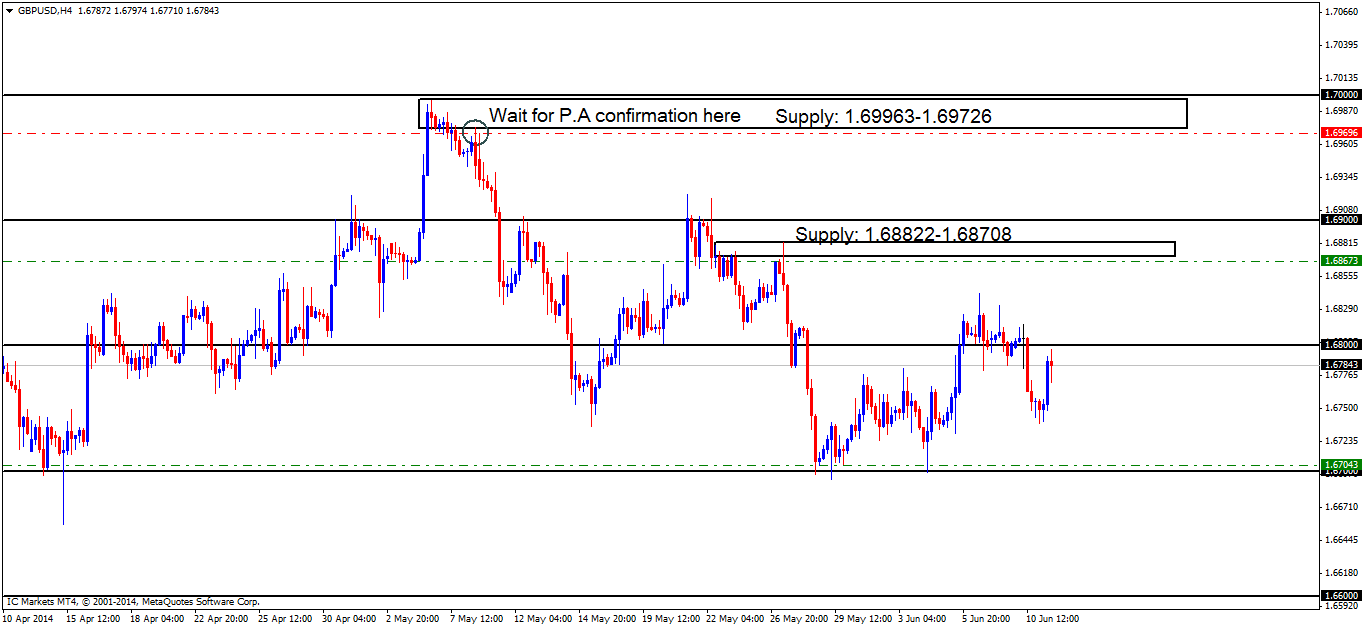
A sharp drop through the minor S/R flip level at 1.67686 has been seen, stopping out any buyers trying to trade long there as seen on [B]chart 1[/B].Price is now currently capped between supply at 1.68000 and demand below at 1.67000 as seen on [B]chart 2
[/B]

[ul]
[li][B]Pending buy orders[/B] (Green line) are seen below (1.65874) just above demand at 1.65518-1.65827. This area shows great potential as the momentum away from the base indicates unfilled orders may still be in play.[/li][li][B]The next set of pending buy orders[/B] (Green line) are seen just above the round number 1.67000 at 1.67043, this area will likely see a reaction due to the amount of credible touches this level has seen, making it an area to watch out for.[/li][li][B]Small P.A confirmation buy orders[/B] (Red line) that were visible at 1.67727 just above the minor S/R flip level (1.67686) have now been cancelled. Price dropped too far from the entry level and was unable to consume the high 1.68419 marked with an x, deeming this level to be invalid.[/li][li][B]Pending sell orders[/B] (Green line) are visible below supply (1.68822-1.68708) at 1.68673 due to strong momentum away from this area, indicating unfilled orders may still be hiding there.[/li][li][B]P.A confirmation sell orders[/B] (Red line) are seen at 1.69696 just below supply at 1.69963-1.69726. The reason this level requires confirmation is due to the wicks spiking the area as price left the base (circled) warning us sellers may have already been consumed.[/li][/ul]
Chart 1:
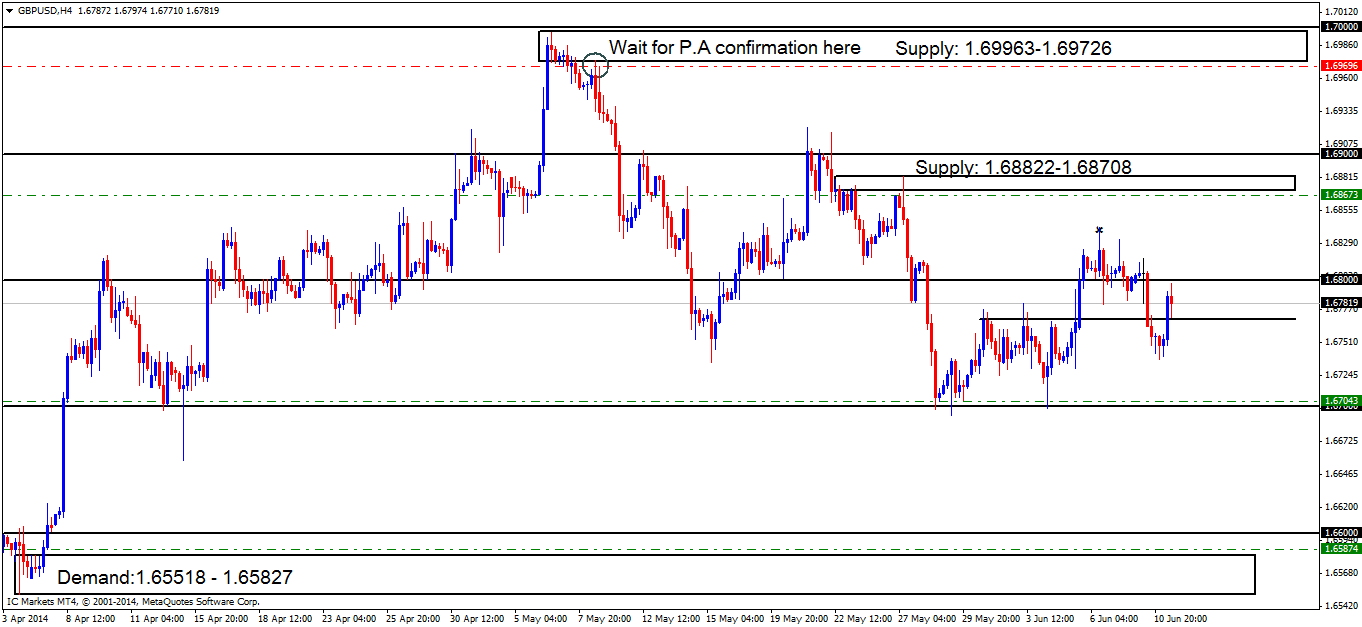
Chart 2:
[ul]
[li][B]Areas to watch for buy orders:[/B] P.O: 1.65874 (SL: 1.65472 TP: Dependent on approaching price action nearer the time) 1.67043 (SL: 1.66527 TP: [1] 1.68000 [3] 1.68708). P.A.C: No P.A confirmation buy orders are seen in the current market environment.[/li][li][B]Areas to watch for sell orders[/B]: P.O: 1.68673 (SL: 1.68846 1 TP: 1.68000 but may be subject to change). P.A.C: 1.69696 (SL: More than likely will be at 1.70030 TP: Dependent on where price ‘confirms’ the level).[/li][li][B]Most likely scenario: [/B]This pair is becoming increasingly difficult to give an accurate analysis on. Price is currently seen trading between the round number 1.68000 above and the round number 1.67000 below. Depending on what develops in the next few trading sessions, price will likely test the round number 1.67000 before completely consuming sellers at the round number 1.68000.[/li][/ul]
AUD/USD:

[B]Weekly TF.[/B]
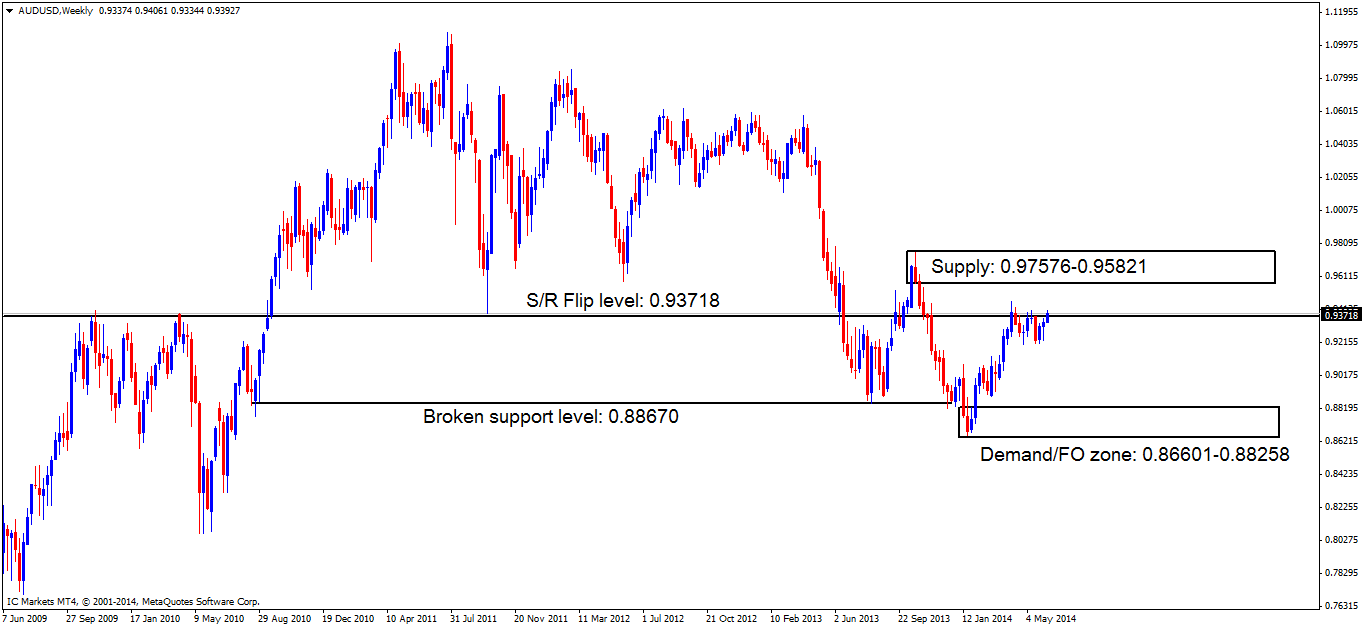
Price is currently seen trading at a long-term S/R flip level (0.93718).


[B]Daily TF.[/B]
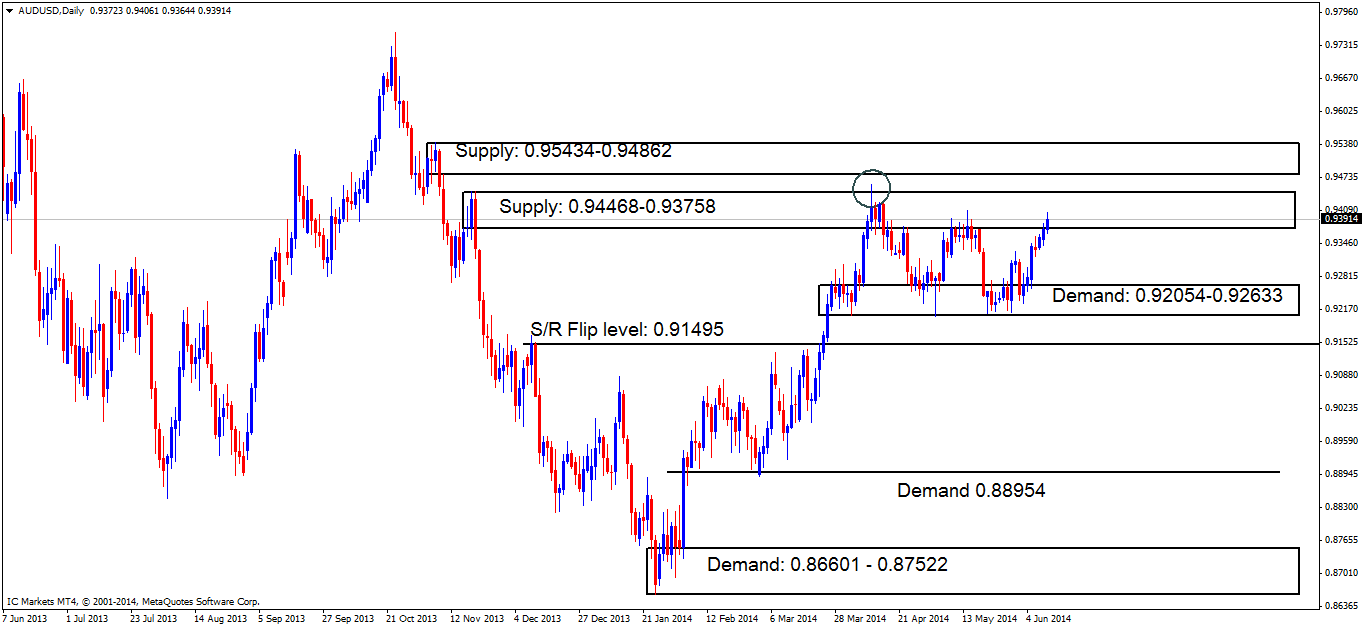
The daily timeframe is currently trading within a weak-looking supply area at 0.94468-0.93758. The reason it [I]may[/I] be weak is due to the circled area to the left containing a spike/wick that may have consumed sellers, thus weakening the selling pressure around this zone.


[B]4hr TF.
[/B]
Yesterday’s analysis saw conflicting signals:
[I]‘Price action on this timeframe seems to have conflicting signals. The mini trend line shown on the 4hr chart below indicates that pro money are likely consuming lower timeframe demand pockets while still rallying price i.e. clearing the path south for their sell orders.[/I]
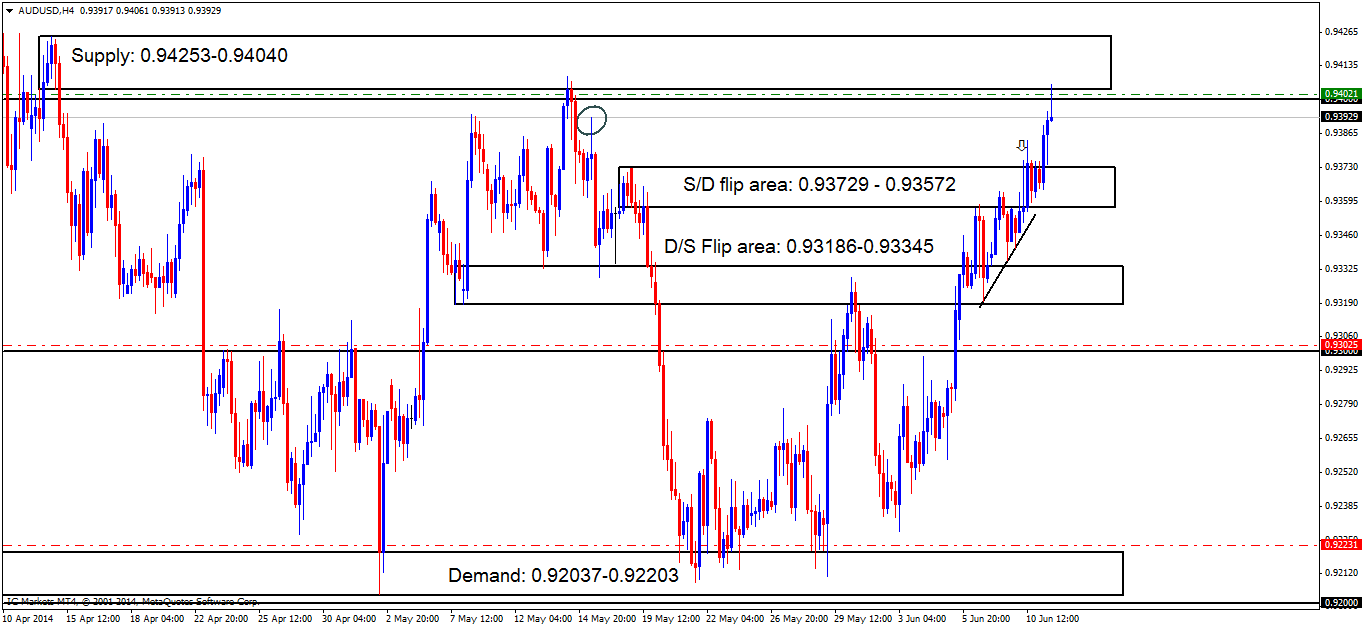
[I]On the other hand, a wick/spike (marked with an arrow) has been seen above supply at 0.93729-0.93572 giving a signal that price may want to visit the upper supply at 0.94253-0.94040 since sellers in this area may have been consumed leaving the path clear for buyers.’[/I]
We know now that the wick/spike did in fact consume sellers, clearing the path up to supply at 0.94253-0.94040, where a bearish reaction is currently being seen.

[ul]
[li][B]No pending buy orders [/B]are seen in the current market environment.[/li][li][B]P.A confirmation buy orders[/B] (Red line) are seen at 0.92231 just above demand at 0.92037-0.92203. It would be too risky to set a pending order around this area, since deep spikes into this demand zone have been seen (levels above) possibly consuming the majority of buyers in the process.[/li][li][B]The next set of P.A confirmation buy orders[/B] (Red line) are visible just above the round number 0.93000 at 0.93025. We require confirmation of this level because previous price action has warned us deep tests both north and south happen on a regular basis, hence the need to wait for confirmation rather than getting stopped out time after time through lack of patience.[/li][li][B]The pending sell order[/B] (Green line) set just below supply (0.94253-0.94040) at 0.94021 is now active so keep a close eye on the first target area (reported below).[/li][li][B]No P.A confirmation sell orders [/B]are seen in the current market environment.[/li][/ul]

[ul]
[li][B]Areas to watch for buy orders:[/B] P.O: No pending orders are seen with current price action. P.A.C:0.92231 (SL: more than likely will be at 0.91984 TP: Decided if/when price ‘confirms’ the level) 0.93025 (SL: Dependent on where price ‘confirms’ the level TP: Dependent on where price ‘confirms’ the level)[/li][li][B]Areas to watch for sell orders[/B]: P.O: (Active) 0.94021 (SL: 0.94277 TP: [1] 0.93729 [2] 0.93345 [3] 0.93000) P.A.C: No P.A confirmation sell orders seen in the current market environment.[/li][li][B]Most likely scenario: [/B]Price will likely see a drop from supply at 0.94253-0.94040 towards the S/D flip area at 0.93729-0.93572.[/li][/ul]

USD/JPY:

[B]Daily TF.[/B]
Minor resistance at 102.645 is proving to be a valid area, as sellers are seen taking advantage of the available liquidity there.


[B]4hr TF.[/B]
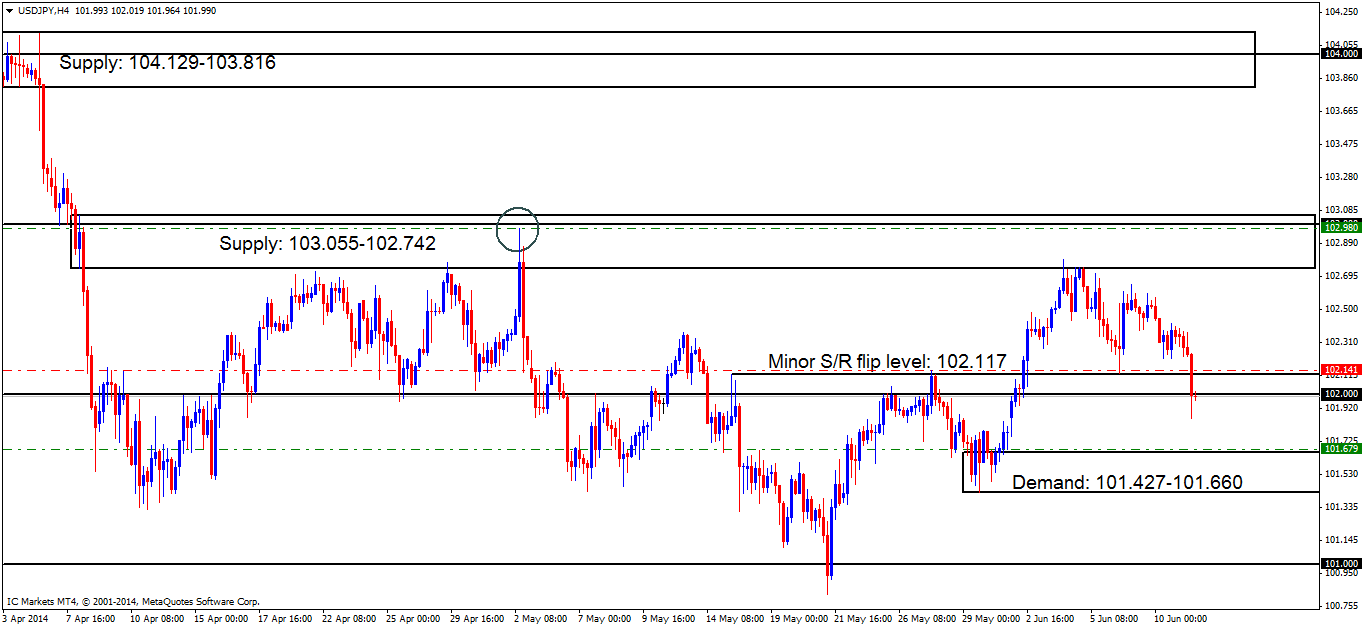
This is the reason we set confirmation orders on levels we are unsure of! The break of minor S/R flip level (102.117) was very likely the work of pro money (chart 1), not many retail traders have an account size to move the market like this.

With buyers at the minor S/R flip level (level above) consumed, a further push lower may be seen towards demand at 101.427-101.660 where we have a pending buy order set at 101.679.

[ul]
[li][B]Pending buy orders[/B] (Green line) are seen just above demand (101.427-101.660) at 101.679, as this demand remains fresh and likely still holds unfilled orders.[/li][li][B]The P.A confirmation buy order[/B] (Red line) set at 102.141 has been cancelled. Price dropped too far from the entry level with one swift blow south, deeming this level to be invalid.[/li][li][B]Pending sell orders[/B] (Green line) are visible at 102.980, deep within supply (103.055-102.742), this area may well appear be weak now, but the way price reacted at the circled area indicates pro money activity, meaning sell orders may be left unfilled there, so a pending order is permitted.[/li][li][B]No P.A confirmation sell orders[/B] are seen in the current market environment.[/li][/ul]

Chart 1:

Chart 2:

[ul]
[li][B]Areas to watch for buy orders:[/B] P.O:101.679 (SL: 101.404 TP: [1] 102.000 [2] 102.742 but may be subject to change) P.A.C: No P.A confirmation buy orders seen in the current market environment.[/li][li][B]Areas to watch for sell orders[/B]: P.O: 102.980 (SL: 103.108 TP: 102.117, but may well change if the market sees any developments). P.A.C: No P.A confirmation sell orders seen in the current market environment.[/li][li][B]Most likely scenario: [/B]Price will likely see a decline in value towards demand at 101.427-101.660. However, before this drop in price is seen, a small rally is not out of the question up to at least the minor S/R flip level at 102.117.[/li][/ul]

EUR/GBP:

[B]4hr TF.[/B]
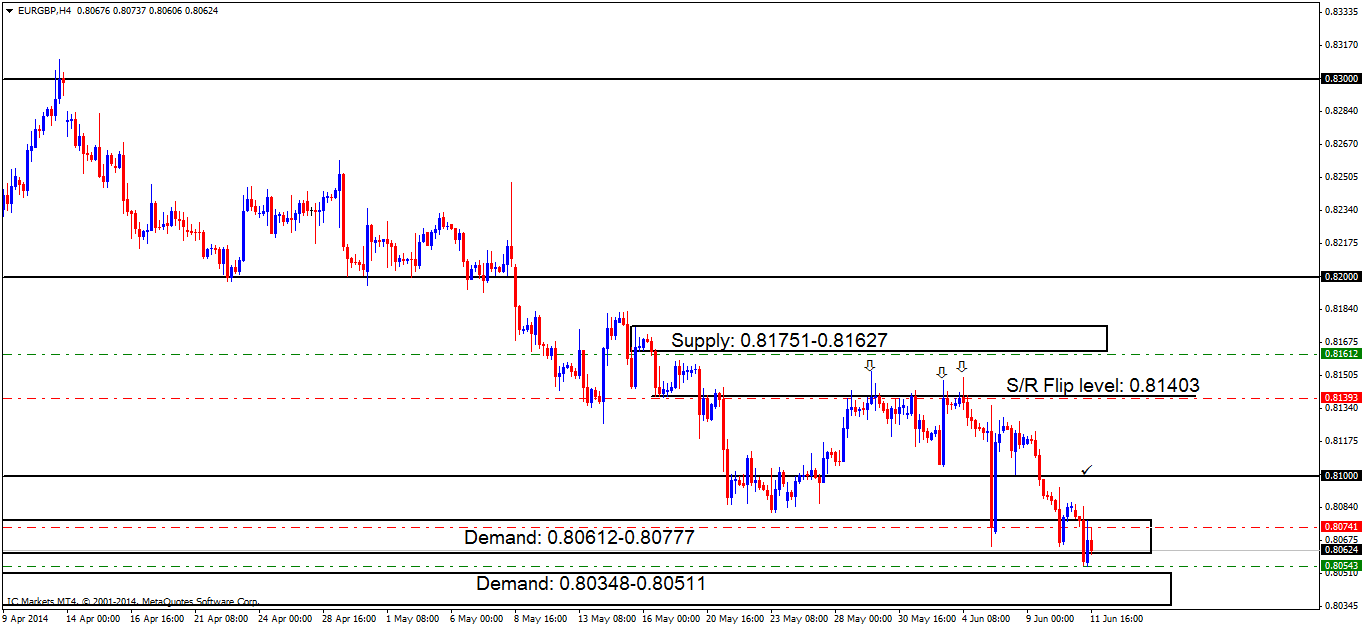
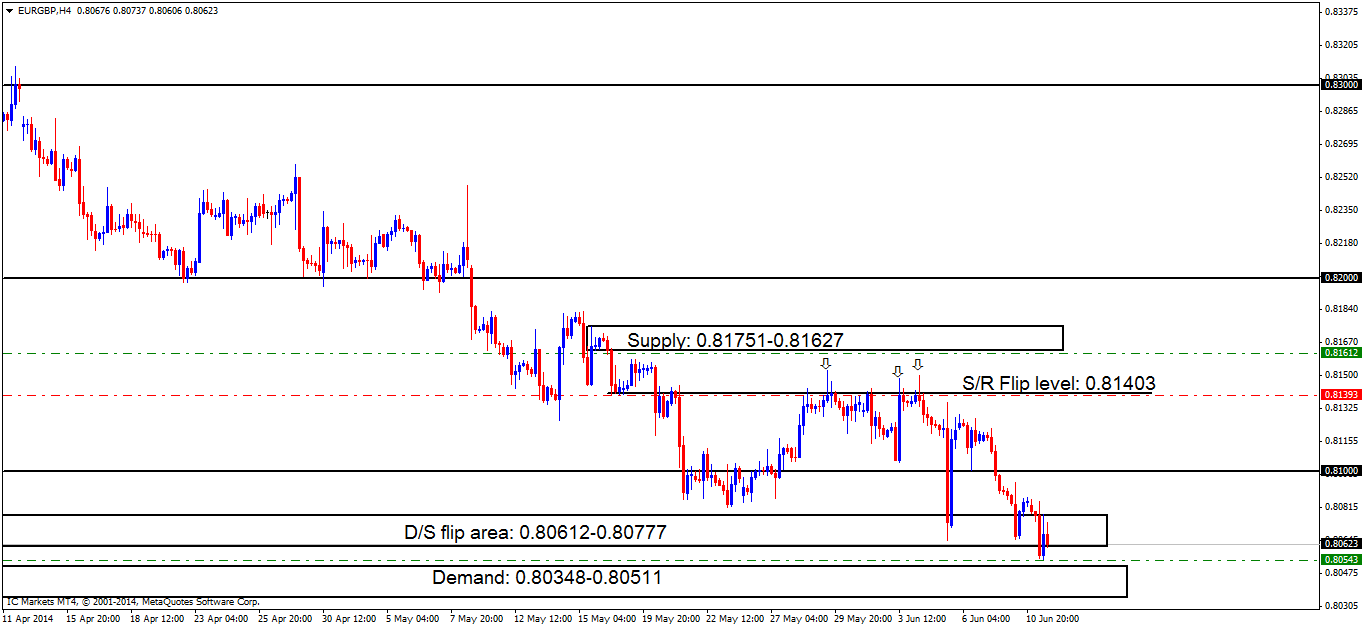
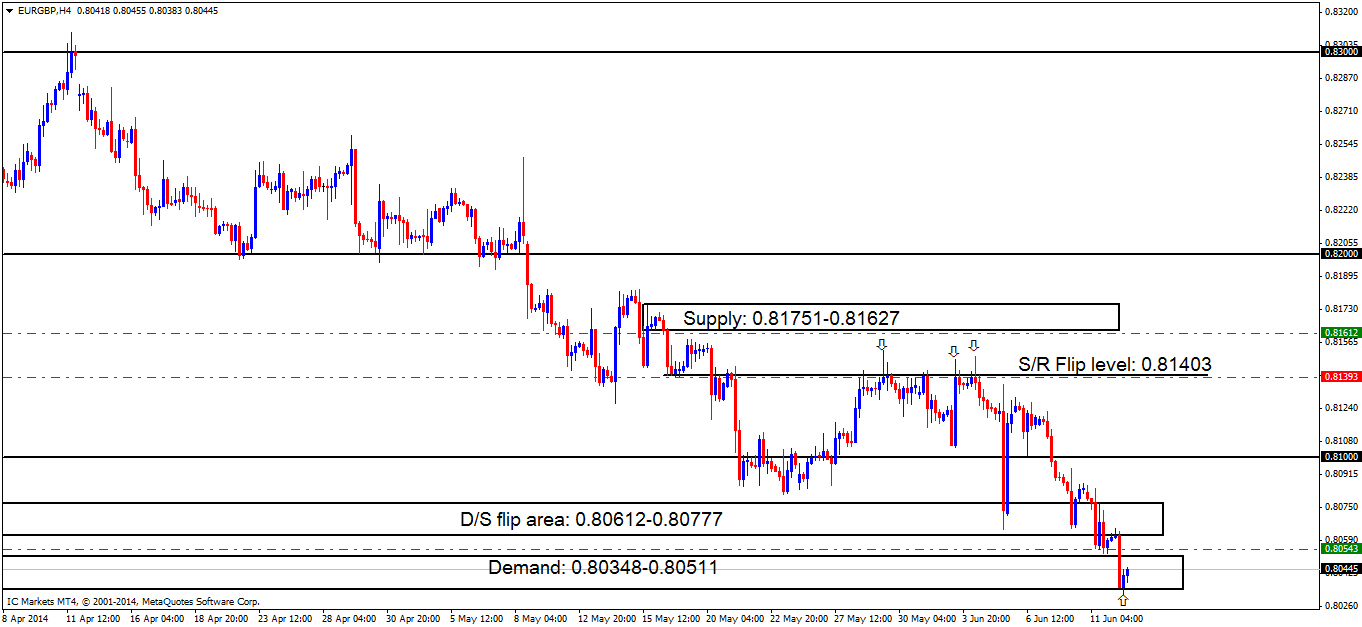
Price seems to have faked demand (0.80612-0.80777) into the demand area below at 0.80348-0.80511 as reported it may do in the last analysis ([B]chart 1[/B]).

Buyers have shown a little interest here, but at the time of writing, they seem to be hitting quite strong resistance around the 0.80741 area. Price is now capped between demand at 0.80348-0.80511 and supply above at (D/S flip area) 0.80612-0.80777 ([B]chart 2[/B]).

[ul]
[li][B]The pending buy order[/B] (Green line) set at 0.80543 just above demand (0.80348-0.80511) would have recently been filled, if it was not for the spread on this pair.[/li][li][B]The P.A confirmation buy order[/B] (Red line) set at 0.80741 sitting within demand at 0.80612-0.80777 has now been cancelled, Price dropped too far from the entry level and was unable to consume sellers at the round number 0.81000 marked with an check sign ([B]chart 1[/B]), deeming this level to be invalid.[/li][li][B]Pending sell orders[/B] (Green line) are spotted just under fresh supply (0.81751-0.81627) at 0.81612 due to the area being fresh giving the impression orders may still remain unfilled there.[/li][li][B]P.A confirmation sell orders[/B] (Red line) under the S/R flip level 0.81403 at 081393 is an area where a reaction is likely, however there were too many wicks north seen marked with arrows, indicating sellers are drying up, thus, the need to wait for more confirmation.[/li][/ul]

Chart 1

Chart 2:

[ul]
[li][B]Areas to watch for buy orders:[/B] P.O:0.80543 (SL: 0.80328 TP: [1] 0.81000 [2] 0.81403) P.A.C: No P.A confirmation buy orders seen in the current market environment.[/li][li][B]Areas to watch for sell orders[/B]: P.O: 0.81612 (SL: 0.81784 TP: [1] 0.81403 [2] 0.81000) P.A.C:0.81393 (SL: Will be likely set at 0.81564 TP: Will be likely set at the round number 0.81000).[/li][li][B]Most likely scenario: [/B] Price will likely trade within where price is currently capped (Supply: 0.80612-0.80777 Demand: 0.80348-0.80511) during the lower-volume sessions. Once volatility picks up, a rally higher may be seen towards the round number 0.81000.[/li][/ul]
USD/CAD:

[B]Daily TF.[/B]
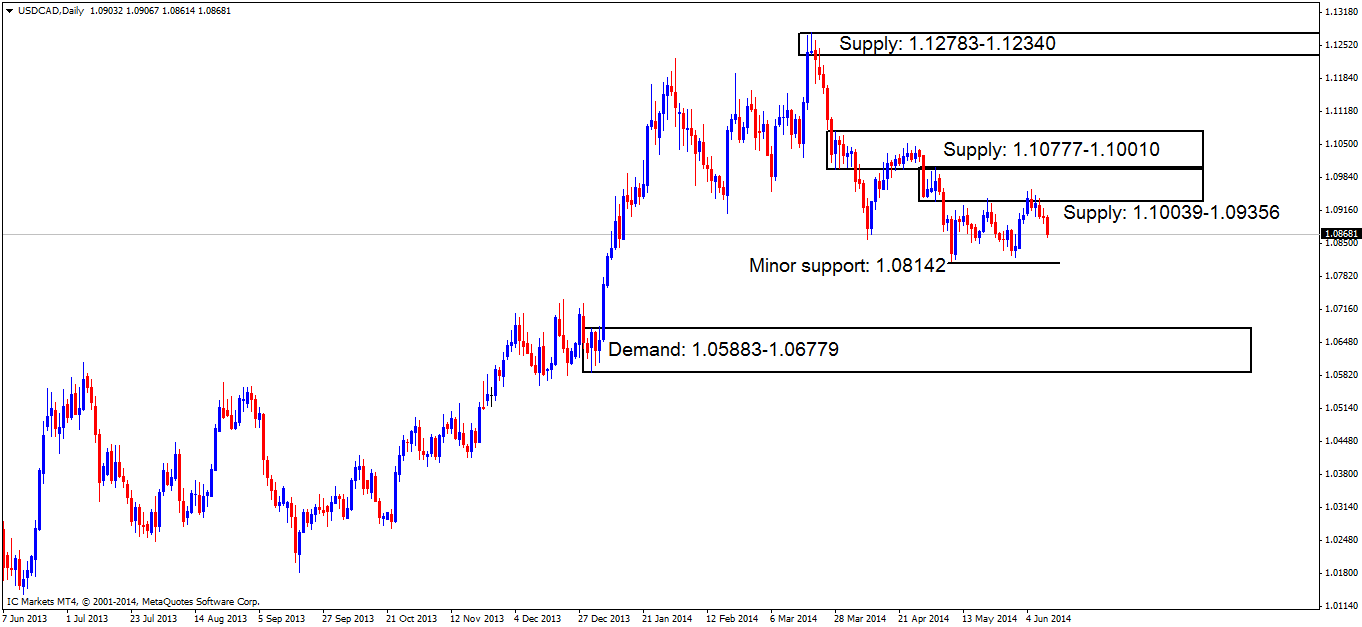
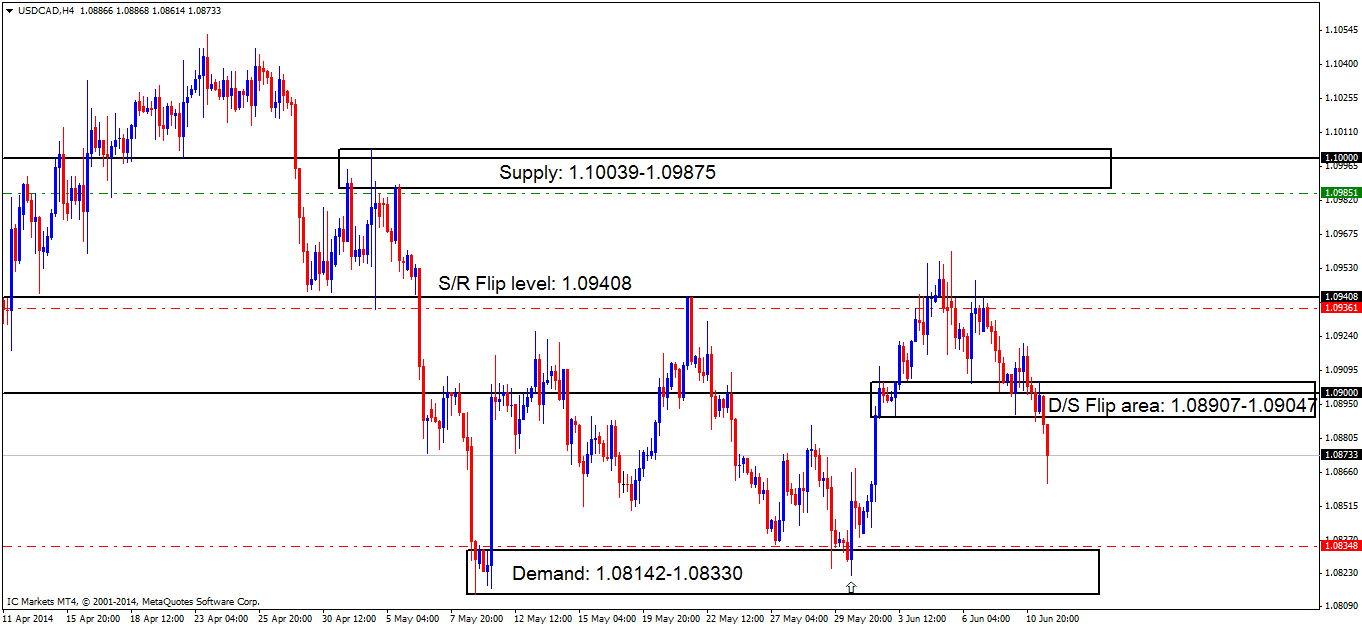
The daily timeframe still shows price capped between supply at 1.10039-1.09356 and demand below at 1.08142 with sellers seen taking full advantage of the available liquidity around supply.


[B]4hr TF.[/B]
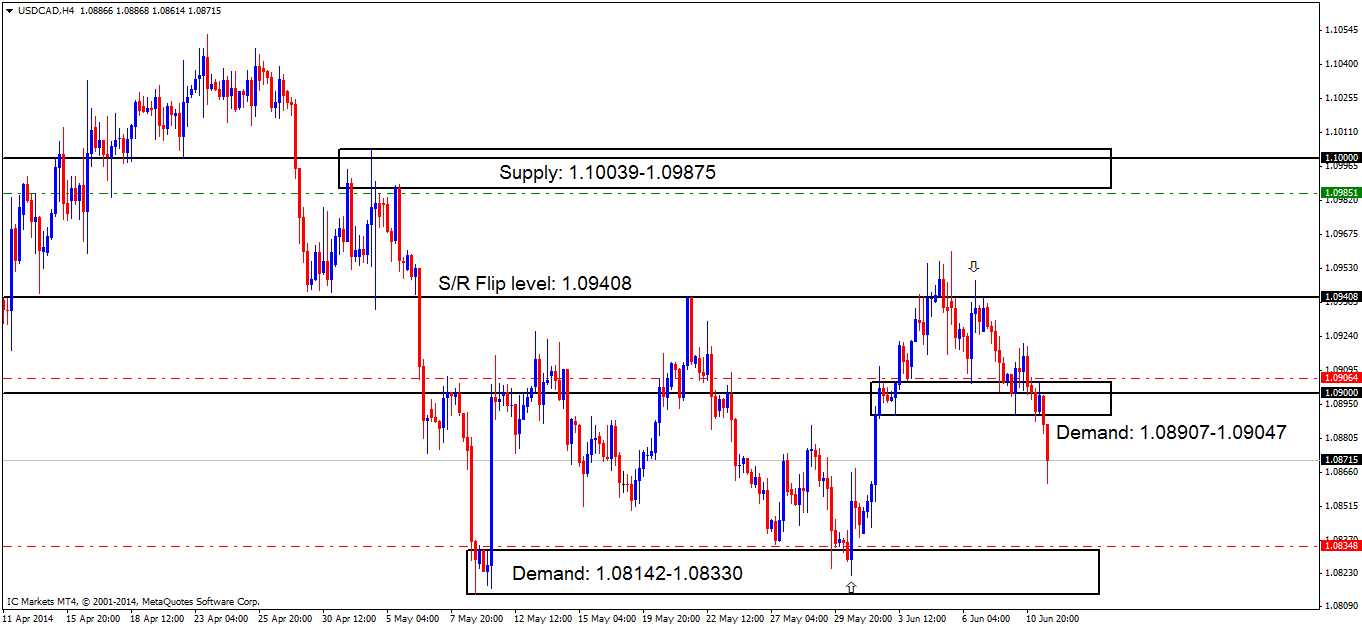
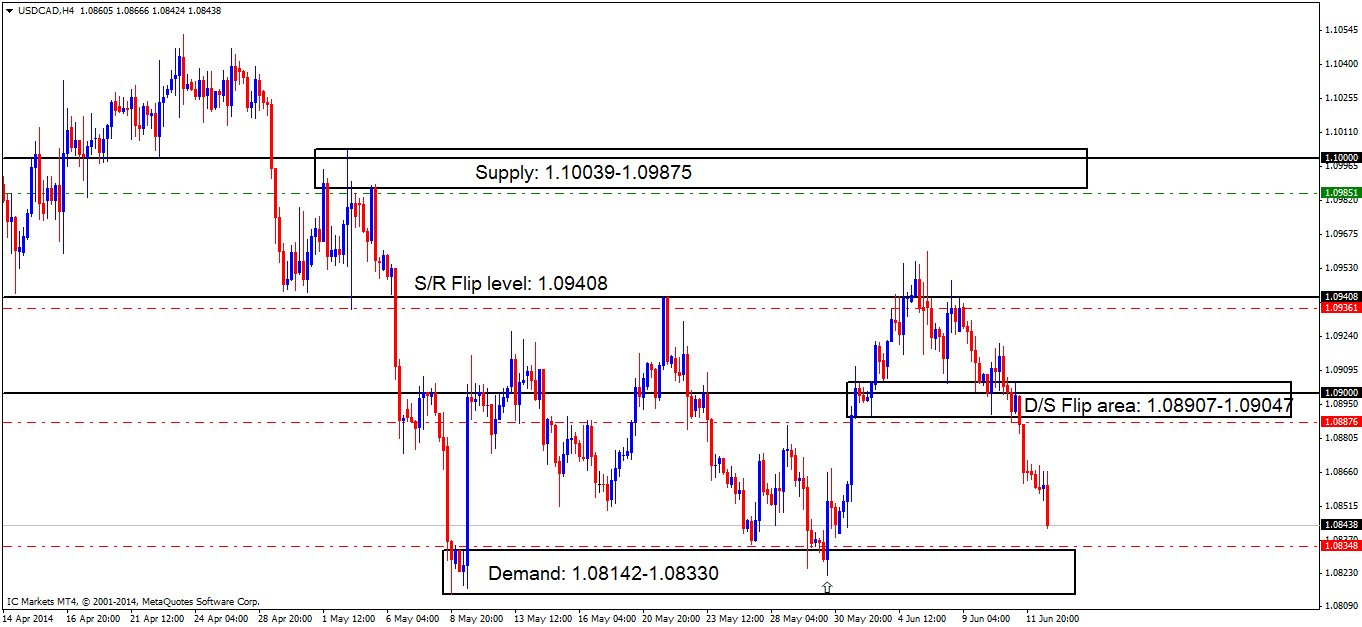
Price has well and truly consumed demand at 1.08907-1.09047, no doubt stopping out all buyers in and around this area along with cancelling out our P.A confirmation order at 1.09064 (chart 1).

With a break seen of demand (levels above), the next area of interest is seen below at (demand) 1.08142-1.08330 which is currently capping price to the downside, with supply (D/S flip area) at 1.08907-1.09047 capping price to the upside (chart 2).

[ul]
[li][B]At the time of writing there are no pending buy orders seen[/B].[/li][li][B]P.A confirmation buy orders[/B] (Red line) seen just above demand (1.08142-1.08330) at 1.08348. There may be orders left unfilled here, however, a pending order is not wise due to how deep price penetrated the level before (marked with an arrow).[/li][li][B]The near-term P.A confirmation buy order[/B] at 1.09064 just above demand at 1.08907-1.09047 has been cancelled. Price dropped too far from the entry level, and was unable to consume sellers at the high 1.09480 marked with an arrow [B](chart 1[/B]), deeming this level to be invalid.[/li][li][B]Pending sell orders[/B] (Green line) just below supply (1.10039-1.09875) at 1.09851 will very likely see a nice reaction. However, we should remain aware of the big figure number 1.10000 lurking within the top half of the supply area (levels above), so a bigger stop may be necessary![/li][li][B]New P.A confirmation sell orders (chart 2) [/B]are seen just below the S/R flip level (1.09408) at 1.09361. A P.A.C order was selected here because of the deep wicks seen in and around this area, possibly indicating sellers have been consumed, thus weakening the level on return.[/li][/ul]

Chart 1:

Chart 2:

[ul]
[li][B]Areas to watch for buy orders:[/B] P.O: There are no pending buy orders seen in the current market environment. P.A.C: 1.08348 (SL: Likely to be set at 1.08127 TP: Decided if/when price ‘confirms’ the level).[/li][li][B]Areas to watch for sell orders[/B]: P.O: 1.09851 (SL: 1.10114 TP: [1] 1.09408 [2] 1.09047) P.A.C:1.09361 (SL likely to be set at 1.09513 TP Decided if/when price ‘confirms’ the level).[/li][li][B]Most likely scenario: [/B]Price will likely continue declining until the buyers outweigh the sellers which will likely be around the demand area at 1.08142-1.08330. Do not expect price to keep dropping in a straight line, there will be small retracements in between no doubt from traders locking in profits.[/li][/ul]

USD/CHF:

[B]4hr TF.
[/B]
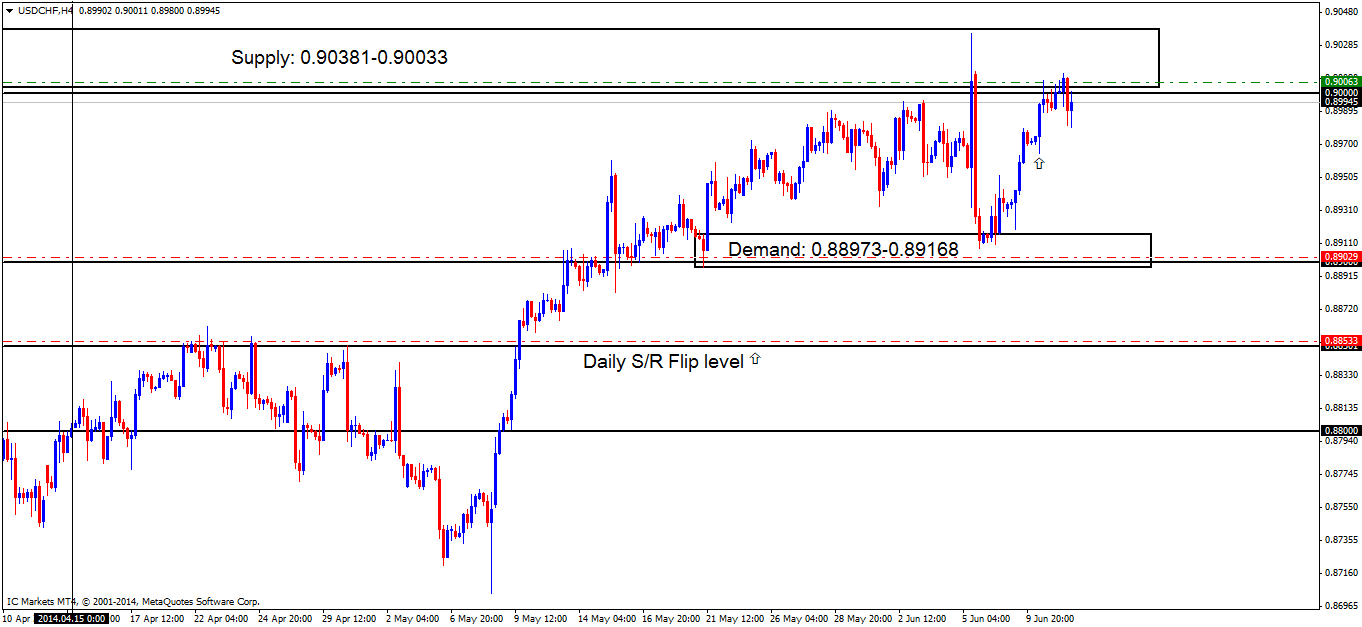
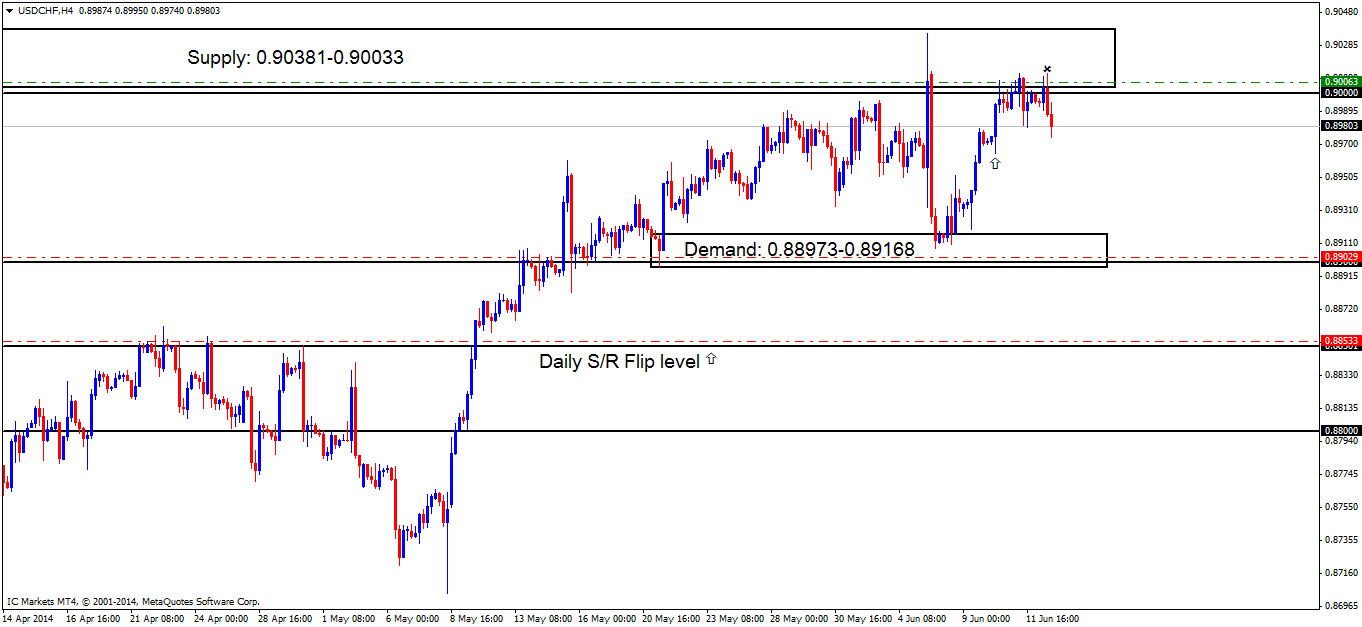
At the time of writing, price still remains capped between supply at 0.90381-0.90033 and demand below at 0.88973-0.89168.

Sellers are beginning to show some sign of life around supply at 0.90381-0.90033. The area marked with an arrow just below at 0.89747 is proving to be a difficult level for the sellers to break with two tails currently seen rejecting price from this area. For this trade to work out and to hit at least the first target, we will need to see price consume this small demand level with conviction.

[ul]
[li][B]There are no safe pending buy orders seen at the time of writing[/B].[/li][li][B]P.A confirmation buy orders[/B] (Red line) are seen just above the daily S/R flip level (0.88501) at 0.88533. This level needs to see some confirming price action before any entry is placed in the market, due to their being no logical area for a stop loss order.[/li][li][B]Near-term P.A confirmation buy orders[/B] are seen within demand (0.88973-0.89168) at 0.89029, just above the round number 0.89000, as price may retrace to demand to collect unfilled orders.[/li][li][B]The pending sell order[/B] (Green line) visible at the base of supply (0.90381-0.90033) just above the round number 0.90000 at 0.90063 still remains active, so keep a close eye on the first target area.[/li][li][B]No P.A confirmation sell orders[/B] are seen in the current market environment.[/li][/ul]

[ul]
[li][B]Areas to watch for buy orders:[/B] P.O: There are no pending buy orders seen in the current market environment. P.A.C: 0.88533 (SL: Decided if/when price ‘confirms’ the level TP: Decided if/when price ‘confirms’ the level) 0.89029 (SL: Likely to be set at 0.88784 TP: Decided if/when price ‘confirms’ the level).[/li][li][B]Areas to watch for sell orders[/B]: P.O: (Active) 0.90063 (SL: 0.90412 TP: [1] 0.89168 [2] 0.88501)P.A.C: There are currently no P.A confirmation orders seen in the current market environment.[/li][li][B]Most likely scenario: [/B]Sellers will likely attempt to consume the small demand area seen at 0.89747, if this happens there is very little stopping price from dropping to demand at 0.88973-0.89168.[/li][/ul]

XAU/USD (GOLD):

[B]4hr TF.
[/B]
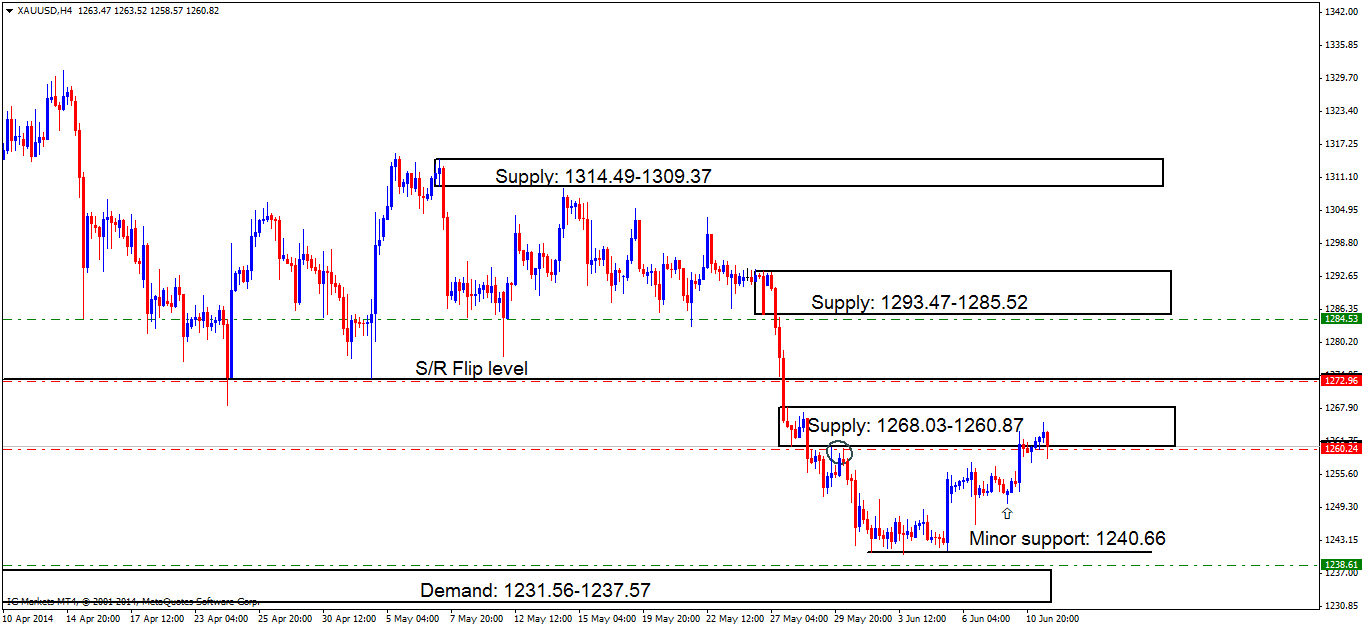
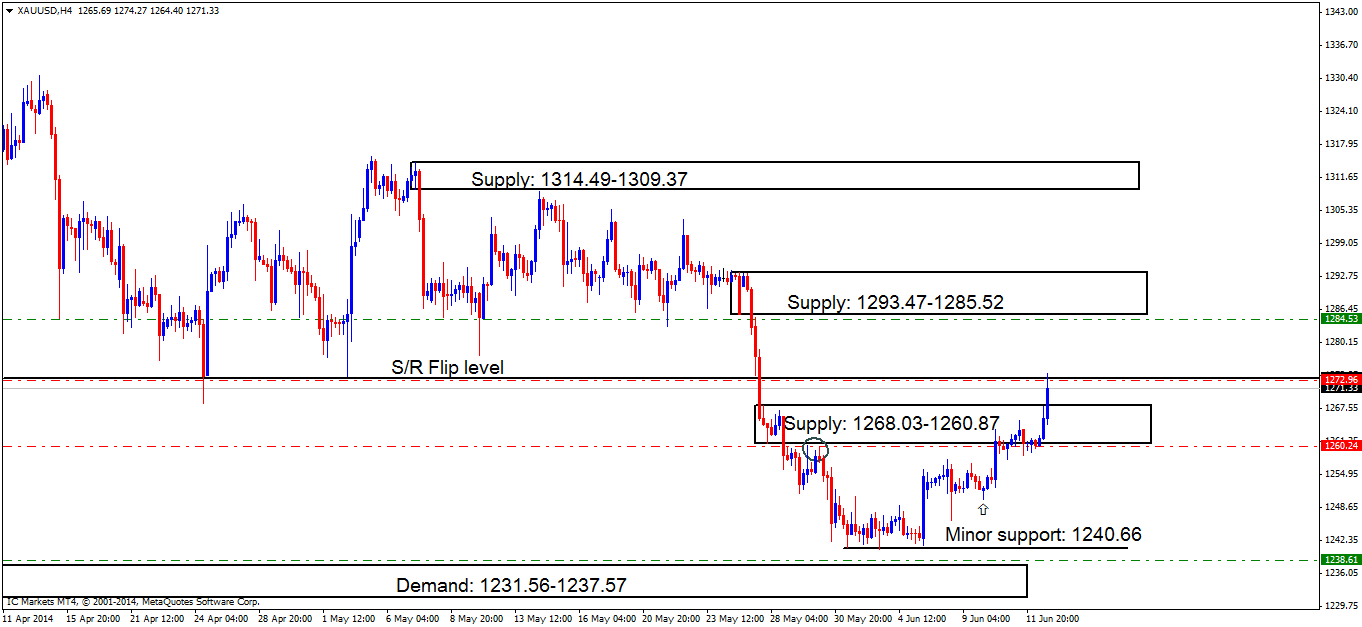
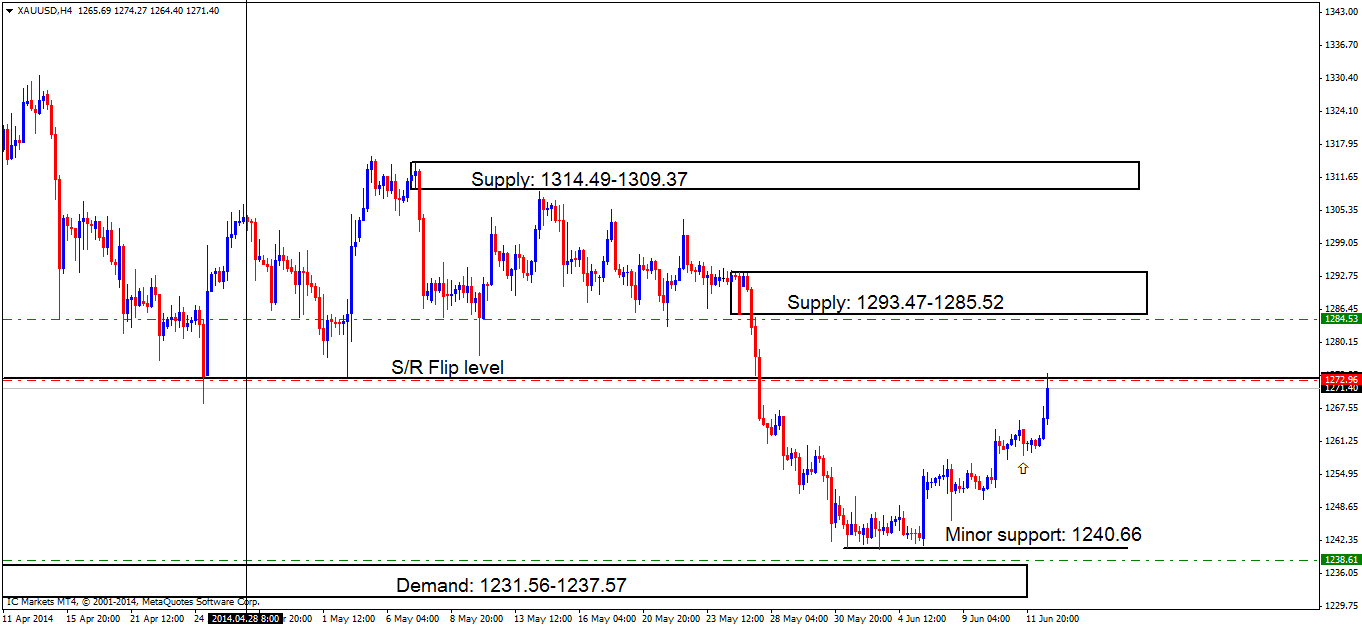
Gold is seen still trading within supply at 1268.03-1260.87, with not much developments being seen since the last analysis. Our P.A confirmation sell order is still active at 1260.24

Price is currently capped between the supply area mentioned above, and minor support below at 1240.66.

[ul]
[li][B]Pending buy orders[/B] (Green line) are seen above demand (1231.56-1237.57) at 1238.61 as pro money will likely fake the minor support level at 1240.66 into demand below (levels above).[/li][li][B]No P.A confirmation buy orders[/B] are seen in the current market environment.[/li][li][B]Pending sell orders[/B] (Green line) are seen just below supply (1293.47-1285.52) at 1284.53, as this level will likely see a reaction due to a supply/demand imbalance around this area indicating the possibility of unfilled sell orders there[/li][li][B]P.A confirmation sell orders[/B] just under the S/R flip area (1273.34) at 1272.96 will likely see a reaction; be that as it may, there is still no logical area for a stop, resulting in confirmation being required.[/li][li][B]The P.A confirmation sell order[/B] (Red line) set just below supply (1268.03-1260.87) at 1260.24 still remains active. Sellers will need to confirm this supply area by consuming the low 1250.17 marked with an arrow. If/when this happens; a pending order can be set at 1260.24, awaiting a possible return to this area.[/li][/ul]

[ul]
[li][B]Areas to watch for buy orders:[/B] P.O: 1238.61 (SL: 1230.64 TP: 1260.87 P.A.C: There are currently no P.A confirmation buy orders seen in the current market environment.[/li][li][B]Areas to watch for sell orders[/B]: P.O: 1284.53 (SL: 1294.70 TP: [1] 1273.34 [2] 1268.03) P.A.C:1272.96 (SL: Decided if/when price ‘confirms’ the level TP: Decided if/when price ‘confirms’ the level) 1260.24 (Active-awaiting confirmation) (SL: Will be likely set at 1269.04 TP: Decided if/when price ‘confirms’ the level).[/li][li][B]Most likely scenario: [/B]Seeing selling pressure around supply at 1268.03-1260.87 is unlikely since the higher timeframes are currently indicating longs as the daily timeframe is currently seen trading within demand at 1238.51-1254.97, hence the need for confirmation orders[B].[/B][/li][/ul]

EUR/USD:

[B]Weekly TF.[/B]
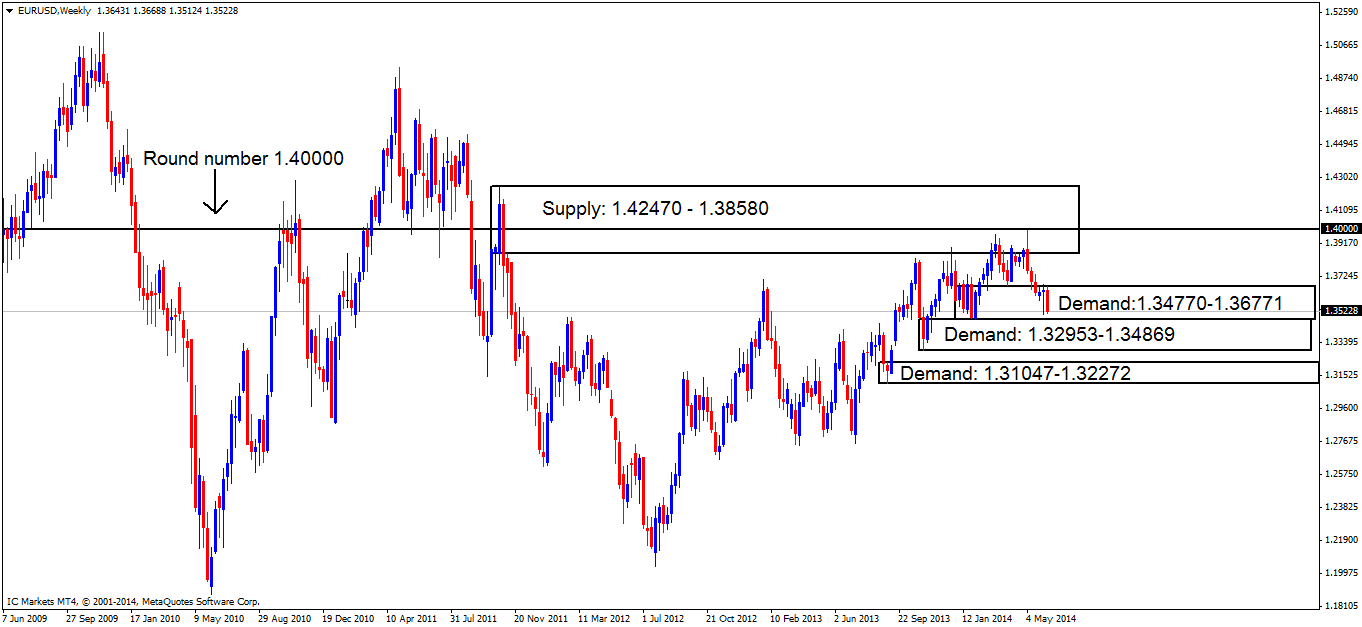
Weakness is being seen within the weekly demand area at 1.34770-1.36771, with buyers showing very little interest at the moment.


[B]Daily TF.[/B]
The daily demand area seen at 1.34770-1.35557 is the last logical area on this timeframe left within the weekly demand area (shown above), if a break of this area is seen, expect buyers to come into the market around demand below at 1.33995-1.34385.


[B]4hr TF.[/B]
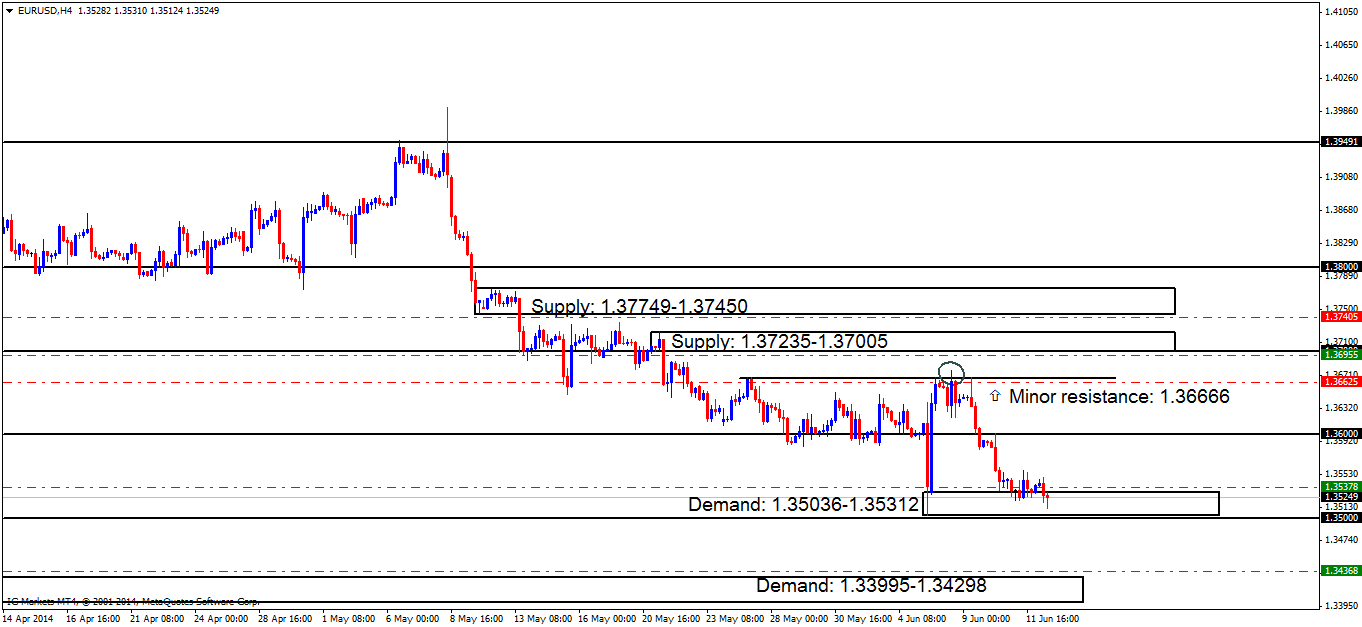
Technically, not a lot has changed since the last analysis. The demand area at 1.35036-1.35312 is still holding, a break below here could be bad news for anyone who is currently long the market. If a break below is seen here, the next fresh demand area on this timeframe is seen at 1.33995-1.34298 where pending buy orders are likely sitting.

However, with all things considered, we should not totally rule out this demand area (1.35036-1.35312) just yet, as a spike below to the round number 1.35000 may likely happen, this could give pro money the liquidity they need for higher prices to be seen i.e. Buyers’ stops (sell orders), and breakout sellers’ orders for them to buy into.

[B]Pending/P.A confirmation orders:[/B]

[ul]
[li][B]The Pending buy order[/B] (Green line) seen at 1.35378 just above demand at 1.35036-1.35312 is currently active, so keep a close eye on the first target area (reported below).[/li][li][B]New pending buy orders [/B]are seen around demand (1.33995-1.34298) at 1.34368. This demand area will more than likely see some sort of reaction due to its location seen to the left.[/li][li][B]Pending sell orders[/B] (Green line) seen at 1.36955 just below supply at 1.37235-1.37005 are set here since this level remains untouched, meaning unfilled orders are likely still set around this area.[/li][li][B]P.A confirmation sell orders[/B] (Red line) are seen higher up at 1.37405 just below supply at 1.37749-1.37450, this level requires confirmation because of how close the supply areas (levels above) are together, thus making a logical target area unavailable.[/li][li][B]P.A confirmation sell orders [/B]are visible below the minor resistance 1.36666 at 1.36625, this level has proved valid, but still needs to be confirmed due to a spike seen on Friday (circled) which may have consumed most of the sellers originally there. [B]Do be on your guard with these sell orders; the higher-timeframes are indicating that higher prices may be seen this week.[/B][/li][/ul]

[ul]
[li][B]Areas to watch for buy orders:[/B] P.O: (Active) 1.35378 (SL: 1.34971 TP: [1] 1.36000 [2] 1.36666) 1.34368 (SL: 1.33926 TP: Dependent on how price action approaches the zone). P.A.C: No P.A confirmation buy orders are seen in the current market environment.[/li][li][B]Areas to watch for sell orders[/B]: P.O: 1.36955 (SL: 1.37270 TP: [1] 1.36666 [2] 1.36000) P.A.C: 1.37405 (SL: More than likely at 1.37791 TP: Dependent on where price ‘confirms’ the level) 1.36625 (SL: 1.36810 TP: Dependent on where price ‘confirms’ the level).[/li][li][B]Most likely scenario: [/B]The demand area at 1.35036-1.35312 will likely still see a bullish reaction, nevertheless, a spike lower may be seen to the round number at 1.35000 before higher prices are seen.[/li][/ul]

GBP/USD:

[B]4hr TF.[/B]
The round number 1.68000 has been well and truly consumed; sellers did try to fight back around this price level, but were unable to cope with the onslaught of buying pressure thrown at them.

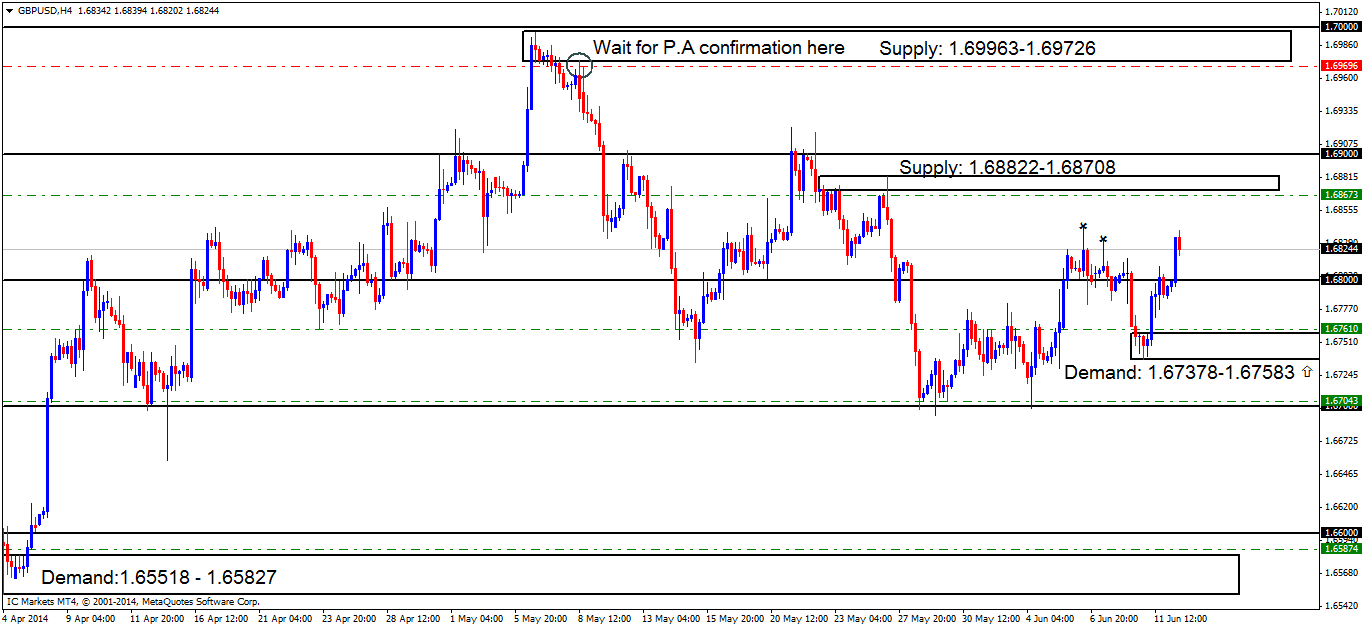
A new near-term demand area has been formed at 1.67378-1.67583. This demand area looks particularly tasty because price has likely consumed any selling pressure above at the highs (1.68324/1.68419) each marked with an x. So, if price does manage to retrace to our demand area, a nice reaction is likely to be seen.

Price is now currently capped between supply above at 1.68822-1.68708 and the demand area just mentioned above.

[B]Pending/P.A confirmation orders:[/B]

[ul]
[li][B]Pending buy orders[/B] (Green line) are seen below (1.65874) just above demand at 1.65518-1.65827. This area shows great potential as the momentum away from the base indicates unfilled orders may still be in play.[/li][li][B]The next set of pending buy orders[/B] (Green line) are seen just above the round number 1.67000 at 1.67043, this area will likely see a reaction due to the amount of credible touches this level has seen, making it an area to watch out for.[/li][li][B]Near –term pending buy orders[/B] are seen at 1.67610 just above demand at 1.67378-1.67583. A pending order is valid here since there is a likely possibility sellers have been consumed above at the highs (1.68324/1.68419) clearing the path for higher prices, therefore, if a retracement is seen to our demand area, buyers will likely be active here.[/li][li][B]Pending sell orders[/B] (Green line) are visible below supply (1.68822-1.68708) at 1.68673 due to strong momentum away from this area, indicating unfilled orders may still be hiding there.[/li][li][B]P.A confirmation sell orders[/B] (Red line) are seen at 1.69696 just below supply at 1.69963-1.69726. The reason this level requires confirmation is due to the wicks spiking the area as price left the base (circled) warning us sellers may have already been consumed.[/li][/ul]

[ul]
[li][B]Areas to watch for buy orders:[/B] P.O: 1.65874 (SL: 1.65472 TP: Dependent on approaching price action nearer the time) 1.67043 (SL: 1.66527 TP: [1] 1.68000 [3] 1.68708) 1.67610 (SL: 1.67345 TP: [1] 1.68000 [2] 1.68708. P.A.C: No P.A confirmation buy orders are seen in the current market environment.[/li][li][B]Areas to watch for sell orders[/B]: P.O: 1.68673 (SL: 1.68846 1 TP: 1.68000 but may be subject to change). P.A.C: 1.69696 (SL: More than likely will be at 1.70030 TP: Dependent on where price ‘confirms’ the level).[/li][li][B]Most likely scenario: [/B]Price will likely see a decline in value, consuming the round number 1.68000 towards demand at 1.67378-1.67583 where a reaction will more than likely be seen.[/li][/ul]

AUD/USD:

[B]4hr TF.[/B]
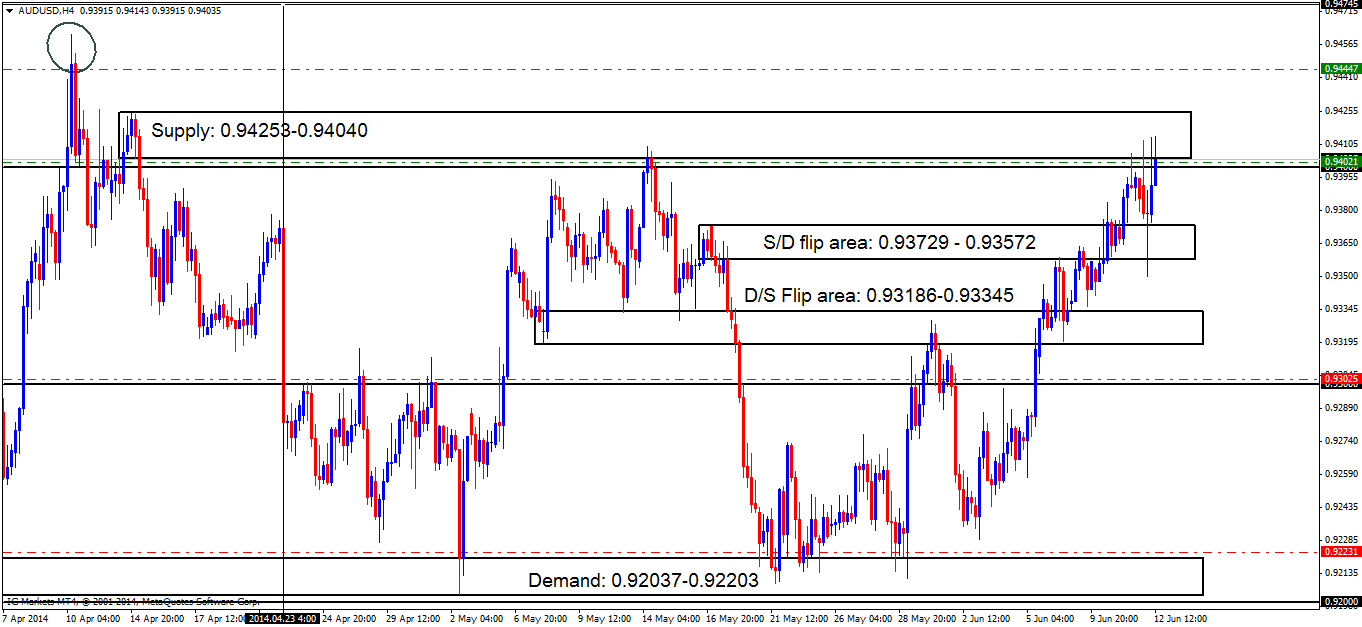
Price, so far, has reacted fairly well to our supply area at 0.94253-0.94040, be that as it may, the round number seen just below at 0.94000 likely added extra resistance to the trade.

Price will likely still see lower prices from around this area, so do not go closing your positions just because the first target area has been hit (reported below), as do not forget we are currently trading in and around higher timeframe supply both on the weekly timeframe (0.93718) and on the daily timeframe (0.94468-0.93758).

Price is now currently capped between supply above at 0.94253-0.94040 and demand below (S/D flip area) at 0.93729-0.93572). A break above supply could force price to test the highs marked with a circle at around 0.94474, conversely, a break below could see price testing the D/S flip area at 0.93186-0.93345.

[B]Pending/P.A confirmation orders:
[/B]

[ul]
[li][B]No pending buy orders [/B]are seen in the current market environment.[/li][li][B]P.A confirmation buy orders[/B] (Red line) are seen at 0.92231 just above demand at 0.92037-0.92203. It would be too risky to set a pending order around this area, since deep spikes into this demand zone have been seen (levels above) possibly consuming the majority of buyers in the process.[/li][li][B]The next set of P.A confirmation buy orders[/B] (Red line) are visible just above the round number 0.93000 at 0.93025. We require confirmation of this level because previous price action has warned us deep tests both north and south happen on a regular basis, hence the need to wait for confirmation rather than getting stopped out time after time through lack of patience.[/li][li][B]The pending sell order[/B] (Green line) set just below supply (0.94253-0.94040) at 0.94021 is now active; with our first target being hit at 0.93729. The trade will remain active with the stop-loss order set in its original position at 0.94277.[/li][li][B]New pending sell orders [/B]are seen at 0.94447, if price manages to get up to this level, active sellers are likely waiting because of how quickly price changed in direction, only pro money have the account size to do this, indicating unfilled sell orders may still be set there.[/li][li][B]No P.A confirmation sell orders [/B]are seen in the current market environment.[/li][/ul]

[ul]
[li][B]Areas to watch for buy orders:[/B] P.O: No pending orders are seen with current price action. P.A.C: 0.92231 (SL: more than likely will be at 0.91984 TP: Decided if/when price ‘confirms’ the level) 0.93025 (SL: Dependent on where price ‘confirms’ the level TP: Dependent on where price ‘confirms’ the level).[/li][li][B]Areas to watch for sell orders[/B]: P.O: (Active – 1[SUP]st[/SUP] target hit, trade still live) 0.94021 (SL: 0.94277 TP: [1] 0.93345 [2] 0.93000) 0.94447 (SL: 0.94667 TP: Dependent on how price action approaches the area). P.A.C: No P.A confirmation sell orders seen in the current market environment.[/li][li][B]Most likely scenario: [/B]Price will likely see more of a decline from supply at 0.94253-0.94040 to at least 0.93345. If price breaks the supply area just mentioned, look for sellers to come into the market around the highs at 0.94474.[/li][/ul]

USD/JPY:

[B]4hr TF.[/B]
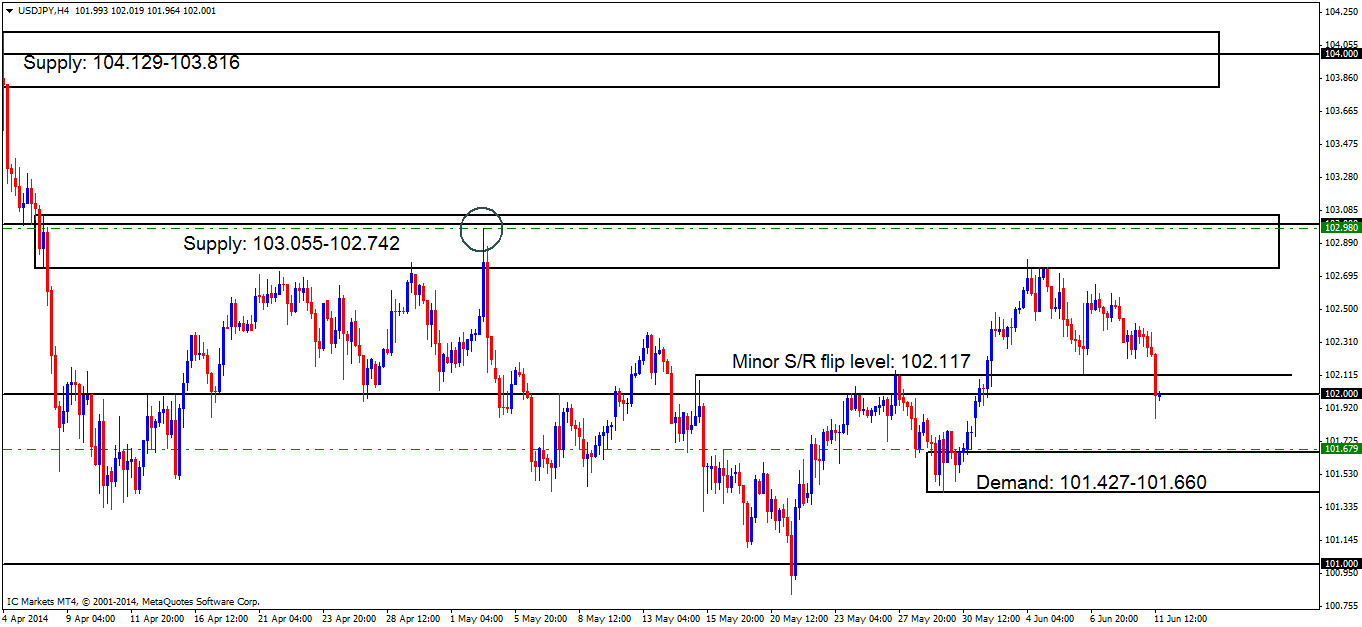
Overall, not much has changed since the last analysis, price still remains capped between supply above at 103.055-102.742 and demand below at 101.427-101.660.

The small area marked with an arrow at 102.367 is where pro money possibly made a decision to bring prices lower, consuming the minor S/R flip area (102.117) and the round number 102.000, so, this is a strong area of interest for us in the near-term future.

[B]Pending/P.A confirmation orders:
[/B]

[ul]
[li][B]Pending buy orders[/B] (Green line) are seen just above demand (101.427-101.660) at 101.679, as this demand remains fresh and likely still holds unfilled orders.[/li][li][B]No P.A confirmation buy orders [/B]are seen in the current market environment.[/li][li][B]Pending sell orders[/B] (Green line) are visible at 102.980, deep within supply (103.055-102.742), this area may well appear to be weak now, but the way price reacted at the circled area within supply indicates pro money activity, meaning sell orders may be left unfilled there, so a pending order is permitted.[/li][li][B]New near-term pending sell orders [/B]are seen at 102.367. A pending order is valid here since this is the area where pro money made the ‘decision’ to take prices lower, unfilled sell orders were likely left there in the process.[/li][li][B]No P.A confirmation sell orders[/B] are seen in the current market environment.[/li][/ul]

[ul]
[li][B]Areas to watch for buy orders:[/B] P.O:101.679 (SL: 101.404 TP: [1] 102.000 [2] 102.742 but may be subject to change) P.A.C: No P.A confirmation buy orders seen in the current market environment.[/li][li][B]Areas to watch for sell orders[/B]: P.O: 102.980 (SL: 103.108 TP: 102.117, but may well change if the market sees any developments) 102.367 (SL: 102.458 TP: Dependent on how price action approaches this area). P.A.C: No P.A confirmation sell orders seen in the current market environment.[/li][li][B]Most likely scenario: [/B]Price will likely see a rally towards the decision point marked with an arrow at 102.367 where active sellers are possibly waiting. Following this, price will likely drop to fresh demand at 101.427-101.660.[/li][/ul]
EUR/GBP:

[B]Weekly TF.[/B]
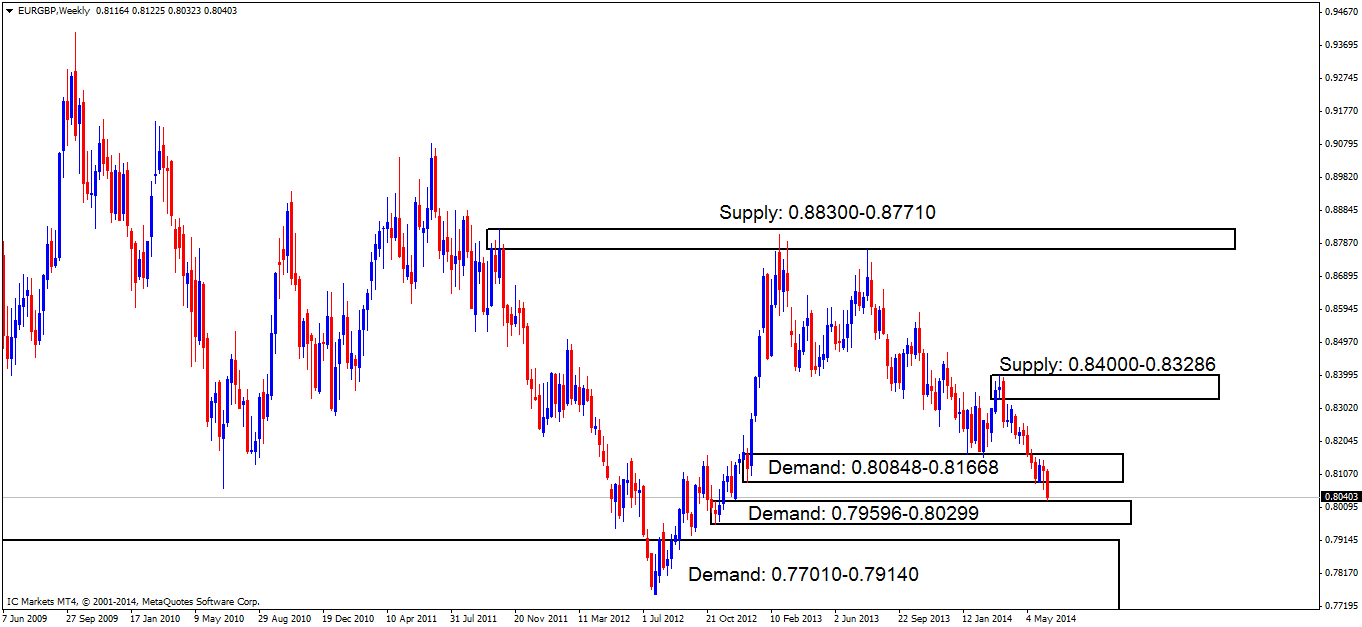
A quick update of the weekly timeframe shows that demand at 0.80848-0.81668 has well and truly been consumed. Price is now seen slightly reacting off of demand at 0.79596-0.80299.


[B]Daily TF.[/B]
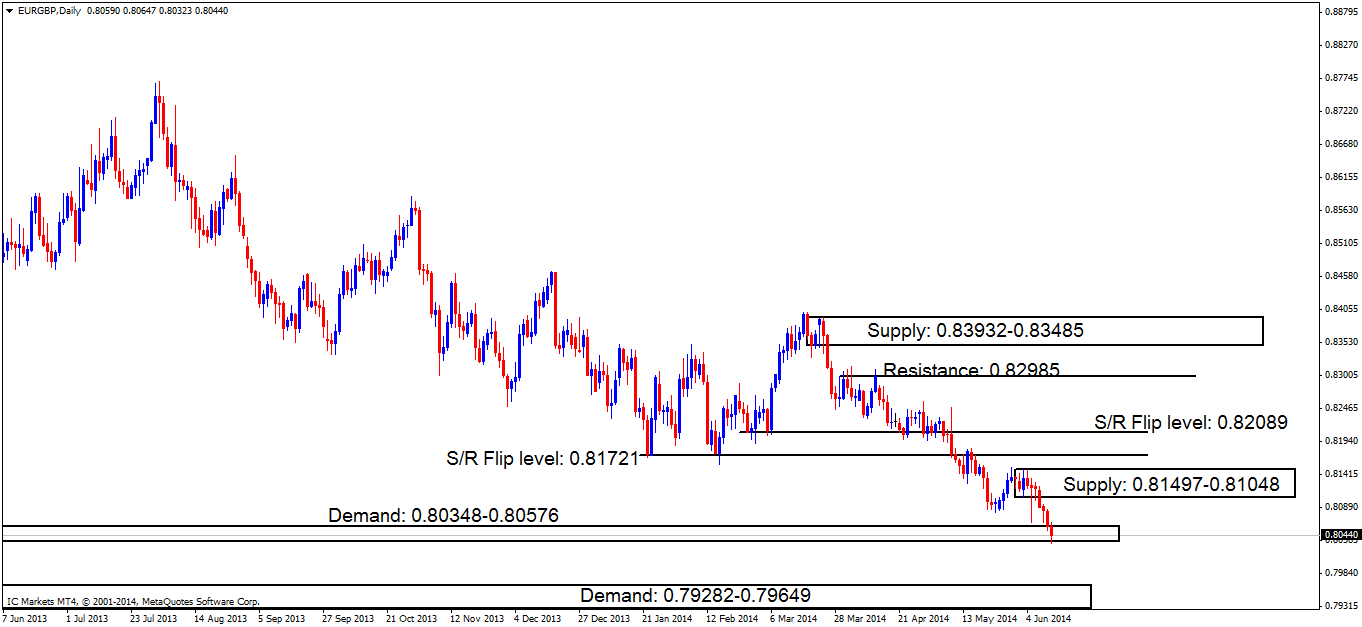
The daily timeframe shows price has spiked demand at 0.80348-0.80576, consuming most of the buyers in and around this area, if we see a positive close below here; the next demand area is seen at 0.79282-0.79649. But do keep in mind; we are currently touching weekly demand as shown above at 0.79596-0.80299, so higher prices are expected.


[B]4hr TF.[/B]
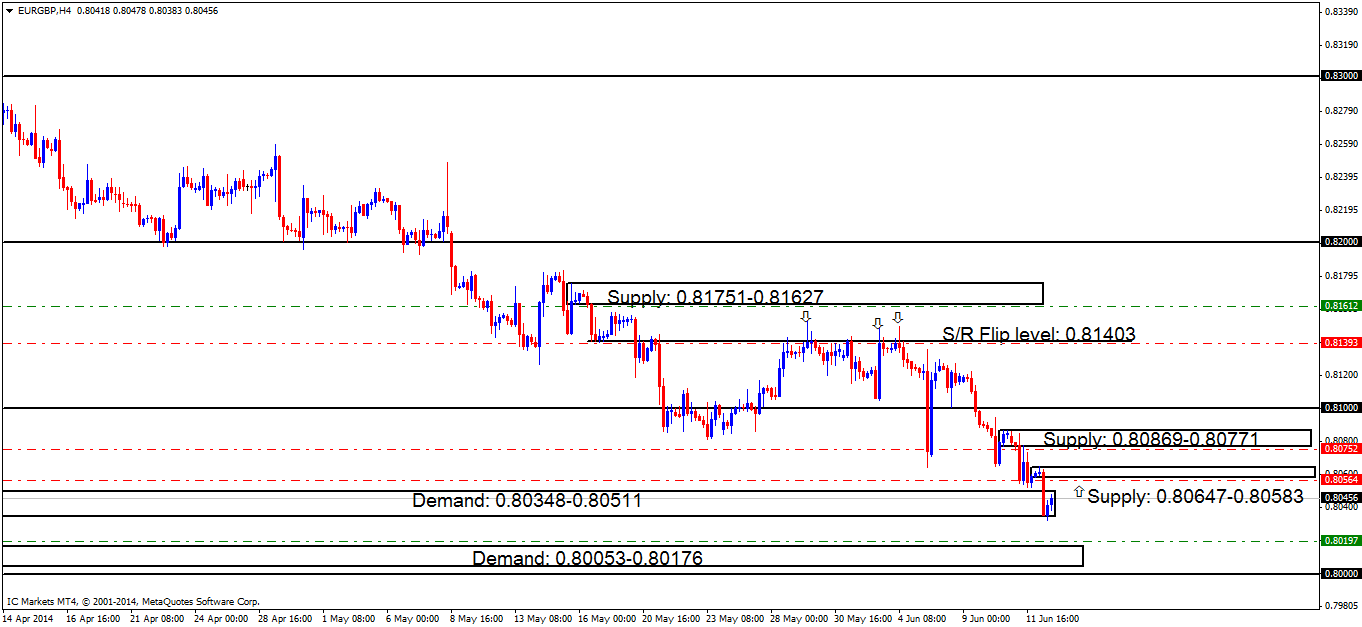
Chart 1 below shows our pending buy order at 0.80543 was filled, but then very shortly after stopped out marked with an arrow. It seems the sellers at the D/S flip area (0.80612-0.80777) were too strong for buyers on this occasion.

Chart 1:

Chart 2 below shows two stacked supply areas with the highest being seen at 0.80869-0.80771, and the lowest seen at 0.80647-0.80583. Although these supply areas look quite good, we have to be very careful here as price could very easily consume these levels as we are currently trading at weekly demand (0.79596-0.80299) as shown above. If price does continue lower however, the next demand area is seen just above the huge round number 0.80000 at 0.80053-0.80176.

[B]Pending/P.A confirmation orders:[/B]

[ul]
[li][B]The pending buy order[/B] (Green line) set at 0.80543 just above demand (0.80348-0.80511) was filled and then stopped out within a pip! (Chart 1 shown with an arrow).[/li][li][B]New pending buy orders [/B]are seen just above demand (0.80053-0.80176) at 0.80197. A pending order is valid here due to price currently trading around the base of weekly demand at 0.79596-0.80299.[/li][li][B]No P.A confirmation buy orders [/B]are seen in the current market environment.[/li][li][B]Pending sell orders[/B] (Green line) are spotted just under fresh supply (0.81751-0.81627) at 0.81612 due to the area being fresh giving the impression orders may still remain unfilled there.[/li][li][B]P.A confirmation sell orders[/B] (Red line) under the S/R flip level 0.81403 at 081393 is an area where a reaction is likely, however there were too many wicks north seen marked with arrows, indicating sellers are drying up, thus, the need to wait for more confirmation.[/li][li][B]New P.A confirmation sell orders [/B]are seen just under supply (0.80647-0.80583) at 0.80564. The reason a pending order is not valid here is because price is trading around a weekly demand area (0.79596-0.80299), which means price could easily consume this supply level as the higher timeframes usually overrule the lower timeframes.[/li][li][B]New P.A confirmation sell orders [/B]are seen just under supply (0.80869-0.80771) at 0.80752. Confirmation orders were used here because price is trading around a weekly demand area (0.79596-0.80299), which means price could easily consume this supply level as the higher timeframes usually overrule the lower timeframes.[/li][/ul]

Chart 2:

[ul]
[li][B]Areas to watch for buy orders:[/B] P.O:0.80197 (SL: 0.79959 TP: Dependent on how price action approaches the area) P.A.C: No P.A confirmation buy orders seen in the current market environment.[/li][li][B]Areas to watch for sell orders[/B]: P.O: 0.81612 (SL: 0.81784 TP: [1] 0.81403 [2] 0.81000) P.A.C: 0.81393 (SL: Will be likely set at 0.81564 TP: Will be likely set at the round number 0.81000) 0.80752 (SL: likely to be set at 0.80900 TP: Dependent on where price ‘confirms’ the level) 0.80564 (SL: Dependent on where price ‘confirms’ the level TP: Dependent on where price ‘confirms’ the level).[/li][li][B]Most likely scenario: [/B] Price will likely trade in between supply at 0.80647-0.80583 and demand at 0.80053-0.80176 during the lower volume sessions. Once volatility picks up a break of supply is more likely than demand below as we are trading at weekly demand seen at 0.79596-0.80299.[/li][/ul]

USD/CAD:

[B]4hr TF.[/B]
In the last analysis it was reported that price would possibly continue declining until the buyers outweigh the sellers, which would likely be around the demand area at 1.08142-1.08330, where we currently have a confirmation order set at 1.08348. Sellers are certainly still in control with no sign of letting up seen yet.

Price is currently capped between supply at 1.08907-1.09047, and demand below at 1.08142-1.08330.

[B]Pending/P.A confirmation orders:[/B]

[ul]
[li][B]At the time of writing there are no pending buy orders seen[/B].[/li][li][B]P.A confirmation buy orders[/B] (Red line) seen just above demand (1.08142-1.08330) at 1.08348. There may be orders left unfilled here, however, a pending order is not wise due to how deep price penetrated the level before (marked with an arrow).[/li][li][B]Pending sell orders[/B] (Green line) just below supply (1.10039-1.09875) at 1.09851 will very likely see a nice reaction. However, we should remain aware of the big figure number 1.10000 lurking within the top half of the supply area (levels above), so a bigger stop may be necessary.[/li][li][B]P.A confirmation sell orders [/B]are seen just below the S/R flip level (1.09408) at 1.09361. A P.A.C order was selected here because of the deep wicks seen in and around this area, possibly indicating sellers have been consumed, thus weakening the level on return.[/li][li][B]New P.A confirmation sell orders [/B]are seen just below the D/S flip area (1.08907-1.09047) at 1.08876. Pending orders are not logical here since price could very well spike north, deep into the zone, attempting to penetrate the round number 1.09000 which could possibly stop us out if we had pending orders set.[/li][/ul]

[ul]
[li][B]Areas to watch for buy orders:[/B] P.O: There are no pending buy orders seen in the current market environment. P.A.C: 1.08348 (SL: Likely to be set at 1.08127 TP: Decided if/when price ‘confirms’ the level).[/li][li][B]Areas to watch for sell orders[/B]: P.O: 1.09851 (SL: 1.10114 TP: [1] 1.09408 [2] 1.09047) P.A.C: 1.09361 (SL likely to be set at 1.09513 TP Decided if/when price ‘confirms’ the level) 0.08876 (SL: Decided if/when price ‘confirms’ the level TP: Decided if/when price ‘confirms’ the level).[/li][li][B]Most likely scenario: [/B]Price will likely continue Dropping towards demand at 1.08142-1.08330, where a bullish reaction is expected to be seen.[/li][/ul]

USD/CHF:

[B]4hr TF.[/B]
Sellers are beginning to show some energy around supply at 0.90381-0.90033. A bearish engulfing candle marked with an x has been seen given us some possible indication price may be south soon. However, sellers still have to deal with temporary buyers around a trouble point at 0.89747 marked with an arrow before lower prices can be seen.

At the time of writing price seems to be temporarily capped between the trouble point below at 0.89747 and supply above at 0.90381-0.90033. A break above this supply could force price to test supply at 0.91339-0.91116 (not visible on the chart below).

[B]Pending/P.A confirmation orders:[/B]

[ul]
[li][B]There are no safe pending buy orders seen at the time of writing[/B].[/li][li][B]P.A confirmation buy orders[/B] (Red line) are seen just above the daily S/R flip level (0.88501) at 0.88533. This level needs to see some confirming price action before any entry is placed in the market, due to their being no logical area for a stop loss order.[/li][li][B]Near-term P.A confirmation buy orders[/B] are seen within demand (0.88973-0.89168) at 0.89029, just above the round number 0.89000, as price may retrace to demand to collect unfilled orders.[/li][li][B]The pending sell order[/B] (Green line) visible at the base of supply (0.90381-0.90033) just above the round number 0.90000 at 0.90063 still remains active, so keep a close eye on the first target area.[/li][li][B]No P.A confirmation sell orders[/B] are seen in the current market environment.[/li][/ul]

[ul]
[li][B]Areas to watch for buy orders:[/B] P.O: There are no pending buy orders seen in the current market environment. P.A.C: 0.88533 (SL: Decided if/when price ‘confirms’ the level TP: Decided if/when price ‘confirms’ the level) 0.89029 (SL: Likely to be set at 0.88784 TP: Decided if/when price ‘confirms’ the level).[/li][li][B]Areas to watch for sell orders[/B]: P.O: (Active) 0.90063 (SL: 0.90412 TP: [1] 0.89168 [2] 0.88501) P.A.C: There are currently no P.A confirmation orders seen in the current market environment.[/li][li][B]Most likely scenario: [/B]Sellers will likely attempt to consume the small demand area seen at 0.89747, if this happens there is very little stopping price from dropping to demand at 0.88973-0.89168.[/li][/ul]

XAU/USD (GOLD)

[B]Daily TF.[/B]
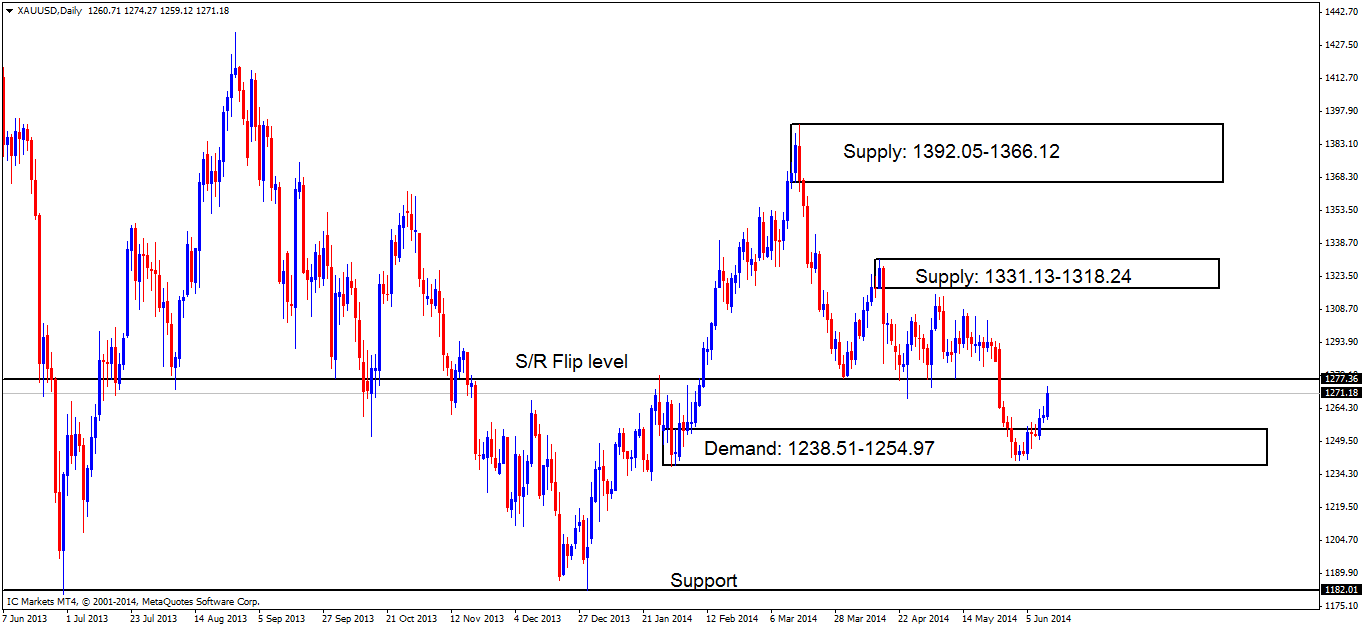
Demand has been confirmed at 1238.51-1254.97 with price rallying up to the S/R flip level seen at 1277.36.


[B]4hr TF.[/B]
Chart 1 below shows supply at 1268.03-1260.87 has been consumed which was reported may happen in yesterday’s analysis.

Chart 1:

Chart 2 below shows price is slightly reacting bearishly off of the S/R flip level at 1272.96. This level will need to be confirmed by consuming the low marked with an arrow at 1258.57, before any pending order or even market order is entered into the market.

[B]Pending/P.A confirmation orders:[/B]

[ul]
[li][B]Pending buy orders[/B] (Green line) are seen above demand (1231.56-1237.57) at 1238.61 as pro money will likely fake the minor support level at 1240.66 into demand below (levels above).[/li][li][B]No P.A confirmation buy orders[/B] are seen in the current market environment.[/li][li][B]Pending sell orders[/B] (Green line) are seen just below supply (1293.47-1285.52) at 1284.53, as this level will likely see a reaction due to a supply/demand imbalance around this area indicating the possibility of unfilled sell orders there.[/li][li][B]The P.A confirmation sell order[/B] just under the S/R flip area (1273.34) at 1272.96 is now active. Sellers will need to confirm this level by consuming the low at 1258.57 marked with an arrow (chart 2), a pending order can then be set at 1272.96 awaiting a possible return.[/li][li][B]The P.A confirmation sell order[/B] (Red line) set just below supply (1268.03-1260.87) at 1260.24 has been cancelled. Price rallied too far from the confirmation level, and no attempt was made on consuming the low 1250.17 marked with an arrow as shown on chart 1.[/li][/ul]
Chart 2:

[ul]
[li][B]Areas to watch for buy orders:[/B] P.O: 1238.61 (SL: 1230.64 TP: 1260.87 P.A.C: There are currently no P.A confirmation buy orders seen in the current market environment.[/li][li][B]Areas to watch for sell orders[/B]: P.O: 1284.53 (SL: 1294.70 TP: [1] 1273.34 [2] 1268.03) P.A.C: (Active-awaiting confirmation) 1272.96 (SL: Decided if/when price ‘confirms’ the level TP: Decided if/when price ‘confirms’ the level).[/li][li][B]Most likely scenario: [/B]Price will likely trade around the S/R flip level 1272.96 during the low-volume sessions, once volatility picks up a drop from this area may be seen to around the lows at 1258.57.[/li][/ul]

EUR/USD:

[B]Weekly TF.[/B]
No higher prices were seen last week as reported may happen in the last weekly analysis. The most recently closed weekly candle (1.35404) was unable to break the previous weekly high or low (1.36771/1.35036), forming what most traders call an ‘Inside bar/candle’ seen deep within weekly demand at 1.34770-1.36771. A close below this demand area is yet happen, however, if a close below is seen, price will then be trading within the next weekly demand area below at 1.32953-1.34869.

Price still remains trading between the demand area below at 1.34770-1.36771, and supply above at 1.42470-1.38580.

[B]Daily TF.[/B]
Price is currently trading within the daily demand area seen at 1.34770-1.35557, which is the last logical daily demand area bounded by weekly demand at 1.34770-1.36771. A break below this daily level could force price to test the next daily demand area below at 1.33995-1.34385, conveniently located within the next weekly demand area below at 1.32953-1.34869.

[B]4hr TF.[/B]
The demand area seen at 1.35036-1.35312 is still holding, a bullish reaction has been seen, but without any conviction! If a break below is seen here, the next fresh demand area on this timeframe is seen at 1.33995-1.34298 where pending buy orders are likely sitting.

This demand area (1.35036-1.35312) should not be totally ruled out yet as we are still within weekly and daily demand areas (1.34770-1.36771/ 1.34770-1.35557) which can be seen above. A spike below the 4hr demand area to the round number 1.35000 may likely be seen either today or tomorrow, this could give pro money the liquidity they need for higher prices to be seen i.e. Buyers’ stops (sell orders), and breakout sellers’ orders for them to buy into.

[B]Pending/P.A confirmation orders:[/B]

[ul]
[li][B]The Pending buy order[/B] (Green line) seen at 1.35378 just above demand at 1.35036-1.35312 is currently active, so keep a close eye on the first target area (reported below).[/li][li][B]Pending buy orders [/B](Green line) are seen around demand (1.33995-1.34298) at 1.34368. This demand area will more than likely see some sort of reaction due to its location seen to the left.[/li][li][B]Pending sell orders[/B] (Green line) seen at 1.36955 just below supply at 1.37235-1.37005 are set here since this level remains untouched, meaning unfilled orders are likely still set around this area.[/li][li][B]P.A confirmation sell orders[/B] (Red line) are visible below the minor resistance 1.36666 at 1.36625, this level has proved valid, but still needs to be confirmed due to a spike/wick (circled) seen above resistance, which may have consumed most of the sellers originally there. [B]Do be on your guard with these sell orders; the higher-timeframes are indicating that higher prices may be seen this week.[/B][/li][/ul]

[ul]
[li][B]Areas to watch for buy orders:[/B] P.O: (Active) 1.35378 (SL: 1.34971 TP: [1] 1.36000 [2] 1.36666) 1.34368 (SL: 1.33926 TP: Dependent on how price action approaches the zone). P.A.C: No P.A confirmation buy orders are seen in the current market environment.[/li][li][B]Areas to watch for sell orders[/B]: P.O: 1.36955 (SL: 1.37270 TP: [1] 1.36666 [2] 1.36000) P.A.C: 1.36625 (SL: 1.36810 TP: Dependent on where price ‘confirms’ the level).[/li][li][B]Most likely scenario: [/B] Much the same as Friday’s analysis, the demand area at 1.35036-1.35312 will likely still see more of a bullish reaction, nevertheless, a spike lower may be seen to the round number at 1.35000 before higher prices are seen.[/li][/ul]

GBP/USD:

[B]Weekly TF.[/B]
The buyers were certainly in full force last week, with sellers showing little, to no interest on this timeframe. Friday saw a close at 1.69632 which is the highest close above the long-term consolidation area (1.67980-1.42273) seen since right back to 19/10/2008. Will buyers have the strength for one last push up to weekly supply at 1.76290-1.70490?

[B]Daily TF.[/B]
The daily timeframe shows price rallied right into overall larger daily supply seen at 1.70410-1.68880 also hitting minor daily supply within at 1.69963-1.69514. A small bearish reaction has been seen, but this could have been selling pressure from the huge round number 1.70000 looming just above, and not necessarily from any of the daily supply areas just mentioned. It will be interesting to see how price action will unfold in the next few days or so.

If a break above is seen, price will likely trade up to the next supply area at 1.76290-1.73110 deep within weekly supply at 1.76290-1.70490 (not seen on the chart below).

[B]4hr TF.[/B]
Chart 1 shows the pound was very active on Friday seeing a huge burst of buying pressure from the bulls. Price broke and nearly retested the round number 1.68000 missing by a pip or two, before taking off like a rocket, consuming supply at 1.68822-1.68708 in the process, before finally meeting selling pressure at supply (1.69963-1.69726) above.

Chart 1:

[B]Pending/P.A confirmation orders:[/B]

[ul]
[li][B]The pending buy order[/B] (Green line) (1.65874) just above demand at 1.65518-1.65827 has been cancelled for now as price has traded too far from this area, and currently not visible on chart 2 but can be seen on chart 1.[/li][li][B]Pending buy orders[/B] (Green line) are seen just above the round number 1.67000 at 1.67043, this area will likely see a reaction due to the amount of credible touches this level has seen, making it an area to watch out for.[/li][li][B]Pending buy orders [/B](Green line) are seen at 1.67610 just above demand at 1.67378-1.67583. A pending order is valid here due to the momentum away from the demand area, indicating orders may be left unfilled here.[/li][li][B]P.A confirmation buy orders[/B] (Red line) are seen just above the round number 1.68000 at 1.68038. A reaction may be likely here because of the way pro money used this level to rally prices higher with force, a quick change in direction like this likely indicates pro money activity, thus, all of their orders may have not been filled at that time.[/li][li][B]P.A confirmation buy orders[/B] (Red line) are seen just above the round number 1.69000 at 1.69029. This level is definitely no place for a pending order since there is no logical area for a stop loss order.[/li][li][B]The pending sell order[/B] (Green line) set below supply (1.68822-1.68708) at 1.68673 has been stopped out.[/li][li][B]The P.A confirmation sell orders[/B] (Red line) set at 1.69696 just below supply at 1.69963-1.69726 is now active. Price will need to convincingly consume buyers around the round number 1.69000 below before a pending order is permitted.[/li][/ul]
Chart 2 below shows price is capped between supply at 1.69963-1.69726 and the round number 1.69000 below. A break of either one of these areas will provide us a great deal of information as to where price is likely heading next.

Chart 2:

[ul]
[li][B]Areas to watch for buy orders:[/B] P.O: 1.67043 (SL: 1.66527 TP: [1] 1.68000 [3] 1.68708) 1.67610 (SL: 1.67345 TP: [1] 1.68000 [2] 1.69000 [likely to be changed, depending on price approach]).P.A.C: 1.68038 (SL: Dependent on where price ‘confirms’ the level TP: Dependent on where price ‘confirms’ the level) 1.69029 (SL: Dependent on where price ‘confirms’ the level TP: Dependent on where price ‘confirms’ the level).[/li][li][B]Areas to watch for sell orders[/B]: P.O: No pending sell orders seen in the current market environment. P.A.C: (Active-awaiting confirmation) 1.69696 (SL: More than likely will be at 1.70030 TP: Dependent on where price ‘confirms’ the level).[/li][li][B]Most likely scenario: [/B]Today, price will likely trade within the limits of where price is capped (Supply 1.69963-1.69726 Demand: 1.69000), A break is very unlikely as Monday’s trading has a notoriously slow reputation.[/li][/ul]

AUD/USD:

[B]Weekly TF.[/B]
Technically, not much has changed on this timeframe; price still continues to consolidate around the S/R flip level 0.93718, with a positive break in either direction yet to be seen.


[B]Daily TF.[/B]
For the best part of last week, buyers were being seen pushing price deep into supply at 0.94468-0.93758, except on Friday, where sellers began to show interest.

The circled wick to the left could be a sign that the aforementioned supply area is weak. This spike could have likely consumed the majority of sellers in and around this area, indicating pro money may likely push prices higher to at least fresh supply above at 0.95434-0.94862 which may even be a fakeout to push prices lower, only time will tell.

[B]4hr TF.[/B]
Chart 1 below shows the buyers had completely consumed supply at 0.94253-0.94040 last week, stopping out our active sell trade (0.94021) for a small profit, if it was managed correctly. Following this, price came within around 7 -8 pips or so from our pending sell order at 0.94447 around the highs 0.94613, which subsequently dropped quite rapidly with the market closing at 0.94006.

Chart 1:

Chart 2 below shows (marked with a mini-tendline) how pro money may be likely in the process of consuming small lower-timeframe demand pockets, consequently clearing the path south for sellers (pro money).

Pro money may have got all the liquidity they need for a sell off from this push up above supply (0.94253-0.94040) that has now been erased (can be seen on chart 1 above), but there is always the possibility they have not, hence the pending order around the highs 0.94613 at 0.94447 has not been removed as we have to keep in mind we are still trading around higher-timeframe weekly and daily supply areas (0.93718/0.94468-0.93758) and a drop in price is just as likely as a rally in price at the time of writing.

[ul]
[li][B]No pending buy orders[/B] (Green line) are seen in the current market environment.[/li][li][B]P.A confirmation buy orders[/B] (Red line) are seen at 0.92231 just above demand at 0.92037-0.92203. It would be too risky to set a pending order around this area, since deep spikes into this demand zone have been seen (levels above) possibly consuming the majority of buyers in the process.[/li][li][B]The next set of P.A confirmation buy orders[/B] (Red line) are visible just above the round number 0.93000 at 0.93025. We require confirmation of this level because previous price action has warned us deep tests both north and south happen on a regular basis, hence the need to wait for confirmation rather than getting stopped out time after time through lack of patience.[/li][li][B]The pending sell order[/B] (Green line) set just below supply (0.94253-0.94040) at 0.94021 has now been stopped out for a small profit, if managed correctly.[/li][li][B]Pending sell orders[/B] (Green line) are seen at 0.94447, if price manages to get up to this level, active sellers are likely waiting because of how quickly price changed in direction, only pro money have the account size to do this, indicating unfilled sell orders may still be unfilled there.[/li][li][B]No P.A confirmation sell orders [/B](Red line) are seen in the current market environment.[/li][/ul]

Chart 2:

[ul]
[li][B]Areas to watch for buy orders:[/B] P.O: No pending orders are seen with current price action. P.A.C:0.92231 (SL: more than likely will be at 0.91984 TP: Decided if/when price ‘confirms’ the level) 0.93025 (SL: Dependent on where price ‘confirms’ the level TP: Dependent on where price ‘confirms’ the level).[/li][li][B]Areas to watch for sell orders[/B]: P.O: 0.94447 (SL: 0.94667 TP: Dependent on how price action approaches the area). P.A.C: No P.A confirmation sell orders seen in the current market environment.[/li][li][B]Most likely scenario: [/B]Price will likely trade between the highs 0.94613 and the S/D flip area at 0.93729-0.93572 with a break of either area very unlikely seen today.[/li][/ul]

USD/JPY:

[B]Weekly TF.[/B]
It was reported in the last weekly analysis that buyers were in control. Last week, the buyers showed little interest in taking prices any higher, with the sellers remaining in control for most of last week.

Price still remains capped between supply above at 105.441-104.075 and demand below (S/R flip level) at 101.254, with the long-term bias still being seen as long on this timeframe.

[B]Daily TF.[/B]
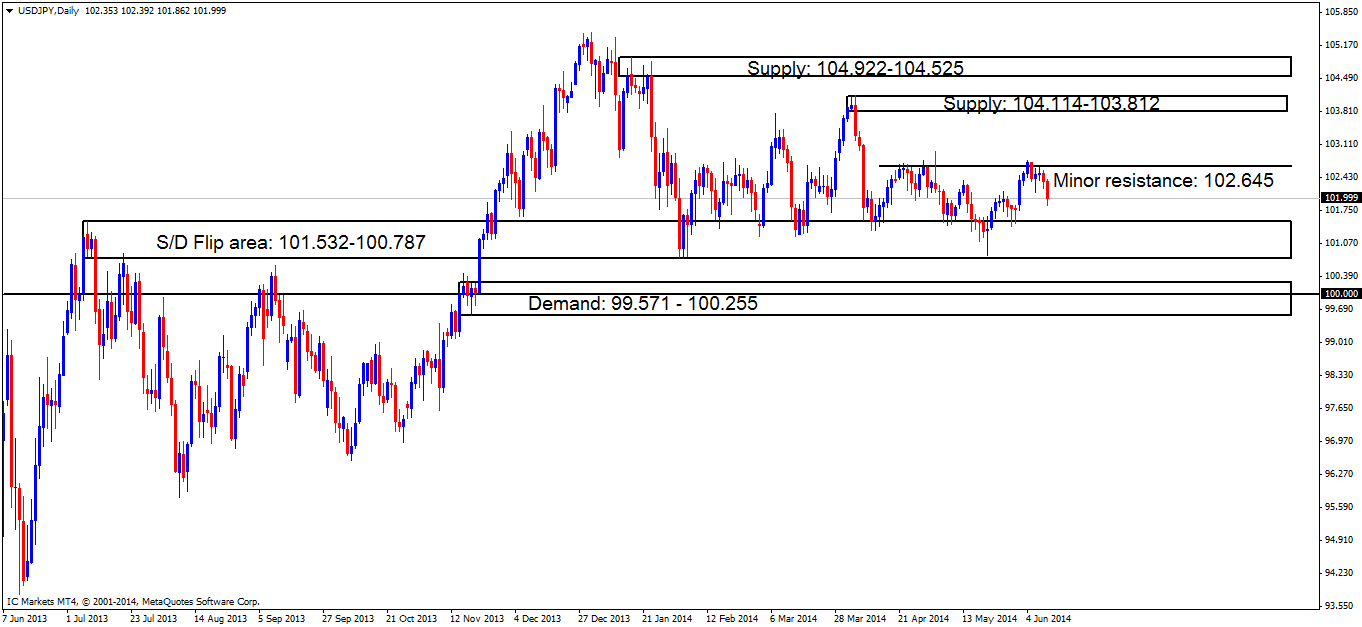
The daily timeframe shows the buyers and sellers appear to be battling it out between minor resistance above at 102.645 and the S/D flip area at 101.532-100.787.

A break below the S/D flip area (levels above) could force price to test demand at 99.571-100.255, this could be a lovely demand area to help facilitate a fakeout of the weekly S/R flip level support on the weekly timeframe at 101.254. A break above daily -timeframe minor resistance at 102.645 may see buyers pushing price all the way up to supply at 104.114-103.812.


[B]4hr TF.[/B]
A sharp drop in price was seen at the end of last week to demand at 101.427-101.660 which triggered our buy pending order set just above at 101.679. Late on Friday, price was seen reacting off of the minor S/R flip level at 102.117 forming a nice-looking bearish pin bar, capping price between demand at 101.427-101.660 and temporary supply at (minor S/R flip level) 102.117. Higher prices are likely to be seen this sometime this week, as indicated by the higher-timeframes being seen in demand, so as always, be on your guard and expect the unexpected!

[ul]
[li][B]Pending buy orders[/B] (Green line) are seen just above demand (101.427-101.660) at 101.679 is now active. The first target has been hit at 102.000.[/li][li][B]No P.A confirmation buy orders[/B] (red line) are seen in the current market environment.[/li][li][B]Pending sell orders[/B] (Green line) are visible at 102.980, deep within supply (103.055-102.742), this area may well appear to be weak now, but the way price reacted at the circled area within supply indicates pro money activity, meaning sell orders may be left unfilled there, so a pending order is permitted.[/li][li][B]Near-term pending sell orders [/B](Green line) are seen at 102.367. A pending order is valid here since this is the area where pro money made the ‘decision’ to take prices lower into demand (101.427-101.660), unfilled sell orders were likely left there in the process.[/li][li][B]No P.A confirmation sell orders[/B] (Red line) are seen in the current market environment.[/li][/ul]

[ul]
[li][B]Areas to watch for buy orders:[/B] P.O: (Active – 1[SUP]st [/SUP]target hit) 101.679 (SL: 101.404 TP: [1] 102.000 [2] 102.367 [but may be subject to change]) P.A.C: No P.A confirmation buy orders seen in the current market environment.[/li][li][B]Areas to watch for sell orders[/B]: P.O: 102.980 (SL: 103.108 TP: 102.117, but may well change if the market sees any new developments) 102.367 (SL: 102.458 TP: Dependent on how price action approaches this area). P.A.C: No P.A confirmation sell orders seen in the current market environment.[/li][li][B]Most likely scenario: [/B]Price will likely decline in a value a little, a push down into demand at 101.427-101.660 for a second test is not out of the question, before higher prices are seen up to at least the 102.367 area.[/li][/ul]

[B]EUR/GBP:[/B]

[B]Weekly TF.[/B]
The weekly timeframe shows the sellers were well and truly in control last week, a magnificent full-bodied candle was formed, trading right into weekly demand at 0.79596-0.80299.


[B]Daily TF.[/B]
The sellers took no prisoners last week, except with a small reaction being seen on this timeframe at demand (0.80348-0.80576) which is now supply.

Friday’s analysis reported higher prices were to be expected, how wrong this was! Price nearly touched demand seen at 0.79282-0.79649 missing it by 8 or 9 pips. This demand area is deep within weekly demand seen above at 0.79596-0.80299, so if a break lower is seen of the daily demand area, things would certainly not be looking good for the buyers as there is very little stopping price from dropping all the way to major support below at 0.77533 (seen on chart 2).

Chart 1:

Chart 2:

[B]4hr TF.[/B]
Chart 1 shows price consumed demand at 0.80053-0.80176 along with the huge round number 0.80000 just below in the process. A pathetic attempt by the buyers was seen at demand (0.79692-0.79777) which is deep within weekly demand at 0.79596-0.80299. This could have been, however, pro money beginning to unload some of their short positions here. A break below this demand area may see price testing demand below at 0.79692-0.79777, only seen when one zooms out on this timeframe.

Chart 1:

[ul]
[li][B]Pending buy orders[/B] (Green line) are seen just above demand (0.80053-0.80176) at 0.80197 has been stopped out.[/li][li][B]The P.A confirmation buy order[/B] (Red line) set just above demand (0.79692-0.79777) at 0.79806is now active. Buyers will need to confirm this area by consuming sellers above at the D/S flip area (0.80053-0.80176); a pending order can then be set at 0.79806 awaiting a likely retracement.[/li][li][B]The Pending sell order[/B] (Green line) set just under fresh supply (0.81751-0.81627) at 0.81612 has been removed since price is too far away from this level at the moment.[/li][li][B]P.A confirmation sell orders[/B] (Red line) under the S/R flip level 0.81403 at 0.81393 is an area where a reaction is likely, however there were too many wicks north seen marked with arrows, indicating sellers are drying up, thus, the need to wait for more confirmation.[/li][li][B]P.A confirmation sell orders [/B](Red line) are seen just under supply (0.80869-0.80771) at 0.80752. Confirmation orders were used here because price is trading around a weekly demand area (0.79596-0.80299), which means price could easily consume this supply level as the higher timeframes usually overrule the lower timeframes.[/li][li][B]New P.A confirmation sell orders [/B](Red line) are seen just below supply (0.80647-0.80583) at 0.80293. Very much like above, price could easily consume this supply level as we are currently deep within a weekly demand area (0.79596-0.80299), which means price could easily consume this supply level as the higher timeframes usually overrule the lower timeframes.[/li][/ul]

[ul]
[/ul]