Hi everyone,
a small recap on Eur/Usd current situation:
Sunday 22-06-014 Valid Analysis
New analysis for EUR/USD — what do you think guys–
Now here EUR/USD consolidation area 1.3508 area so supportive so in case we are not interested in long term buy eur.usd only buying area 1.3599 and short term buy this pair and we are selling start 1.37 level because 1.37 have strong resistance zone. Best of Luck EUR.USD Lover’s.
Trade Idea: Buy 1.35 Level and take profit 1.37 Level
Trade Idea: Selling 1.37 Level
EURUSD is in a very volatile situation and its very difficult to predict, there are chances of some pullback, have to wait and watch.
Following my last Eur/Usd Review
Impulse down is finished and has reached Wave Level of Weekly TF
Pair has now entered to the Mid-Term Flat.
And it is facing a “Moment of True” at the moment.
UP - “New FZR” - and prolongation of Long-Term Trend
Down - FZR - and start a new Long Term Trend down.
A FZR down of h8 Wave Level hapened today (inside the mid-term flat) - This FZR can trigger a FZR down of higher TF (d1)
EUR/USD during the recent Days could descend without reformation and record the Bottom price of 1.34374.Right now price in long term time frames such as monthly and weekly is under 5-day moving average which shows the downtrend. Currently The Price has passed the Up trendline made of 2 bottom prices and with being under 5-day moving average warns about more descending.
As it is obvious in the picture below, there is an AB=CD harmonic pattern between the bottom price of 1.20496 and the top price of 1.39920 with none- ideal ratios of 50 to 127.2 that warns about descending of price from the D point of this pattern.Stoch indicator in monthly and weekly time frames shows the possibility of descending of the price according to the next cycle.Sellers in midterm outlook try to get the supportive level of 1.34000 and for the next stage, the important level of 1.33500 and these two supportive levels are the possible targets of price downfall.
Technical analysis of EUR/USD dated 2014.07.25

… This FZR can trigger a FZR down of higher TF (d1)
As mentioned couple of weeks before - a FZR down of lower TF (can)has triggered a FZR down of higher TF. Which means that we have a “MF Domino Effect” down.
At the moment Eur/Usd has trend down of d1 TF. This trend down will proceed until:
a) an MF-protective-pivot will be created and than broken.
b) Or until a new FZR up happens.
p.s.: I will keep you informed 
Its a good idea for anyone who trades the lower time frames.
EUR accumulated large volume at the 1.3350-1.3390, and this volumes are identical to the volumes at 1.3470 (even little more), therefore EUR will test this level soon. But then downtrend will continue, because volumes at ~1.3620 has not been distributed yet.
It is clear that EUR accumulates volumes at the local lows. If we view the profile of market volume, we can note that area of accumulation 1.3380-1.3400 little more than 1.3600/20. Also concentrated volumes at the lows begin to spark a reaction like rebounds. All this means that the downtrend movement caused by ~1.3600 accumulation is coming to an end, and EUR may get stuck in the current area.
Of cource, I want to see the movement as at the chart, so-called clear provocation. In this case downtrend, indeed, would be considered as finished.
But now… It is also possible that EUR will move to 1.3250, where in 2013 large volume appeared, and it means that the current downtrend will end at this level.
Greetings.
Eur/Usd Weekly analysis:
At the moment Eur/Usd impulse down is still developing. It reached a Weekly Wave Level allready.
MF Pivot 1.3159 is protecting the impulse down. As long as it is not broken - this impulse down will proceed.
For this impulse to stop - price needs to break trough MF protective pivot or MF Trend Line
For Trend to turn around back up - a FZR up of h4 wave level is needed
Update on Eur/Usd situation:
A new protective MF pivot was created (1.2993). Eur/Usd trend down will proceed as long as this pivot is not “broken”
the pair has been under pressure due to which it hasnt made any considerable movement, but still its going to continue in this state.
EUR/USD since 2014.05.08 was in a strong and without reformation downtrend that shows the certainty of the sellers in achieving the predetermined goals. Sellers during this downtrend were successful in achieving the lowest price of 1.24393 that if it breaks, the price will find the potential in reaching to the other important supportive level of 1.24000.
As it is obvious in the picture below between the top price of 1.28866 and the bottom price of 1.24393, there is an ideal AB=CD harmonic pattern with the ratios of 50 and 200 that with completion of the D point (also formation of Hammer pattern in D point), there is a potential for ascending of price. Generally according to the current condition and recent downtrend, until the supportive level of 1.24393 is preserved, price has the potential for ascending and reformation in this currency pair.

The pair has been a bit up and it might make a make a bit upward movement, but there are chances of a pull back.
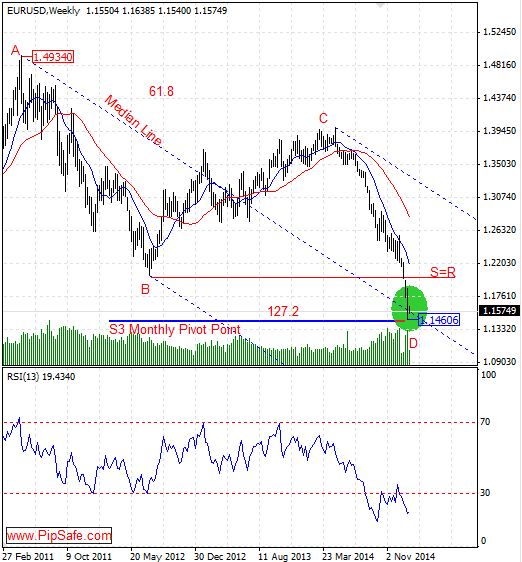
EUR/USD was in a strong and consistent downtrend during the recent weeks that sellers were successful in achieving the lowest price of 1.46406 and According to the recent strong descending , price is in saturation sell area and there is the potential for ascending and price reformation.
Right now price by reaching the Support line of monthly pivot point (S3 MN) and also by creating a Bottom price(Hammer Pattern that need to be confirmed by a bullish candle) in daily time frame has been stopped from more descend.As it is obvious in the picture below, there is AB=CD harmonic pattern between the top price of 1.49340 and the current descend price with ideal ratios of 61.8 and 127.2 that there is a potential for changing price direction from D point of this pattern.
RSI indicator in weekly and daily time frames is in saturation sell area and warns about ascending of price according to the next cycle during the next candles.The first important warning for ascending of the price according to the technical signs is breaking of the resistance level 1.16505.
Today Fomc So I think Eu Go Down .
the eur/usd pair seems to have held a bullish close for last week , its almost like a pivot point , so i would say a daily close above 1.1360 for a buy or below1.1260 for a sell lets see , it should be a good entry for this pair … " pending entry" facebook …
Keep this going! This would be awesome! A lot to learn from this.