Why this trade journal?
I’m new here, and this journal is an experiment for me. I usually keep my trading journey private, but this time, I feel that sharing in a public forum might be therapeutic and help me overcome my biggest struggle—sticking to my trade plan.
I have an edge, but I struggle to execute it consistently because I can’t handle drawdowns. I hesitate before placing my trades, even though I know it’s a numbers game. If I have 2 or 3 losing trades in a row, I go on tilt and blow up my prop firm account. I’ve done it a million times. I know I’m close to succeeding. I know what it takes. I know what I need to change. If only I could stop blowing prop firm accounts. If only I had the discipline to execute my setup every day and do nothing else—I would be a much better trader.
I want to use this journal to document my journey in overcoming my mental roadblocks. Hopefully, this will be the solution that helps me develop the discipline I absolutely need.
What’s my objective with this Journal Experiment?
My goal is to journal for at least 100 trading days. On average, I take 1–4 trades per day—sometimes more, but there are also days when I don’t trade at all. This should give me a solid sample size of around 250 trades.
If I can maintain strong trading discipline for 100 days, I’ll have achieved something that feels like a dream today. Hopefully, by then, I will have built good habits.
What will I write in this journal?
I’ll try to post after my trading session, but I know I might skip a day here and there—life gets busy.
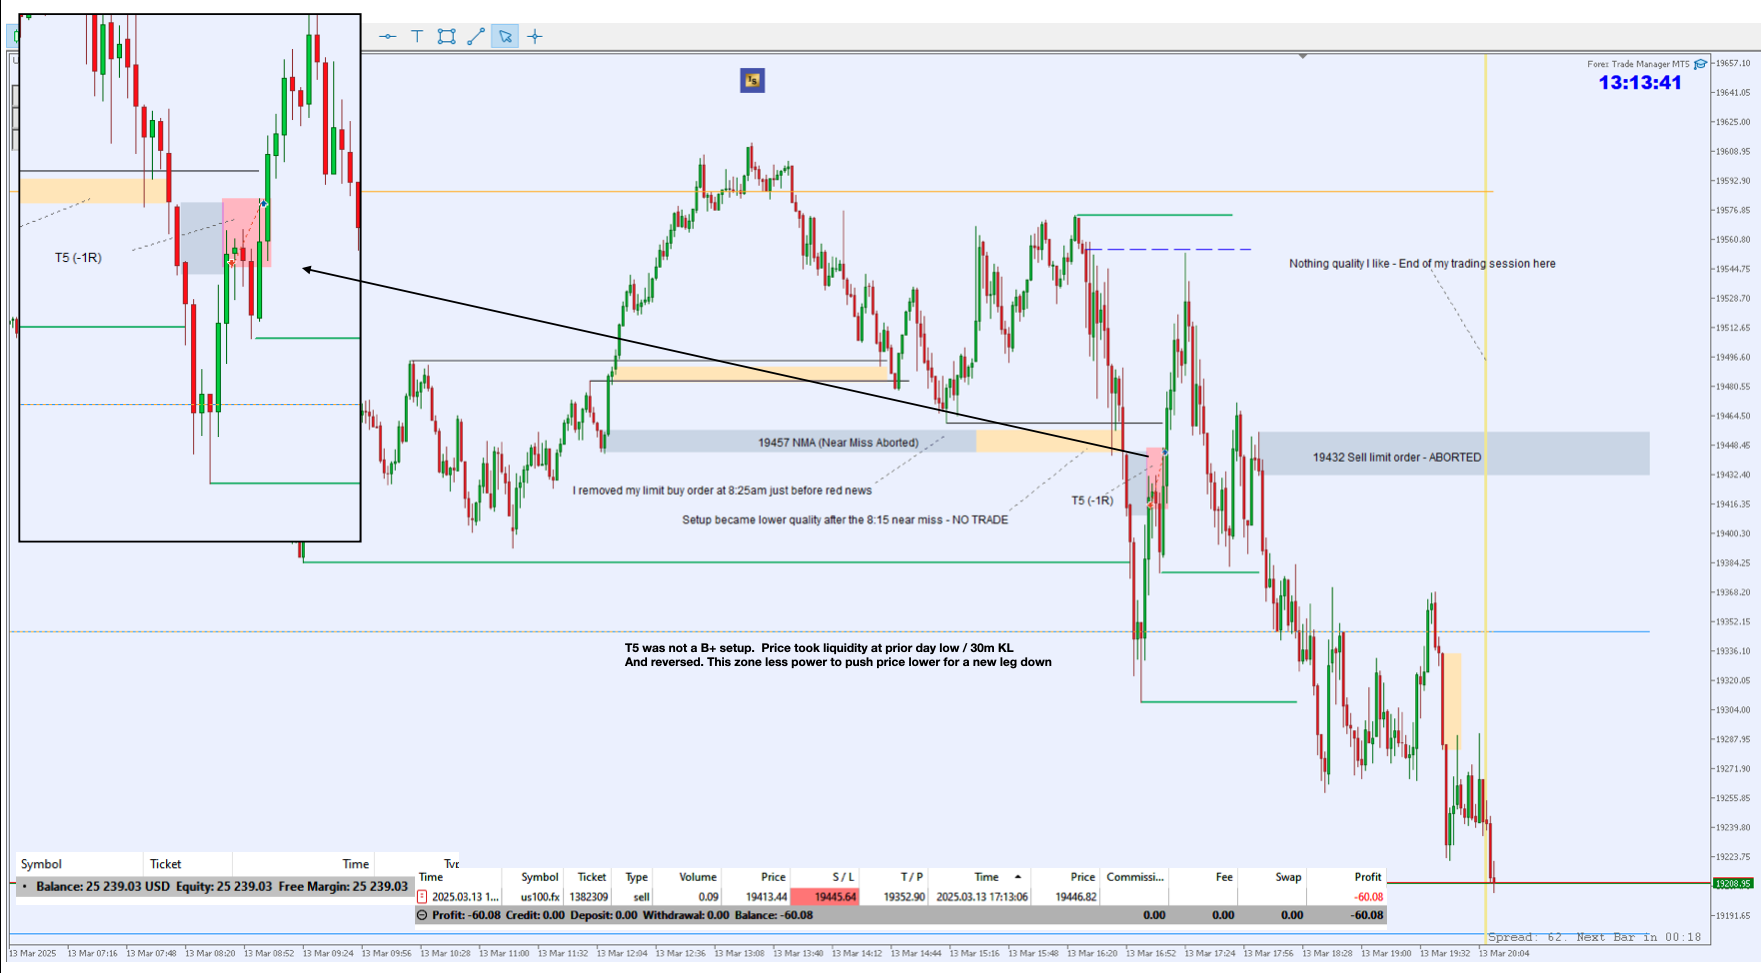
- I’ll post my 2-minute NAS100 chart highlighting my trade executions with notes. (I only trade NAS100 from the 2-minute chart. I also analyze the daily, 240-minute, and 30-minute charts, but I won’t post screenshots of these higher timeframes.)
- After each session, I’ll evaluate my execution and discipline.
- For this experiment, I’m starting with a brand-new $25K prop firm account. I’ll post my daily P&L. This is a 1-step challenge, where I need to reach a 10% profit target.
My goal is to prove discipline and strong trade execution over at least 100 trades. If I succeed, I’ll likely scale up to a larger account.
How to read my charts?
I put most of my trading notes on my charts, alongside my drawings, which help me read price action (I draw on my charts quite a bit). I should probably explain the color codes I use or provide some kind of legend.

My CCCEM Setup in a Nutshell!
Since my goal with this journal is to push myself toward better discipline and execution, I won’t use it as a platform to test or promote my setup publicly. I’ve backtested my strategy on over 1,000 trades and I know it works.
As for my entry and stop-loss placement, I’m confident I can identify the correct location around 95%+ of the time when my setup presents itself. However, I’m still working on finding my optimal trade exit location. After the fact, it’s always easier—and kind of obvious—but in the heat of the moment with live price action, I still need to improve my decision-making process regarding where to place my take-profit.
I also experience a lot of hesitation before placing a trade because I’m afraid of losing money. This second-guessing—“Should I trade this setup or not?”—often runs through my head.
I’ve always traded supply and demand because it resonated with me the most, but I felt something was missing. I wanted a more mechanical strategy/setup, so I developed my own version of supply and demand, which I call CCCEM. It stands for “Controlling Candle that Created the Explosive Move.”
I’ve backtested my setup across various markets—indexes, oil, gold, BTC, FX—and on several timeframes. I found the best results with NAS100 on the 2-minute chart. What I’m looking for is essentially the strong move away that created the explosive breakout leg and left behind a Fair Value Gap (FVG). I also keep in mind where price is located and where it’s headed on the higher timeframes.
Regarding my risk management, I have a different approach than most traders. I used to risk 1-2% per trade, but whenever I had 2 or 3 losses in a row, I’d revenge trade, go on tilt, and end up blowing the account. I’ve lost so many prop firm accounts because I couldn’t mentally handle drawdowns, so I had to make a change.
Because of this, I recently decided to implement a dynamic risk management system and reduce my risk to 0.2% - 0.5% per trade. If my balance falls below the initial account balance or if I’m in a losing streak, I lower my risk. Conversely, if my balance is well above the initial account balance, I increase my risk.
For this journal experiment and the new $25K account I opened, I’ve set my dynamic risk parameter to a 40-trade buffer. This is very conservative, but that’s okay because I want to focus on the process with this experiment. The max drawdown for this $25K account is 8%. Below is how I risk per trade.
Initial account balance = $25,000
Max account drawdown = $2,000 (8%)
My trade #1 risk = $50 ($2,000 ÷ 40 trade buffer)
Say my balance is at $24,000, my risk would be $25 ($1,000 ÷ 40 trade buffer)
Say my balance is at $26,500, my risk would be $87.50 ($3,500 ÷ 40 trade buffer)
In conclusion, this is a new experience for me, and I’m sure I’ll learn a lot about how to make better use of this forum over the next few months. However, I’d rather jump in quickly and learn along the way than wait any longer. After all, these trading struggles I have need to be fixed ASAP!
I officially started my first trading day for this experiment on Friday, March 7, 2025. I’ll post my first daily journal shortly, and more updates will come later in the week.