“Prices took out resistance at 100.68, the 61.8% Fibonacci expansion, exposing the 76.4% level at 102.31 as the next upside objective. A push beyond that eyes the May 22 high at 103.73. The 100.68 mark has been recast as near-term support.”
Yesterday, I showed that there were signals to go long USD/JPY around 101.00 with at stop around 99.930 and a limit around 103.731:
Using Ilya Spivak’s new analysis, we can look to adjust our stop from below 99.930 to just below 100.68, if the market breaks through the 76.4% fib level of 102.31. That allows us to reduce our downside risk as the trade moves in our favor.
The FOMC minutes will be released today at 18:00 GMT/14:00 EDT. Currency analyst David Song has highlighted some potential price targets for EUR/USD in his article on DailyFX.com:
[B]“Although we’re seeing the EURUSD hold above the April low (1.2743), a more upbeat FOMC Minutes may spur a more meaningful run at the 23.6% Fibonacci retracement from the 2009 high to the 2010 low around 1.2640-50”[/B]
EUR/USD is currently trading just above the trend line shown in blue. We could look to go short on a break below that line around 1.2800, with a stop above the weekly high of 1.28975.
My EUR/USD trade idea from yesterday was stopped out as the US Dollar took a beating after yesterday’s dovish commentary from Bernanke clarifying the Fed’s intentions to taper QE asset purchases. As a result the US stock market is targeting new all-time highs today.
Entering a long position in SPX500 at current levels, it’s possible to set stops below the 0.618 and 0.764 Fib levels at 1,638.9 and 1.657.6 respectively. Profit targets can be set around the all-time highs at 1.687.9 and the 1.272 Fib extension at 1.722.8.
The latest readings from the Speculative Sentiment Index (SSI) on DailyFXplus.com show that the crowd is heavily short SPX500. SSI for SPX500 stands at -4.66 which means 82% of retail traders are short and only 18% of are long. Since SSI is a contrarian indicator, this is a signal that SPX500 could continue to make new highs.
Today, AUD/USD briefly dropped below 0.9000 for the first time since September 2010. It has since rebounded trading around 0.9060, but retail positioning indicates that the Aussie could still fall further.
The latest Speculative Sentiment Index (SSI) reading for AUD/USD stands at 4.73. That means among retail traders there are 4.73 long positions for each short position. This is the most extreme positioning of any major currency pair at this time, and has only gotten more extreme as retail traders are trying to pick a bottom.
Long positions are 14.3% higher than yesterday and 24.9% above levels seen last week. Short positions are 4.6% lower than yesterday and 34.4% below levels seen last week. We use our SSI as a contrarian indicator to price action, and the fact that the majority of traders are long and continuing to buy gives a strong signal that the AUD/USD may continue lower.
Two of the SSI-based trading strategies on DailyFX PLUS recently posted signals to short AUD/USD. The signal from the Momentum2 strategy has already moved enough into profit, that the Action status has changed from “Enter Now” to “Hold”, which means if you’re not in the trade already, it’s too late to enter now.
It’s still possible to enter now manually on the Breakout2 trade signal to go short with stops at 0.9346, 0.9289 and 0.9193 and limits at 0.8949 and 0.8892. DailyFX trading signals are also available as automated strategies at FXCMapps.com
Retail sales rose less than forecast in June (0.4% vs. 0.8% expected), but the latest readings from our Speculative Sentiment Index (SSI) suggest that US stocks might still continue higher. SSI for SPX500 stands at -4.90 which means there are 4.9 short positions for every long position.
We use our SSI as a contrarian indicator to price action, and the fact that the majority of traders are short gives signal that the SPX500 may continue higher. In fact, the trading crowd has grown further net-short since last week.
On Friday, the SSI reading for SPX500 was -4.56. Long positions are 0.4% lower than Friday and 12.2% above levels seen last week. Short positions are 6.8% higher than Friday and 40.6% above levels seen last week. The combination of current sentiment and recent changes gives a further bullish trading bias.
SPX500 is currently within striking distance of the all-time high of 1,687.9 set on May 22nd, and a break above that could target the 1.272 Fibonacci expansion at 1,722.8. Stops can be set below the 0.764 Fib level at 1,657.6.
Jamie Saettele, the senior technical strategist for DailyFX.com, just tweeted about his new trade alert for USD/JPY:
“order to short USDJPY at 99.70. Stop is 100.60. Target half at 99.00. Other half will be trailed but the soft target is 95.40.”
Jamie Saettele mentioned yesterday in the Analyst Picks section of DailyFX.com that he was looking for an opportunity to enter a short position on USD/JPY after the pair seemed to find resistance at the 61.8% retracement level.
More sellers have since come in at the 50% level, and Saettele has now updated his pick with this alert to include his entry, stop and profit targets. To get his updates in real-time you can follow Jamie Saettele on Twitter.
The US dollar was hit across the board as Bernanke’s prepared comments were released this morning for his semiannual testimony at Congress. While European currencies are struggling to rise further from here, the commodity bloc currencies are continuing to show signs of strength.
As you can see from the chart below overlaying the price for the Euro on a 1-minute chart of the AUD/USD price since the release of the Fed minutes after 12:00 GMT.
_
Currency analyst Christopher Vecchio just tweeted about a potential bottom in the AUD/USD downtrend with a broadening wedge shown in his chart below.
To view the complete details for analyzing this chart setup and to continue to get his latest trade ideas, you can follow Christopher Vecchio on Twitter.
Last week, I mentioned that US stocks could possibly be targeting new highs, because our Speculative Sentiment Index (SSI) shows that retail traders are heavily short SPX 500, and this is a contrarian signal to buy.
Today both the S&P and the Dow reached new all time highs at 1687.47 and 15543.21 respectively. The Technical Analyzer on DailyFX PLUS can be used to find key price levels to target when the market is trading at all time highs.
SPX500
The chart above is of SPX500, our CFD for the S&P 500. The Technical Analyzer is targeting 1693, 1696 and 1701 as key levels now that we’re trading at all time highs.
US 30
The chart above is of US30, our CFD for the Dow Jones Industrial Average. The Technical Analyzer is targeting 15460, 15490 and 15560 as key levels now that we’re trading at all time highs.
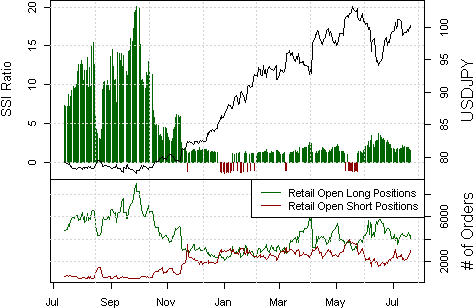
The markets are keeping a close eye on the outcome of Japan’s upper-house elections. The latest polls suggest Shinzo Abe’s LDP party will gain a large majority, allowing the Prime Minister greater scope to push his aggressive program to lift Japan out of deflation. That translates to a weaker yen.
While the latest readings from the Speculative Sentiment Index (SSI) show that forex trading crowds remain long USD/JPY, the positioning has grown far less one-sided since last week. The shift in sentiment actually leaves us bullish USD/JPY and broadly bearish the Yen itself.
If we enter a long position at current levels, we can set a stop below the 61.8% Fib retracement level of the down move since May. Our profit targets can be set around the 76.4% Fib level at 101.383.
The Tidal Shift Strategy (also known as the Momentum2 Strategy in the Classic Trading Signals section of DailyFX PLUS) has just given a signal to buy EUR/USD between 1.31403 and 1.31789 (between the blue dotted lines in the chart below) with a trailing stop at 1.30825 (red dotted line).
Tidal Shift is a trend trading strategy that aims to catch shifts in trend using trader sentiment as an indicator. The signal was issued because our Speculative Sentiment Index (SSI) has hit its most extreme negative level for the past 145 trading hours at -1.7669, which suggests that the EUR/USD could be trending upwards.
The Tidal Shift Strategy can be automated using the Mirror Trader platform. If you have a live FXCM Trading Station account, you can use the same username and password to log into Mirror Trader.
In his article today on DailyFX.com, senior technical strategist Jamie Saettele explains why the latest data from the Commitments of Traders (COT) reports show signs that crude oil could pull back from recent highs. Given this bearish signal, we can look to the Technical Analyzer on DailyFXplus.com for key price levels to go short.
US Oil (WTI Crude) 30-Minute Chart
A short position can be entered at current levels with a stop above 107.20 and profit targets around 105.70 and 104.75.
The kiwi edged has higher against the US dollar as New Zealand reported a better-than-expected June trade surplus. NZD/USD is currently trading above daily pivot at 0.7900 and targeting 0.8050, 0.8100 and 0.8145 headed into the RBNZ rate decision at 21:00 GMT which will be covered as it happens by John Kicklighter in the DailyFX Live Trading Room.
[B]NZD/USD 30-Minute Chart[/B]
Economists surveyed by Bloomberg expect the central bank to maintain the rate at the current 2.50%, but Credit Suisse’s overnight index swaps indicate market expectations for a 40% chance of a rate increase in the next 12 months which could move NZD/USD higher.
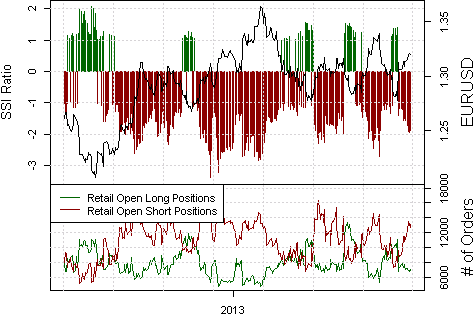
The brown bars in the Speculative Sentiment Index (SSI) graph below show that traders have remained short the Euro against the US Dollar since it crossed above the $1.28 mark. Since SSI is a contrarian indicator, this is a sign that EUR/USD gains can continue.
A long position could be entered on a break above the 76.4% Fib level at 1.32600 shown below (blue dotted line) with a stop set below the 61.8% Fib level at 1.31634 (red dotted line).
The profit target can be set around the high set last month at 1.34161 (green dotted line).
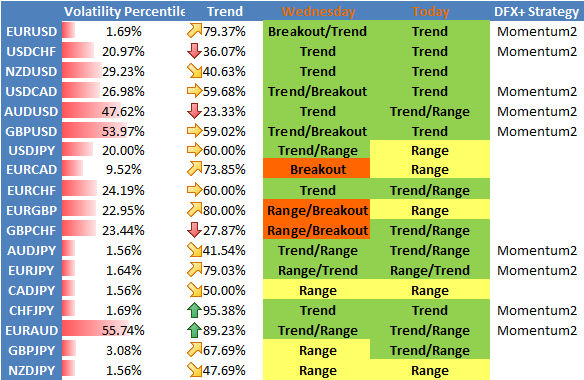
This week has been light on economic data releases. By contrast, the schedule next week is packed full with consumer confidence figures, an FOMC meeting, CPI data, manufacturing numbers and Non-farm Payrolls.
Expect volatility! While past performance is not necessarily indicative of future results, volatile market conditions have traditionally been favorable the sentiment-based strategies on DailyFX PLUS.
[B]DailyFX Individual Currency Pair Conditions and Trading Strategy Bias[/B]
In particular, the Momentum2 strategy has given a signal today to buy AUD/USD between 0.9264 and 0.9312 (blue dotted lines below) with a trailing stop at 0.91922 (red dotted line).
You can automate the Momentum2 strategy on your FXCM account via the Mirror Trader platform where it is known as the Tidal Shift Strategy. The same username and password that you use to log into Trading Station will allow you to access the Mirror Trader platform.
Last week was rather boring in terms of scheduled event risk, but fundamental traders will be more than satisfied with the upcoming slate of data releases.
That spells volatility. One of the currency pairs traditionally favored by volatility lovers is GBP/JPY. Not surprisingly our sentiment-based Momentum2 strategy on DailyFXplus.com has generated a trade signal to start this week.
The signal is to short GBP/JPY with a trailing stop at 152.387.
The Momentum2 strategy can be automated on your FXCM account via the Mirror Trader platform. The same username and password that you use to log into Trading Station can be used to access Mirror Trader.
In his article today about trade setups for commodities, DailyFX strategist Ilya Spivak identified an opportunity to short US Oil (WTI Crude) with recent price action confirming the bearish evening star formation on the candlestick charts last week.
[B]“Prices turned lower as expected. Sellers have now overcome support at 105.06, the 23.6% Fibonacci retracement, exposing the 38.2% level at 102.70. A further push beneath that aims for the 50% Fib at 100.79.”[/B]
The FOMC announcement isn’t until 18:00 GMT today, but DailyFX trading instructor Jeremy Wagner sent out a tweet this morning about the following chart breakout for EUR/USD.
A short position at current levels could target 1.2750 and 1.2250 with a stop around 1.3350. To always get his latest trade ideas, you can follow Jeremy Wagner on Twitter.
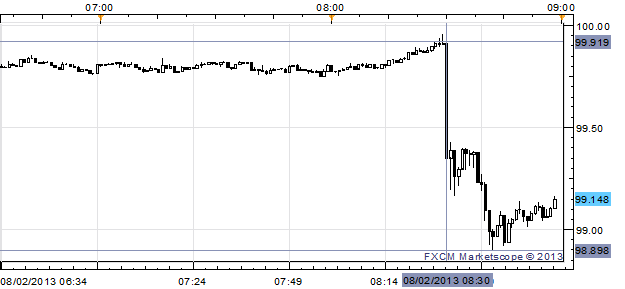
[B][U]THE TAKEAWAY[/U]: US labor market continues to improve only at a modest pace (+150K to +200K), but July report disappoints handily > Participation Rate falls leading to decline in Unemployment Rate > Second US data poor as well > September QE3 taper in question > USD/JPY BEARISH[/B]
[B]USD/JPY 1-minute Chart: August 2, 2013[/B]
There is an opportunity to enter a short position in USD/JPY if the pair continues below 98.756 (blue dotted line) which is the 50% retracement level of the downtrend since May.
The stop could be set above the resistance that has been established since the NFP announcement today around 99.50 (red dotted line).
The profit target can be set around the 38.2% fib level at 97.582 (green dotted line).
To start the new trading week, senior technical strategist Jamie Saettele tweeted about his latest trade idea to short GBP/USD. As you can see from his chart below, the pair is currently trading near the top of a descending trend line.
GBP/USD 4-Hour Chart
A short trade entered at current levels could target 1.52495 and then 1.50265 with a stop above 1.53862. Too keep up to date with his latest trade ideas, you can follow Jamie Saettele on Twitter.
[I]As expected, the Reserve Bank of Australia cut their target interest rate from 2.75% down to 2.50%. However, the RBA did not repeat its message from July, which was that inflation provided scope for further easing. This implies a possible end to rate cuts for the time being and is bullish for the Australian dollar.[/I]
Looking at the DailyFX trading signals, we see that the Momentum2 Strategy has just given a signal to buy AUD/USD. The signal was issued because our Speculative Sentiment Index has hit its most extreme negative level for the past 145 trading hours at 2.0759, which suggests that the AUD/USD could be trending upwards.
The strategy recommends entering this trade at any price between 0.89648 and 0.90084 (blue dotted lines in the chart above). A trailing stop has been set at 0.88995 (red dotted line).
[B]You can automate the Momentum2 strategy on your FXCM account via the Mirror Trader platform where it is known as the Tidal Shift Strategy. The same username and password that you use to log into Trading Station will allow you to access the Mirror Trader platform.[/B]