The DailyFX education team just tweeted about this chart setup for USD/CAD. The pair found bearish divergence with the slow stochastic oscillator as price just retraced 50% of the prior move.
An short position entered at current levels could target 1.0300 with a stop at 1.0450. To keep up to date with all their latest trade ideas you can follow the DailyFX education team on Twitter.
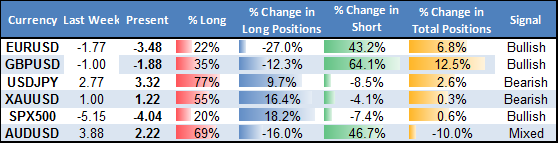
The latest weekly update of the Speculative Sentiment Index (SSI) has just been posted on DailyFX.com and they show that traders have never been more long the US dollar. For example, the SSI reading for EUR/USD is -3.48 meaning that there are 3.48 short positions for every 1 long position.
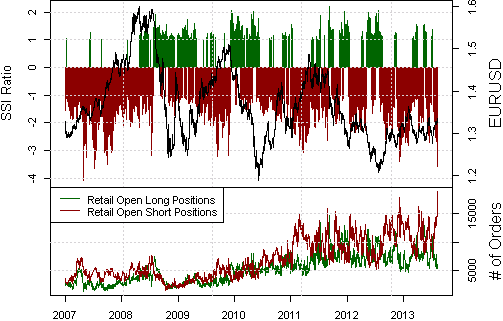
This combined with record open positions in the pair mean that retail traders have never before been this short the Euro against the US dollar. Notice below how EUR/USD tends to rise when SSI is negative (brown bars) and tends to fall when SSI is positive (green bars).
SSI is a contrarian indicator, which means the fact that crowds are heavily short the pair is a bullish signal that the pair could rise higher. With this in mind, we can look to the Technical Analyzer on DailyFXplus.com to get key levels to enter a long position.
The Technical Analyzer says a long position could be entered at current levels with stops below 1.3325 profit targets around 1.3415, 1.3450 and 1.3490.
If you were long on the GBP/USD pair yesterday you would be laughing all the way. I closed my positions early yesterday as I am funny enough down with a cold in the middle of summer heat.
Even today I will try to spend as little as possible in front of the PC as I am not feeling that great.
But there are some interesting movements to be expected, so keep sharp.
The Euro for today: The bias remains bullish
The Dax for today: Consolidation.
Gold intraday: Further upside.
GBP/USD – for today: The upside prevails.
UK100: Intraday: Caution.
The last trade idea I posted from the DailyFX education team has since reached its profit target locking in over 100 pips. Today, trade instructor James Stanley has tweeted about a new chart setup to short AUD/JPY.
Stochastics are overbought, which indicate the long term downtrend in the pair could resume. An entry order to short AUD/JPY can be placed at 87.75 with a stop loss at 89.25 and a profit target at 85.00. To keep up to date with all his latest trade ideas you can follow James Stanley on Twitter.
The Tidal Shift Strategy on DailyFXplus.com has just given a signal to buy USD/JPY. The signal was issued because our Speculative Sentiment Index (SSI) has hit its most extreme negative level for the past 145 trading hours which suggests that the USDJPY could be trending upwards.
The system recommends entering this trade at any price between 97.874 and 98.31 with a trailing stop set at 97.22. You can automate the Tidal Shift Strategy on your FXCM account by logging into Mirror Trader with the same username and password you use to access Trading Station.
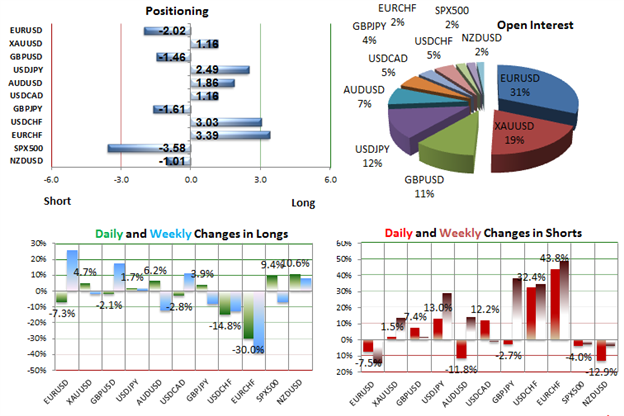
In the graphs below, you can see that the latest Speculative Sentiment Index (SSI) reading for EUR/USD is -2.02 indicating that there are 2.02 short positions for every 1 long position in the pair. Taken by itself, this is a bullish signal, but notice the weekly change in net positioning.
Long positions are 25.5% above levels seen last week. Short positions are 14.5% below levels seen last week. That means overall the short positioning in EUR/USD has decreased dramatically. This is a bearish indicator for the pair, since SSI is a contrarian indicator.
It’s no surprise then that the SSI-based Momentum2 strategy on DailyFX PLUS is giving a signal to sell EUR/USD at current levels with a trailing stop at 1.3324. DailyFX trading signals such as Momentum2 are available as automated strategies at FXCMapps.com
The latest weekly update of our Speculative Sentiment Index (SSI) has just been posted on DailyFX.com
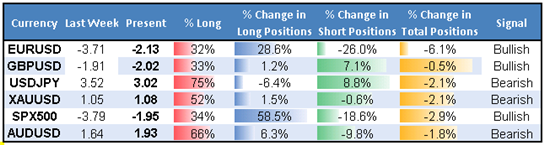
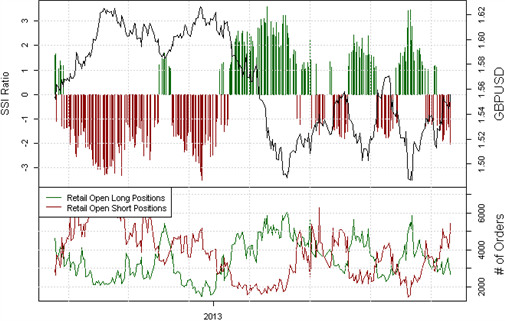
Focusing on GBP/USD, we can see that both the absolute net positioning and the recent change in net positioning are giving a bearish signal for the pair.
The SSI value for GBP/USD is -2.02 which means there are 2.02 short positions for every 1 long positions. That’s a relative increase in net short positioning from -1.93 last week.
Understandably both the Breakout2 strategy and the Momentum2 strategy on DailyFXplus.com have recently given signals to buy GBP/USD. Both of these trading signals are available as automated strategies at FXCMapps.com
The DailyFX education team just tweeted their latest chart setup. USD/JPY is in a falling channel as MACD is giving a selling signal. Price channels can also help with stop placement.
A short position can be entered at current levels with a stop at 98.75 and a profit target at 95.25. To always get their latest trade ideas, you can follow the DailyFX education team on Twitter.
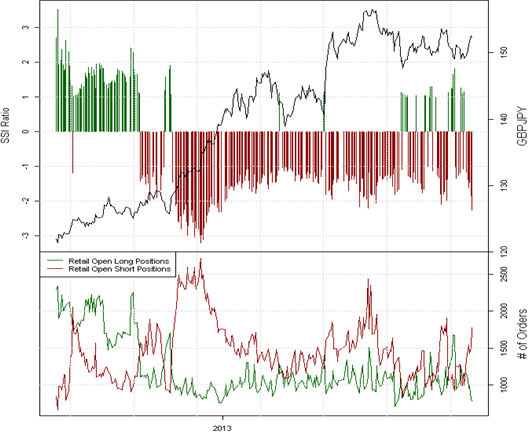
The British Pound has been a top performer in August while the Japanese Yen has struggled – even as global equity markets have come under pressure. The latest readings from the Speculative Sentiment Index (SSI) show retail traders have been increasing their short exposure to GBP/JPY.
The lengthening brown bars in the graph above show that SSI has continued to become more negative as GBP/JPY has risen. Since SSI is a contrarian indicator, this is a sign that the recent bull run may continue.
If a long position in GBP/JPY is entered at current levels, the stop loss could be set below the pivot level at 152.50 (red dotted line) as indicated by the Technical Analyzer, and the profit target could be set around the high set back in May at 156.776 (green dotted line).
Going into today’s FOMC release, the British Pound has emerged as an unlikely top performer and perhaps safe haven du jour as few developed economies have seen the resiliency the UK economy has since May.
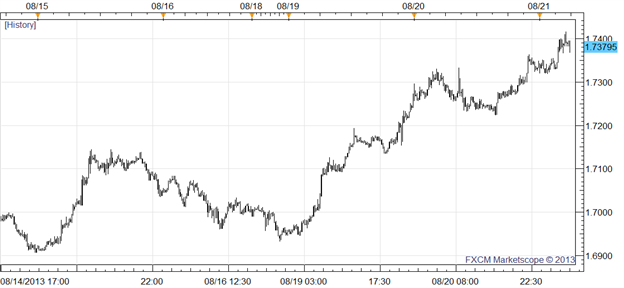
[B]GBP/AUD 15-min Chart: August 14 to 21, 2013[/B]
That could maybe present an opportunity to buy GBP/AUD at current levels. A stop could be set below the 76.4% retracement level to the earlier high of 1.73415 set back on August 7th which has since been broken. A profit target could be set around the 161.8% extension level at 1.75753.
Thanks! Your last signal made me a few pips so I am trying out this signal as well. I am relatively new at forex but have taken some hits off of a few signals posted on this site.
Nice job! If you’ve already exited, that means you used a different profit target. That signal was a Jason Rogers original, but you obviously adapted the information to suit your own trading which is great. I would never suggest following any signals blindly, even the ones I post here. Try to check the signals against your own analysis, or the analysis you read elsewhere.
You asked how I came up with this particular signal. I read Christopher Vecchio’s article this morning on DailyFX.com that said the British Pound has been performing well lately, particularly against the commodity dollars, and how this was related to turmoil in emerging markets. I then read another article that he referenced with more information about emerging markets. I liked the fundamental analysis he presented, so I pulled up a chart of GBP/AUD to see if I could identify a possible entry point for a long position.
The trend channel is one of the simpler technical analysis tools you can use, but it is also one of my favorites. If you have not already, I would encourage to visit the On-Demand Video Course section of DailyFXplus.com. That way you can learn more about the different technical indicators and find your own favorites. That will give you more tools to adapt the trading ideas of others to suit your unique trading style.
To be honest with you I take 30 pips on most operations to keep it safe since I am new to forex. I will look into the items you spoke of on fxcm as I have yet to see them. I appreciate your help!
GBP/USD has been a currency pair on my radar because of the topping action occurring on the daily chart. Just a little while ago, the DailyFX PLUS Tidal Shift Strategy issued a bearish signal for GBP/USD based on a shift in SSI positioning. Here’s a look at the chart including the entry zone and the stop loss levels.