
Let’s see which side of the tunnel the price pops out of.
Let’s see which side of the tunnel the price pops out of.

At this moment, price need to have a breakout soon either to the upper trendline or lower trendline of the teal triangle. Althought its look like more preferable to have a breakout to the lower trendline due to the factor that the upper trendline already showed as a strong resistance line since last week, but still, its have a possibility to have a breakout to the upper trendline first before another bearish continuation trend.
Expecting to see a strong downside movement later within this week with condition alternate count in white is not valid. Therefore, please monitor a signal from BSTS to assist you to determine which trend is more preferable and when is to make a good entry. Good luck.
I enjoy your daily analysis of this pair, jebatfx and am even gradually beginning to see through the labyrinth that is your chart to recognize the patterns within 
Thanks for sharing. 
Great analysis, teaches me alot.
If now I only knew what BSTS was all would be great?
He teaches workshops in Kuala Lampur and the BSTS is some sort of proprietary system. I don’t know what the initials stand for. You can check his website by clicking on his name.
ok, thanks:)
So sorry I can’t update my forecast yesterday due to uploading problem at imageshack. Hereby I upload again the previous updated forecast for yesterday evening together with recent forecast. Sorry for the inconvinience.
[B][U]Yesterday 9.12 pm[/U][/B]

Until this moment, I still believed for a bearish continuation scenario and most probably, subwave ii in the making and this scenario would still valid due to my retracement critical line still intact. But please study the alternate count in white and this scenario is valid if my retracement critical line is taken. Good luck.

At this moment, price already break again the major red lower trendlines which is indicate bias towards bearish trend. Perhaps, there will be another minor wave in subwave for downtrend senario later. But please don’t forget about the possibility for the alternate count in white. Please noted that the alt white count would be invalid if the price break point 202.60 later.
Please refer from BSTS for any bearish continuation signal and at this moment, make sure to adjust your SL and check your TP. Good luck.

At this moment, price just bounce back and stop at my pivot line. If the new upper green trendline can stay as a strong resistance, we shall see another bearish continuation trend. I believed it just perform a corrective phase before another bearish continuation trend unless otherwise if there is any strong upwards movement to break the 204.70 later then we might consider to the alt count in white. Please be extra carefull since the chart getting more complicated and showing mix signal. Good luck.
do you know when the gbp/jpy will stop ranging?
it’s been doing that for almost 3 weeks now 

It will stop ranging once it breaks out 
I attached my fib plotting indicator.
TRO_FIBS.zip (7.32 KB)

I’m looking forward for a breakout to the 202.60 soon today. Please noted that alt count in white would be invalid if this happen and I need to recount again for this scenario. I’m looking forward for a strong downwards breakout to the bearish continuaton critical line 3 later today or tomorrow. Otherwise we may see a bullish movement either as a bullish retracement or bullish reversal (if the retracement critical line is taken). Good luck.
Previous updated forecast due to uploading problem at imageshack. Hereby I upload again the previous updated forecast together with recent forecast. Sorry for the inconvinience.
Yesterday 7.21 pm

Until this moment, 202.60 still hold as a strong support and after a few attempt of test, it still stay intact. Therefore I came out with new case scenario which is represent of diagonal triangle corrective subwave of A B C D & E for completion of wave 4 (magenta/yellow). A triple top pattern would bolster this new scenario (if valid).
Please noted that this new scenario would be invalid if the price make a breakout to my retracement critical line and if this happen, maybe we shall see an alternate white count scenario. So please be carefull before making any entry. Please study BSTS TF 4H, Daily and Weekly chart before making any conclusion. Good luck.

A breakout to my retracement critical point indicated that my previous alt count in yellow/magenta already became invalid and preferable for whitw count (please refer from previous chart). Therefore I need to do a recount as stated in the updated chart. Therefore please study this alternate scenario and look a signal from BSTS for a bearish retracement wave iv before another bullish continuation to complete wave v. Good luck.

Simple works, too!

I hope I don’t have to program more pivot s/r levels…lol

Price below current price more times than not.

At this moment, I divided market in 3 possible scenario’s which is :
Therefore please study all this new scenario’s including the new retracement critical line, and look for any good signal from BSTS for respectives scenario. Please make an analysis to the BSTS Daily and Weekly chart before making any entry.
Tips - look for any bullish continuation signal and later a bearish reversal signal from BSTS.

More bars closed below than above… going down?
At this moment, I believed market already in retracement phase to complete wave iv before another bullish continuation to complete wave v. Unless we see a breakout to the retracement critical line, preferably wave iv (yellow/white) already completed. Otherwise we may consider an alt count in magenta.
But according to the technical analysis at BSTS daily and weekly chart, it not showing a good signal for a strong bullish trend which therefore please be carefull for any “bullish trap” scenario. So, advisable to wait an entry for a bearish reversal trend instead of bullish continuation. And also, please consider that wave v maybe only a truncated wave. Good luck and happy weekends.

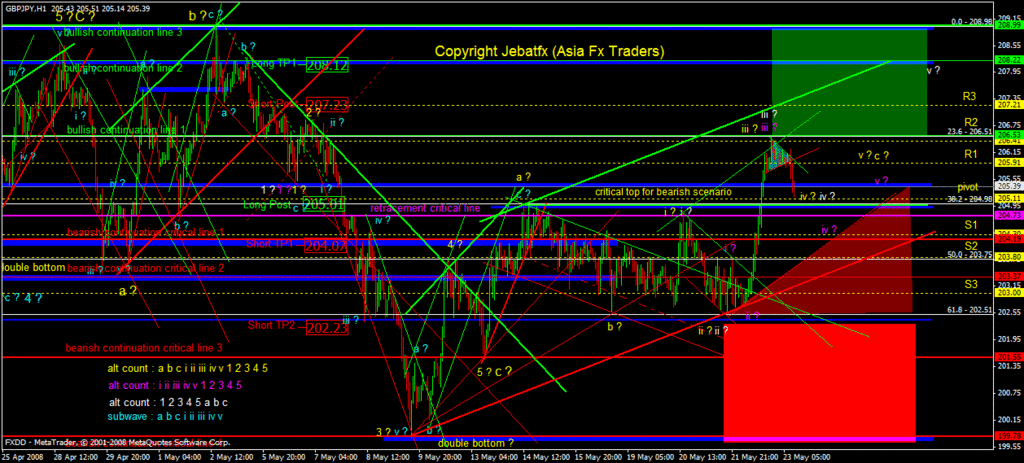
Is there any commentary for the chart below?
For instance, what do all those large numbers mean?