EURUSD – BACK IN THE WEDGE
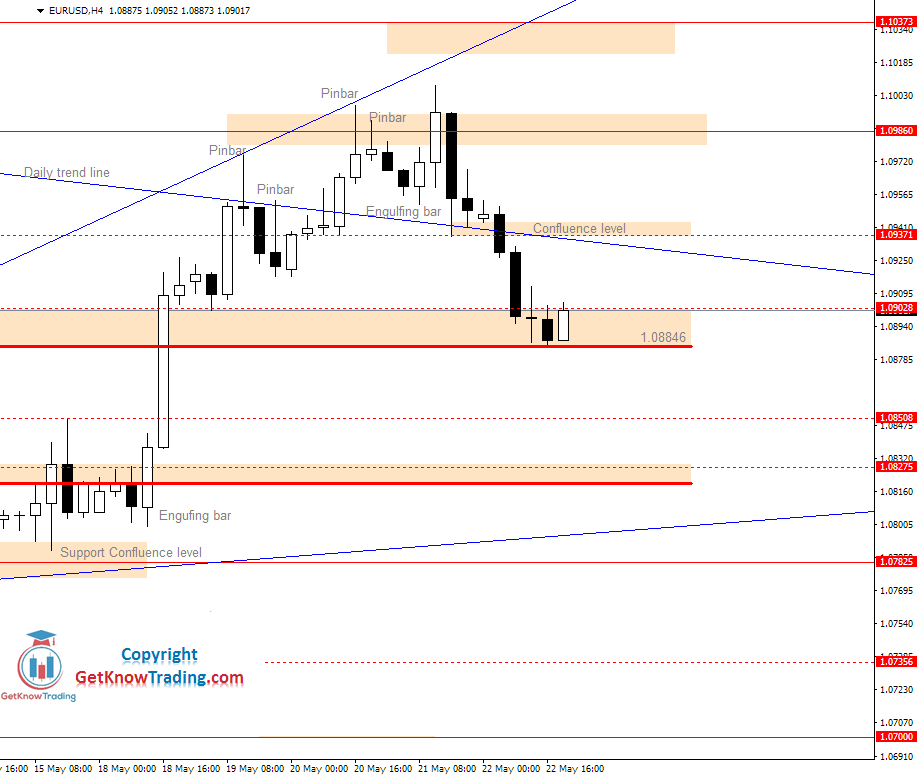
Price is back in the wedge pattern and it is on the support level. H4 chart closing price tells us that the price is gone down enough to make a test move back in the previous range area .
This could happen if price reverse back to the previous confluence level at 1.09371 and from there make a bearish price action signal .
On the daily chart we can see that the price have closed below previous bearish candle lows which suggest that the price could go more down.
Because of long price drop we could see pullback before trying moving more down.
1 Like
Nice analysis! Thanks for sharing!
1 Like
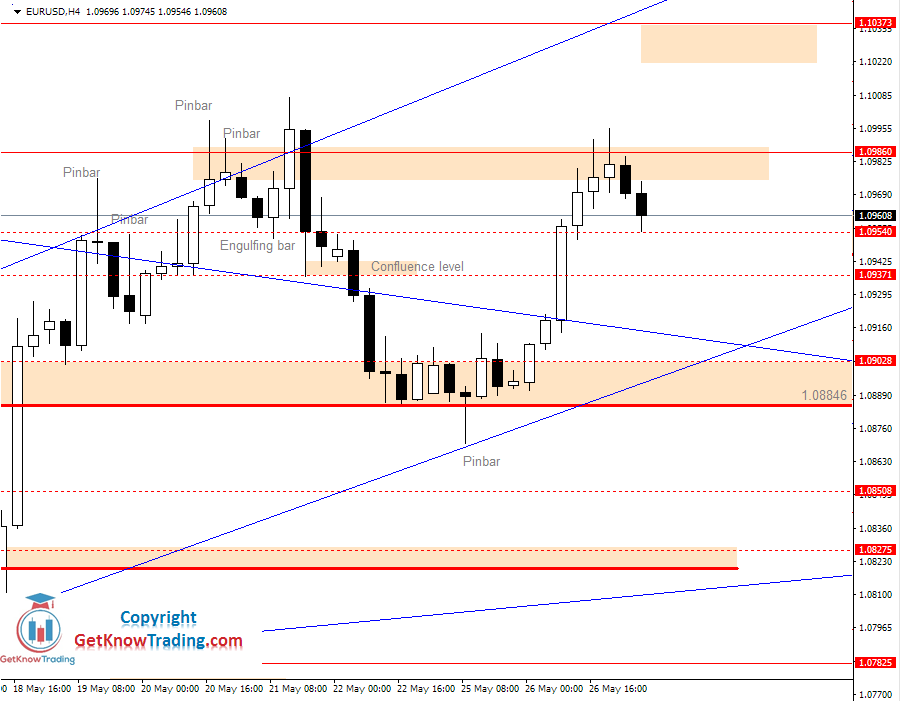
Current H4 candle have managed to close above previous H4 candles close. Close is above resistance level, 1.09028 and it happened just after small H4 indecision candle.
This could mean we have possible break out from the small range where consolidation is. While daily trend line is just above we could see a little harder way up for the buyers.
1 Like
We have now price bounced from the resistance line at 1.09860 where candles look like the bulls have much more strength.
Bounce has been realized with small bear candles which does not give to much confidence in the bear strength. That is why we should watch for the bullish price action signal.
Today we will see will the price make a pullback to 1.09860 level which now is acting as a support level. Price could make a pullback before trying to break above 1.10373 level.
Today is Friday and it is a day when I do not want to trade to much.
From this point price have a chance reaching next resistance level at 1.11091 if bulls can find strength.
There is also a chance we see price pulling back to the support level 1.10373 if the bulls move out from the market.
Bullish Pinbar that has appeared on the pullback after breaking channel trend line tells us that the price could find its way up.
Pinbar in this case acts as a confirmation of a break out, where the price could continue further up. In this case it is best to wait for the next candle to form and show us the current strength of the bulls.
From this points where the price is right now we should wait for bulls if they can manage to break weekly trend line reach resistance at 1.11871. If the can do that we could see price making pullback to weekly trend line and moving further up to 1.12321 level.
Bears have more job to do to regain the strength they had in previous weeks. Their first strong support is at 1.10755 level which must be broken before attacking support at 1.09860.
We need to wait for clear signal and as a first signal would be breaking out from this small range area.
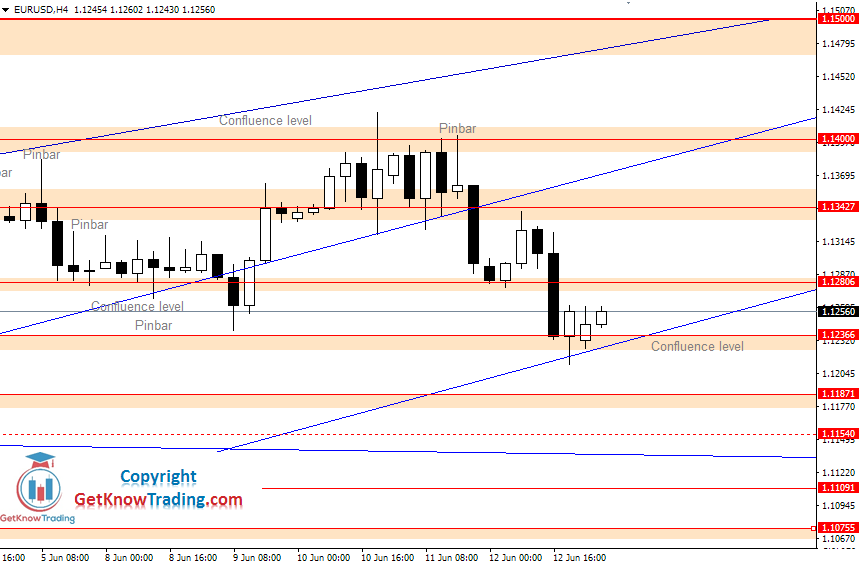
Price currently looks very bullish even it is right on the confluence level. If the price does not break out more up we could see moving sideways and trying reaching 1.12366 level which was strong resistance in the past.
Bulls are controlling the market for now. There are no bear strength that could mess their goal from pushing price higher.
Strong bullish candles over smaller bearish shows us that we could see price more higher. The next resistance is at 1.12806. Current bearish Pinbar could make a small pullback to 1.11871 level where it could find support for further move up.
We now have again small bearish Pinbar suggesting we could see price pulling back down to the first support level at 1.12086.
Yesterday we had small bearish Pinbar that pushed the price back slightly before moving up. Today could be the same case.
Today is Friday that could cause price moving more down to 1.12366. Friday is the day when traders like to get out from the market and prevent possible loss over the weekend. Doing that, they are protecting profit earned through week.

EURUSD Outlook
The price have stopped on the strong support level and on the uptrend line support. This level could hold the price for a while. As it looks like we have large Pinbar on the weekly W1 time frame suggesting move down.
GBPUSD Outlook
While the price have stopped on the strong support level at $1.24733 we see a pullback. Pullback have done its way to the first small resistance at $1.25356. We see the price moving higher and making bearish price action signal.
USDJPY Outlook
While we are strongly in bearish sentiment that has started last week we should look for sell opportunities.
Strong H4 bearish Pinbar is a nice signal so we could wait for small pullback from 107.00 level. If the price manage to close below 106.00 level we could see further drop down to 105.55.

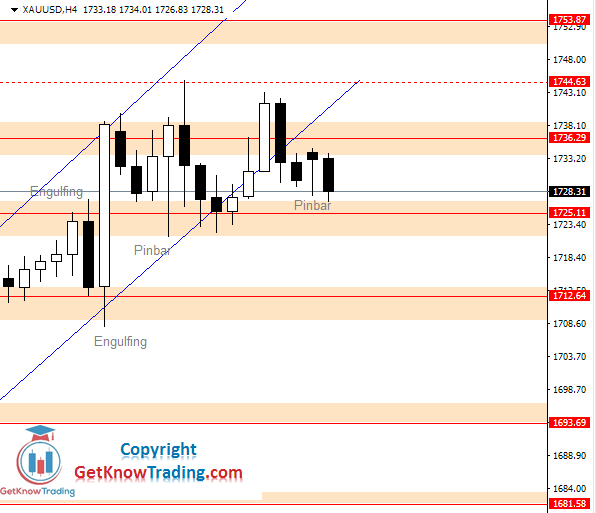
XAUUSD Outlook
The price have stopped in the indecision area and it has gone out from the uptrend channel. This is signal that the have lost its momentum and it will need strong buyer push to get back inside channel and to continue moving up.
EURUSD Outlook
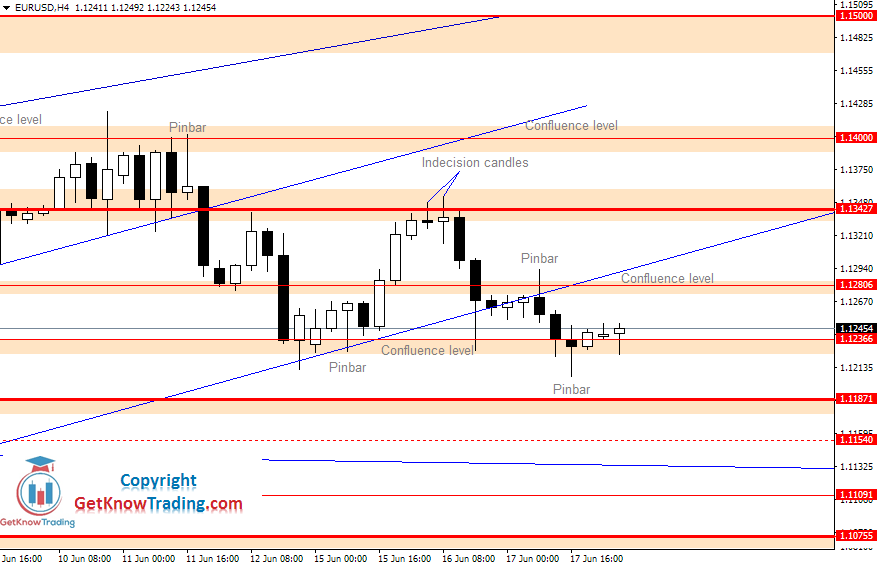
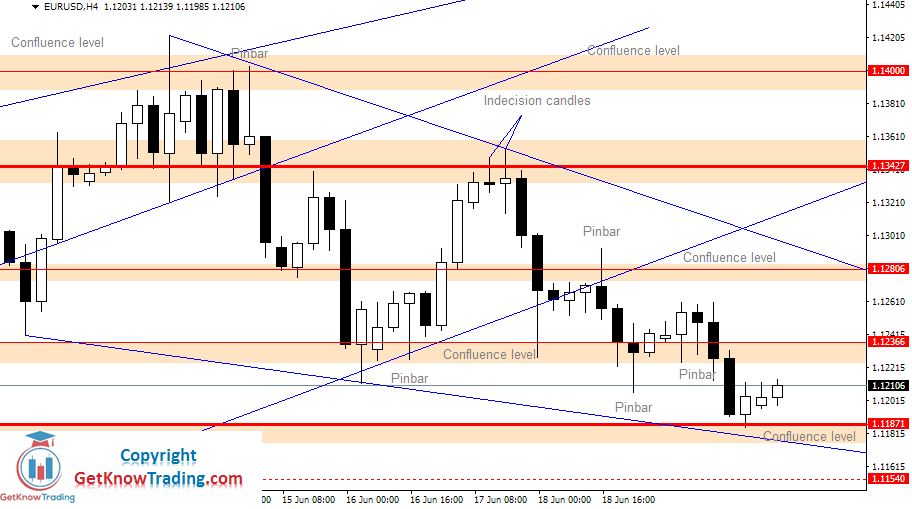
From the indecision candles that have formed after large bearish candle that brought the price down to $1.12366, we had a bearish Pinbar right on the strong resistance level, $1.12806.
The Pinbar pushed the price down to support level at $1.12366, and for now the price is waiting. We have another indecision candles, but now we have bullish Pinbar on the support level and one important thing is that we have break down through uptrend channel.
Yesterday I have said that I am bullish, but I am not convinced. For now, the statement I am not convinced holds because we had a bearish Pinbar that pushed the price down. Now we have indecision candles right on the support level.
1 Like
EURUSD Outlook
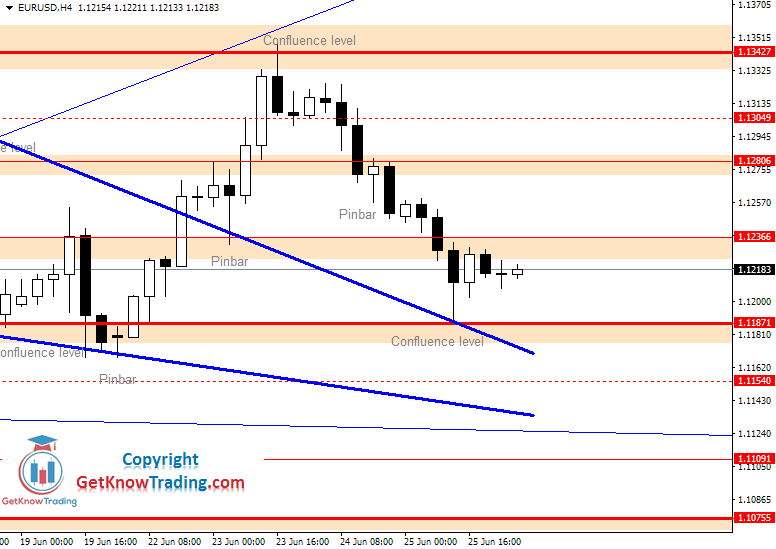
EURUSD has fall down to $1.11871 support and it did not make a move to the upper side. The two H4 Pinbar’s on the support level at $1.12366 did not hold the price and could not push the price to the resistance line at $1.12806.
The price have move down to a strong support at $1.11871 which was holding price on the upper side. This level acted as resistance and when we have said if the price close above we will have bullish scenario.
Now this level is acting as a support and until the price is above, we should look for bullish entries.
EURUSD Outlook
EURUSD Yesterday’s chart analysis
On the yesterday’s analysis I have pointed that we could see pullback to $1.12366. The price did right that and returned back to support at $1.11871.
When the price touched $1.12366, it bounced back strongly with only one bearish candle that engulfed five previous bullish candles.
This tells me that the bears are strong at that level and the bulls will need a lot of power to break that resistance.
Looking on the the daily time frame I can see bearish Pinbar.
Looking on the weekly time frame I can see bearish Pinbar(weekly Pinbar is not perfect Pinbar).
1 Like
EURUSD Outlook
If you have received my yesterday’s analysis as a G-Trader member, then you have seen that the EURUSD pair have done what was predicted.
The price have made small bullish Pinbar on the strong support at $1.11871 and breakout from the falling wedge pattern. Another point that was clearly stated is that we should wait Monday for the clear signal where the market could go.
Breakout below wedge pattern would confirm head and shoulders pattern, but it did not materialize. The price did what wedge pattern was pointing on.
The price breakout above and continued moving up.
EURUSD Yesterday’s chart analysis
EURUSD after the breakout from the wedge pattern reached first strong resistance at $1.13427. Yesterday’s two strong bullish candles have drive the price very fast to the resistance level which indicates strong bullish momentum after the breakout.
$1.13427 level is now confluence level of uptrend resistance line and horizontal resistance line.
When the price reached the confluence level it pulled back to the first small support at $1.13049.
The confluence level is a strong resistance area which has stopped the price on June 16 and on June 5. Each time the price have pulled back so it was possible that the price do the same thing. For now, the price have pulled back, but very little. Only to the first small support at $1.13049.
If you read closely then you can translate this behavior as a bullish power that do not allow the price to make a strong pullback.
EURUSD Outlook
After the yesterday’s analysis, EURUSD has made retrace to $1.12806.
On that support level we had a bullish Pinbar that was indicating the price could move further up. But, the price did not move up and instead it moved down.
Two strong bearish candles have move the price below $1.12806 level and currently is very near second support level at $1.12366.
In the previous day’s this support level was holding price above, so we can expect it will do the same.
It is also the level at which the price have breakout from the wedge pattern.
EURUSD Yesterday’s chart analysis
EURUSD has fallen down to its strongest support level in this range area. We have a range area that consists of the area between $1.11871 and $1.13427. I was waiting to see if the price came back to the support level at $1.11871 which is the second time in a week’s time frame.
We now have a range area that was touched two times on the resistance, $1.13427, and two times on the support, $1.11871. The price is holding between these two levels.
The wedge pattern that was broken did not fulfill its full potential and push the price above $1.13427. Sellers were too strong on the resistance level and currently there is a fight between bulls and bears.