EURUSD Outlook
EURUSD yesterday did not do anything clear that would guide us in some way. Looking at the daily time frame we can see indecision candle. It means the price did not find its way in any direction.
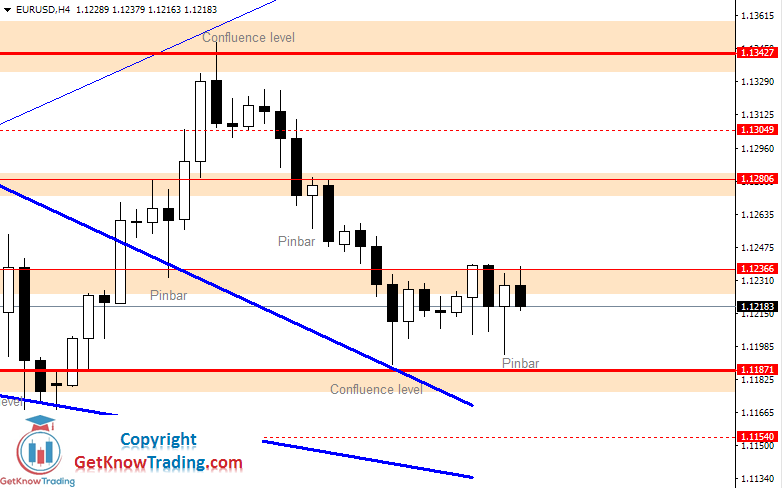
In the H4 time frame we can see the price has done some bouncing between two levels as mentioned in the yesterday’s analysis.
Large wicks on the candles where we have one bullish Pinbar candle tells us that the current area around $1.11871 is filled with buyers that are defending the support area.
These daily chart analyses really help me a lot to understand the market status. This is how I am very much able to keep the track of everything that has been happening in the market so that I can make a move accordingly in the market and acquire some good profits.
1 Like
EURUSD did not do too much yesterday except going up and then going down where it started from.
The one thing the price has done is close above $1.12366 which is now an important support level.
Strong bearish candle that took the price from the $1.12806 could not close below the previous H4 candle close, but it shows there are sellers who will not allow the price to move up easily.
The area where the sellers are is a strong resistance level.
EURUSD Outlook
Yesterday’s analysis was pretty close to the scenario that happened on the market.
EURUSD has tested the support level around $1.11871.
After testing the support level a nice bullish Pinbar has formed that pushed the price back to the resistance level at $1.12366 and where the price has stalled for the last few days.
After the bullish Pinbar we have a strong bullish candle that has engulfed the previous range of small H4 candles.
That move suggests the price could go higher if the price manages to close above $1.12366.
EURUSD has managed to break above from the small indecision area that was mentioned in yesterday’s analysis.
After a few indecision candles the price have fallen down to support level at $1.11871. The price formed a nice bullish Pinbar that had a long wick and a body inside an indecision area.
This formation of a Pinbar shows the behaviour of the market. The price has looked to break somewhere. The break was heading down, but the majority of traders did not allow the price to close below the indecision area. The close was again inside that area which pointed to the price having a false break down.
After the bullish Pinbar the price moved up and closed above indecision and touched an area near resistance level at $1.12806.
After the break above and the strong bullish candle we have a small pullback visible as a small bearish candle. After that, a small indecision candle has formed.
Currently we are waiting for the price to make a move.
EURUSD Outlook
The price has returned back in the indecision area where we need to wait again to see what the price will do.
Last 24h EURUSD pair has done a test of the channel downtrend resistance line and horizontal resistance line. The area where those two resistance lines are crossing is confluence level.
That level has held the price from moving up. The confluence level had many sellers pushing down the price with two large bearish candles.
The formation of candles in the last two days looks like there is a fight between bulls and bears.
Friday did not offer too many movements and the price stayed where it was at the beginning of the day. The price did not break below the confluence level to test the previous strong support level at $1.11871.
Confluence level of support consists of horizontal support and channel trendline. The price has squeezed and did not close below which was a sign it will be hard to break below.
The start of the week has formed a breakout from the indecision area near the support confluence level.
EURUSD has broken out from the wedge pattern and from the downtrend channel.
The price has risen up to the strong resistance level at $1.13427 which is the resistance level that price is trying to break since June 16.
This is the third time the price is trying to break out further up, but for the third time the price is pulling back.
This time the pullback is a small pullback. Only to the first small support at $1.13409.
If I take a look on the candle formation, I can see that there is no strong bearish signal.
Bullish candles are taking over and the price could move further up.
EURUSD has broken out from the indecision area that I have mentioned in yesterday’s analysis.
The break out took the price down to the first support area at $1.12806.
Strong bearish candle has formed after the few indecision candles. That strong bearish candle stopped at the support channel line.
This was a retest of the channel trend line after it was broken.
If we see a nice bullish price action signal here we could see the price heading up.
The H1 time frame shows few bullish Pinbar which is a sign of bullish strength.
Few candles on H4 time frame could not close below the large bearish candle which means there is no strength to push the price down.
The price has been making indecision candles in the area where several candles did not manage to close above or below which would open direction for the future movement.
From yesterday’s analysis it took two more candles to break out, in this case break above, where one large bullish candle took the price all the way to resistance at $1.13427.
If you move to H1 time frame you will see there are many small bullish Pinbar’s that pointed that the price could move up.
That area where the price was filled with buyers preparing for the move.
And when the move happened, the price moved very fast and very high.
Now, the price has stopped on the resistance level and is looking for further move up.
Yesterday was a day when we had a breakout from the uptrend channel. As was said in yesterday’s analysis and in the email I have sent to G-Traders, if the price breaks out we need to wait for the pullback and retest of the uptrend channel resistance line that is acting as a support.
Second line was a horizontal resistance line at $1.13427 which is strong resistance and that could make a hard way to break above.
The price broke out and made a pullback, but the breakout was a false breakout. This trap took many buy orders and activated stop loss where the price returned back in the channel.
The price has returned inside the range area I have talked about in June. That range area expands from $1,11871 up to $1.13427.
The price still does not have a clean direction even after breaking above the resistance line. As we can see the Friday has offered us only a reversal back into the range area.
A false breakout from the uptrend channel and above resistance line was short lasting. After two H4 trading sessions we had a price returning back to the channel.
Strong bearish candle took the price down to the indecision area which we had at the start of the week. That strong candle has lost its power and following three H4 candles showed us that we will see some change.
That change appeared as a strong bullish candles. First strong bullish candle that pushed the price from the indecision area and second two candles pushed the price up. That push up was with the last bullish strength so the price pulled back.
The price reached $1.13427 and even higher than that. The push was from the traders who entered into the market yesterday.
Only one bearish candle was seen yesterday and it was engulfing bar.
While the engulfing bar formed in the middle of the uptrend channel I did not put too much focus on it.
As you can see it was a false bearish engulfing signal without any backup.
Close to uptrend resistance, the price pushed strongly up through the resistance line which gives me an explanation that the buyer’s strength is strong on this level. We could see the price moving higher after this breakout.
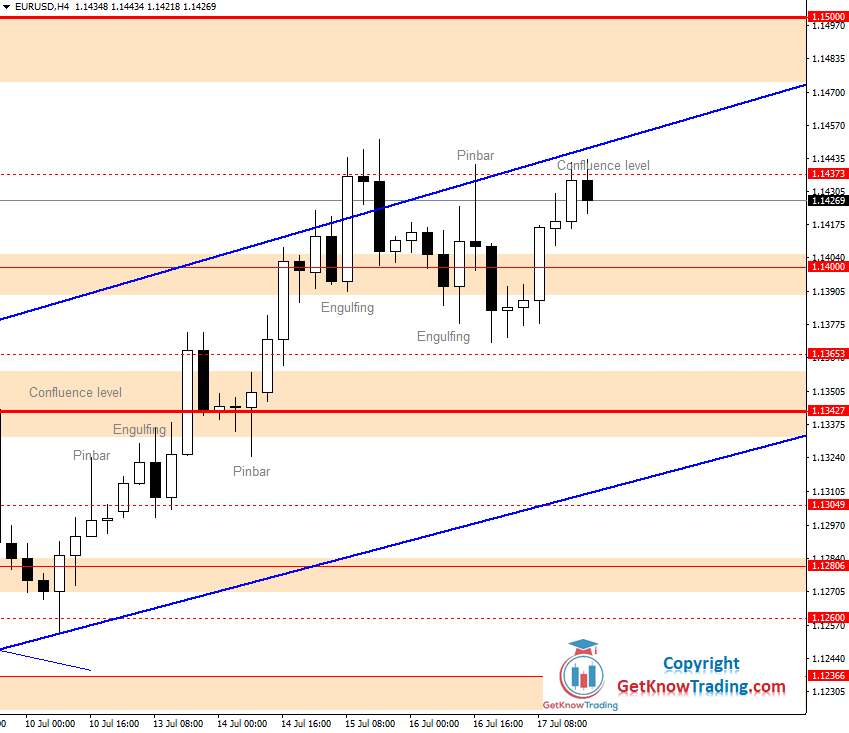
EURUSD has managed to make its way above $1.13427. It has reached a $1.14000 level that was waited for a long time. It has been more than a month since last time when the price was at this level.
After breaking above resistance level at $1.13427 the price pulled back and made a retest of that level. The level acted as a support and the price formed bullish Pinbar. This scenario I have pointed yesterday in my analysis.
The Pinbar was a confirmation of a support level and we could enter at this level. Who entered the trading setup I have sent over email to G-Traders, they have taken the profit.
The price reached $1.14000 very fast after the bullish Pinbar. It took only two bullish candles which shows us that we have strong bullish momentum. The Uptrend channel is broken so we need to find another guideline where the price will move.
The price reached new highs on yesterday’s trading session when the London and New York trading sessions were active.
New high at $1.1451 is reached, but the price did not stay too long.
At that price we can see indecision candle which is broken with strong bearish candle.
The indecision candle is on the uptrend channel breakout and the market has decided to bring the price back inside the channel.
The price has stopped at the previous resistance at $1.14000 which is now support.
Will it hold the price until buyers step in and sellers step out? We should wait and see.
The price reacted on yesterday’s trading session when the London and New York trading sessions were active.
Yesterday’s analysis predicted that we could see bearish movements because of the candle formation. If you did not read the analysis you can do it on in this link: Analysis 16 July.
The price reached the first support level at $1.13700 which is close to $1.13653 which is drawn as a horizontal line.
Before reaching that level the price has returned back to uptrend resistance at $1.14373 which is now confluence level. We have horizontal resistance line and uptrend resistance line.
From there the price was pushed back down with strong bearish Pinbar which tells me we have strong sellers there.
The price reacted on yesterday’s trading session when the London session was active. The price has moved higher to the previous high. The previous high is the $1.14373 level which is high on Thursday and Wednesday trading day.
That level was reached at the same time on each day. That is when the London and New York trading session are active. Yesterday the price stopped at that level and a small bearish candle formed which lasted until the market closed.
What we can see on the chart yesterday is that we have a bullish end of the week.
Saturday’s analysis had several good points that were predicted correctly.
The price pulled back on Monday open and the area near $1.14000 was reached. After that the price had another run to the uptrend resistance line.
Confluence of resistance lines at $1.14373 was too hard for the price to break above, so the price pulled back again to the $1.14000 area. From there we can see the price formed strong bullish candle.
That was a sign that bearish candle has found buyers at it will not break below $1.14000.
If we take a look at the H1 time frame we can see that there is a nice bullish Pinbar that indicates the price will move up.
It was a nice entry signal with very low risk.
That bullish candle is holding buyers above $1.14373 and it is ground for new small bullish candles that are making new highs near the uptrend resistance line.
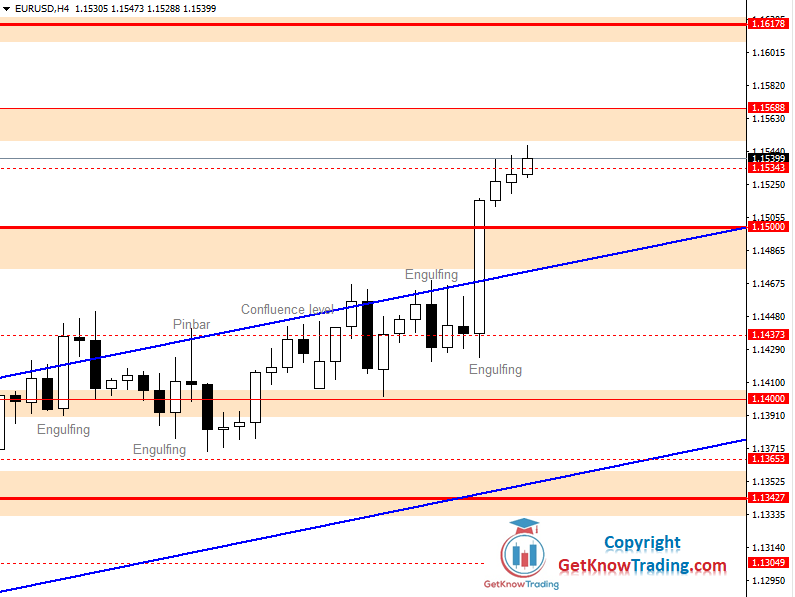
Bears were not active on the market yesterday and the price managed to reach a long waiting $1.15000 level. On the yesterday morning the market was preparing for a move.
We can see a bearish candle that has formed on the uptrend resistance line and push the price down to $1.14373.
From there on the H1 time frame we can see a bullish engulfing bar that was the start of the bullish run.
After that bullish candle we have a large H4 bullish candle that has a close above $1.15000. While there is no pullback to $1.15000 after a long bullish candle we see that the market favors bulls.
The price has made a new high. A $1.16000 level was reached.
Yesterday market behaviour shows us that we had a small pullback to the area near $1.15000 and from there we had a strong bullish candle. That bullish move drove the price to $1.16000 level where the price found a resistance.
This scenario with the pullback I have announced in G-Trader email news.
The bullish candle move was during the London trading session when the European traders were active.
After reaching new highs the price pulled back to the first support level at $1.15688.