Last two weeks were pretty bad for the Euro currency because the price has fallen down to low levels which we have not seen since April 2020
The current scenario does not look good for buyers because the price has support only next to $1.17200.
$1.17000 is an area of support where weekly trend line and horizontal support are crossing so I am expecting that the price will stop there.
The price closed the week above $1.19000 which means the next resistance is at $1.20000.
For the next week I am expecting the price around $1.20000 and then I will see what will happen.
Market does not look so strong to go beyond $1.20000, but it looks more likely to find resistance and then fall down to $1.19000.
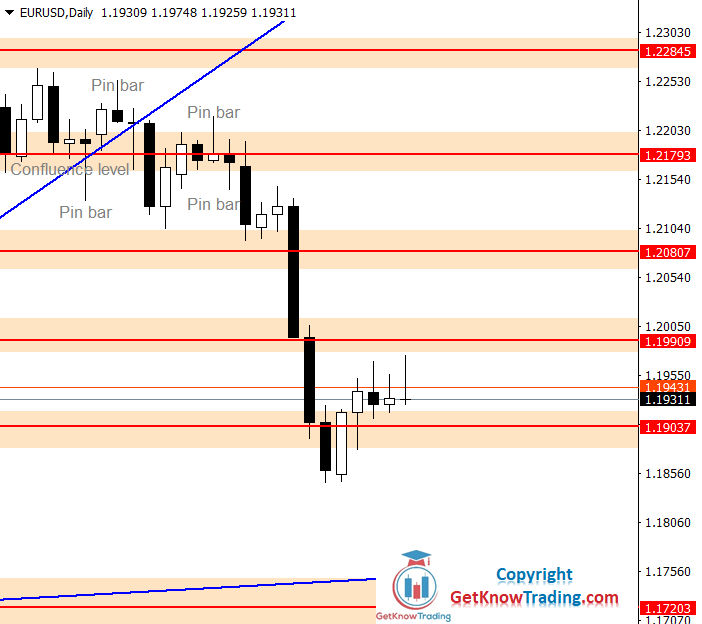
The week started with a small bullish Pin bar, but the formation of the Pin bar was not at the right place to give significant meaning.
That is why the market continued to fall down on the following days.
Currently because of the bullish Pin bar we could see the price moving higher up to $1.19000 and then going back down to $1.17000.
The week ended with the price above the weekly starting price which was around $1.18600.
The current price is $1.18729 which means bulls have made to close the week above open price.
The bullish Pin bar from last week was not so strong indication of bulls, but this week’s engulfing candle shows me more bull’s strength.
The price reached a weekly up trend line and found support.
It reversed back on Wednesday, but the following two days were bearish.
If the price forms a bullish engulfing or Pin bar around $1.17200 it will be the sign of a bullish move which could be the start of a bullish trend.
If the $1.17200 does not hold then $1.16180 is the next target.
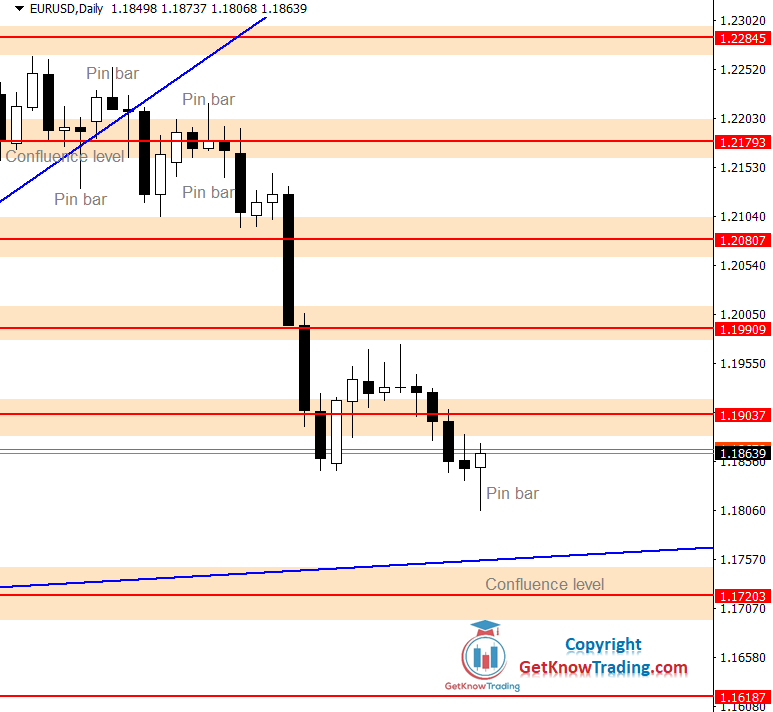
The price managed to close below previous week low and this is the second week in a row the price closed the week lower.
The whole week was moving slowly down where four of five days were bearish.
Strong confluence of support is losing the battle and we could see the price next week close to $1.17000.
The weekly overview is pointing out that $1.16180 is very close and it is stronger than $1.17000 so I am gonna pay attention on that level.
The week behind has shown bears breakout below previous day candles lows which led the price to $1.17200 support level.
$1.18000 is a round number which acted as a resistance for the price and now the market looks like it has tested the resistance before the next move down.
As a first step for the price to move down and to confirm the $1.16187 as the next target is to close below $1.17200.
The price has reversed from the weekly up trend line and closed below $1.17200 support level I was mentioning last week.
$1.17200 was a breakpoint for the sellers and now it is resistance for buyers.
Start of the week could have a small test of the $1.17200 before moving further down to $1.16187 which now is the next target.
The price nearly reached $1.17200 two days in a row by retracing back, but it could not stay there for too long.
Same day the price moved higher and closed the day higher than the previous day.
$1.18500 is a confluence of resistance where the sellers could find more strength to push the price back down.
The current market overview shows the $1.17200 as a support that needs to be broken in order to see the price moving down.
On Friday there was a slight pullback from $1.19000 which is a result of buyers exiting from the trades at the end of the week and reaching round level which is known strong resistance.
As it was mentioned in the previous weekly analysis the $1.19000 is a breakpoint for the buyers.
That means we could see price fluctuating around $1.19000 and first strong support below.
From the week beginning the price has changed direction and moved down.
The price is again in the downtrend channel which suggests further move down.
The price could break below $1.18000 and then pullback to $1.18000 to confirm break down before heading down to $1.17200.
On Monday the pair broke down from the confluence of support, but the day ended almost on the price the day started.
The price stopped on the strong support $1.17200 which is well known in the last few weeks.
From this level the price reversed back up on 20.08.2021. so we could see some price confluence here.
But, most likely the price is heading down, below $1.17200 towards $1.16180 which is now a strong confluence of support.
The market did not move too far from the price it started the week which shows indecision in the market.
What we see here on the chart is the price having a hard time to break below $1.17200 which is not nothing strange.
Similar scenario was on 19.08.2021.
When the price broke below support level and returned quickly back above $1.17200.
The whole week was bearish and only Friday was a small bullish candle.
Bears have overtaken the market and for the last three weeks they are dominating.
I am currently outside of the market until I see a better market constellation.
I am waiting for the price to reach $1.17200 for a bearish move with a price action signal or $1.14748 for bullish move.
After breaking below $1.16187 in the previous week, the price made a small pullback to $1.16187.
That pullback was in the form of a small bullish candle which did not close above.
Bullish move could happen on the $1.14748 level which is a strong support.
At that level the sellers could get out from the market and allow the price to make a pullback up.
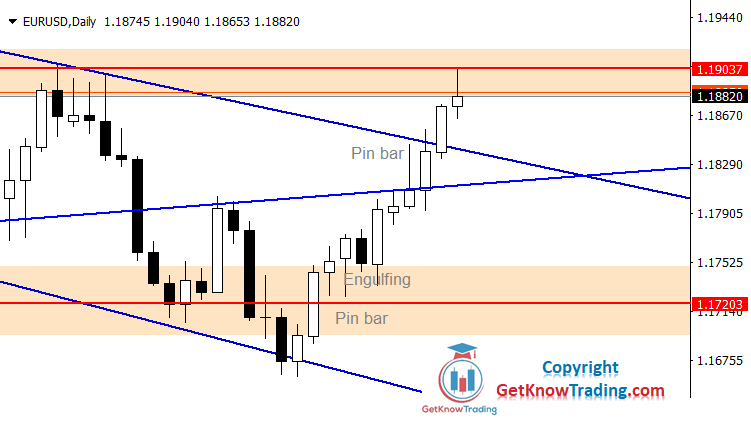
The small support at $1.15462 was strong enough to stop the price from falling down to $1.14748 which is strong support for the price.
The market formed a bullish engulfing candle which shows bulls strength around $1.15462.
The price is now between two levels which showed strong pressure, $1.15462 with bulls and $1.16187 with bears pushing the price in the opposite direction.
The candles formed from Tuesday to Friday you can see on the chart are all bullish and close price is above this level.
That means the bulls are strong enough to hold the price above.
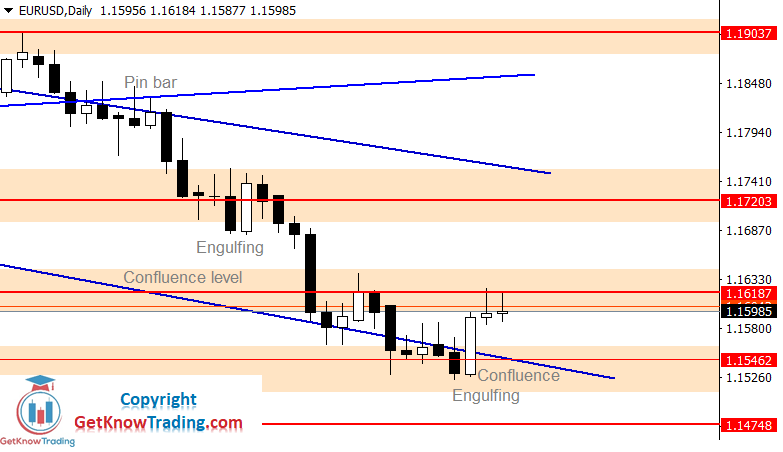
The currency pair is in the downtrend so being bullish completely is not an option.
For now the price will find resistance on the old resistance at $1.17200 which will now be a confluence of support combined with downtrend channel resistance.
In the last two weeks the price has returned back close to $1.17200 resistance and formed a strong bearish candle.
The price dropped down to $1.15462 which is current support where the price is holding.
If the price breaks above $1.16187 it will be just a first step to see the price changing to a bullish mode.
Only when the price breaks above $1.17200 then it will be the sign of the bulls.
After a bullish Pin bar the price returned back close to $1.16187 and from there turned back down and reached $1.14748.
The week ended below $1.14748 which tells me that the support is not strong here.
The first support is around $1.14000 which was support for the price in the past.
The price could stop for a while and make a retrace back to $1.14748 before finding more sellers to continue with the push down.
The price has reached the previous analysis goal and that is $1.13094 support level.
As said last week the $1.13000 is a strong support where the price could bounce back to $1.14000.
The price has moved outside of the downtrend channel and stopped for a while on the $1.13000 level.
If the next Monday closes below current price then $1.11871 is the next stop for the price.
https://youtu.be/Wjw4AiwaL98