The price has made a new high. A $1.16178 level was reached.
Yesterday market behaviour shows us that we had a small pullback to the area near $1.15343 and from there we had a strong bullish candle. That bullish move drove the price to $1.16178 level where the price found a resistance.
This scenario with the pullback to $1.15500 I have announced in G-Trader email news.
The bullish candle move was during the London and New York trading session when the European and U.S. traders were active.
After reaching new highs the price made a small pullback, but it returned to $1.16178.

Yesterday the price managed to break above the $1.16178 level that was holding the price for almost a day.
When the U.S. trading session started the price found buyers support and closed above strong resistance level.
There were several candles that could not push the price down or up, but at the end of the day there was enough strength to go up. That strength was not as strong as the bullish candle from the previous day.
Yesterday candle formation tells me there were less buyers or there were more sellers than on the previous day.

The price could not make a move higher in the last two H4 trading sessions. That means bears have found some strength and buyers are losing strength.
A support where the price could stop from falling is around $1.16739. I am not anymore bullish oriented as I was in the last few days.
Current level is a strong level and we have a monthly resistance line from the wedge pattern I have talked about in the last analysis.
This strong resistance could stop the price from moving higher, at least easily moving. We could see a pullback from this current level to the first minor support. Later on we will see what the price tells. Will it continue to move down or it will find support and look for new highs around $1.18500.
A candle formation that has formed on the chart consist of a few bullish Pinbar and small candles that do not point anywhere, at least for a strong further move.
Relatively large bearish engulfing bar was not overtaken by bulls which tells me that there could be some problem for the bulls.
For a further move up bulls will need to find more support and more strength to push the price higher. They need to close above $1.17700 on the H4 time frame with strong bullish candles to confirm move up.
Strong support is around $1.16178 level and I am more inclined to see the price at that level or around that level before further move up.

Yesterday the price found more buying strength to move up and close above $1.17700.
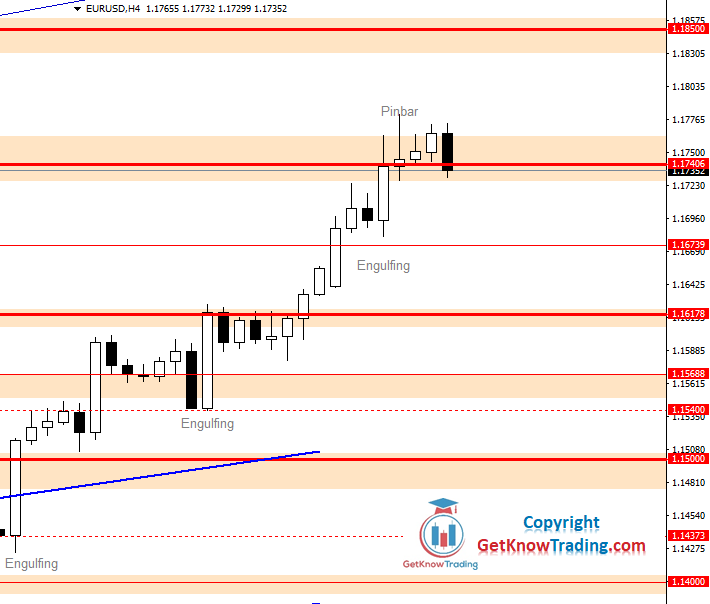
We have a steep uptrend channel that is driving the price up. Since yesterday’s analysis the price has formed few bullish candles.
One bullish candle has formed right on the confluence level and could not close above $1.17700. Second candle was a bullish Pinbar that formed after making a pullback on $1.17406.
That was a sign for further bullish moves and it was a nice entry point with profit around $1.18000.
Following few bullish candles have taken the price above $1.17700 and for now the price is holding on those levels.

The price made a pullback to previous resistance level at $1.17406 that is now acting as a support. Few small bearish candles had formed and it looked like the price was moving outside from the uptrend channel.
The price only made a small pullback as a false breakout.
As was mentioned yesterday in G-Trader newsletter the price returned to $1.17406 where a nice bullish engulfing candle has formed. It was noted that the entry point should be around that level with a nice price action signal.
The price found the ground and moved up and the move is active at this moment. There were no bearish candles or any bearish signal that could point stopping the price from reaching new highs.

EURUSD is in the range between $1.1725 and $1.19030 for several days. The price has reached a strong resistance level at $1.19000 and buyers did not have enough strength to make new highs.
Current market formation looks bearish. Many bearish candles have overtaken the market. The bearish strength is visible through several bearish black engulfing candles.
Buyers are holding at $1.17000 level, but it looks like there will be a break down very soon. Lower highs on the H4 time frame shows barish power.
Looking on the daily time frame we can see a bearish Pinbar that suggests a move down. Last three days were bearish so we could see even more black candles in the next few days.

The range from $1.17094 to $1.19030 is still holding the price. EURUSD has formed a bullish engulfing bar on the daily time frame right on the lower level of the range area.
The engulfing candle shows that the bulls are still holding and not allowing the price to move down. Two candles after strong bearish candle did not close below bearish candle close which shows us there are no bears strong enough or the bulls are stronger than bears.
Current market overview shows us a consolidation which the price needs to exit from in order to make further move.
Last consolidation was in June which lasted over a month. Will this be the same scenario we need to wait and see what the market will do on the range area boundaries.

EURUSD has reached a resistance level at $1.19000 which is the upper level of the range area. Range area spreads over 200 pips wide area between $1.17000 and $1.19000.
The $1.19000 level acted as a good resistance level on the last two attempts. First time was at the end of July and the second time was on August 05.
Second time when the price reached this resistance it was hard time to close the H4 candle near $1.19000 which suggested that the sellers will not allow easy break above.

The EURUSD price has returned back in the range area. Break above $1.19000 and daily close was not enough to hold the price above which means bulls have lost the strength.
As you can see on the H4 time frame there are two strong bearish candles that took the price from above $1.19000 back in the range area. There were no bullish candles that would suggest some kind of resistance to the bearish run.
The bearish run was during the New York trading session and the fall down stopped at the end of the trading day.
If the price falls below $1.17000 level the next resistance level is at $1.16000 which is visible on the H4 time frame. $1.16000 level was a nice resistance level when the price was in the uptrend moving from $1.15000 level.

The price stopped at the first strong support area around $1.19000. This is the upper level of the range area in which the price has entered at the end of July and break out two day ago on August 31.
It will be the level at which the price will take some time before making a decision will it get back in the range area or it will try again to reach $1.20000.
The second support where the price could stop and make some bullish price action signal is at the $1.18398 level. This level acted as a support in the previous price movement.
That level is also a level of support confluence where the uptrend support cross with horizontal support.
One thing we should not rule out is the daily bearish Pinbar that has formed on the resistance level. It is a strong signal we could see the price move down.
First daily support is also at $1.18398 level which confirms 4H time frame analysis.

As the market condition looks like we have a bearish scenario where the price cannot find strong enough support to back it up for move up. Sellers are in control and what we can see is that the daily Pinbar formed two days ago is giving its results.
The price is moving down and the next support level where it could find support is at $1.17842. This level has been a support for the price last week as we can see on the chart.
There we could see some pullback back to $1.18398 resistance.
As we can see the stronger move down can be during European or U.S. trading session. While the price has broken below the uptrend support line we could see very soon the price reaching the next support level.
While the price has reached the inside range area and strong bearish signals are controlling the market I am bearish oriented until the price reaches $1.17000 level.

The price has done what I was saying in yesterday’s analysis. The move down to the first support level at $1.17842 was reached and the price pulled back to the $1.18398 level.
The price is now on the uptrend support line which was broker and now is retesting that line as a resistance.
Today we have news which can impact the market and it is Friday when I usually stay out of the market because we can see unusual market movements.
We could see the price hitting $1.19000 and 1.17842 levels when news is published so pay attention to avoid news trading and set stop loss to prevent undesired loss.

EURUSD price has closed the day in an area between two small resistance and support lines. The area between $1.18398 and $1.17842 has held the price previous week in between until the price has broken outside and reached new highs, $1.20000 level.
News published yesterday where the U.S. data were positive has prevented the price from moving higher. The price closed below the previous day candle close which is showing us the price is moving down.
First support level below $1.17842 is $1.17200. We could expand that support level all around $1.17000 level that stretches from $1.16970 - $1.17200.
I am bearish oriented on this pair until the price closes above $1.19000 which is an important level for buyers.

The price is on a slow pace heading down since yesterday when the market opened. It is still inside a small range between $1.18398 and $1.17842, but the price has managed to break below 4H trend line support.
The next step for the price is to break below $1.17842 support level which is the lower level of the small range area.
While the price has a support level in front that must be broken and that could hold the price for a while, the target could be reached this week.
If the price reaches the $1.17000 level we could see the price bouncing while the support level is the level that is holding the price above since the end of July.

The price is moving as predicted on the yesterday 's analysis and on Saturday analysis. It is moving at a slow pace and breaking support levels targeting $1.17000.
Yesterday the $1.17842 support level did not hold. When the price reached this support a small pullback happened that did not last too long.
At this level where the price is now it will find some buying pressure because this level was hard to break down on August 21 and 27.
We can see the price has reversed on those dates from falling down to $1.17000 into a bullish scenario and the price reached new highs, $1.20000.

The price finally found a way outside of the range between $1.17000 and $1.19000.
The last two days candles were strong bearish candles that indicated the price could move down. If you take a look in the range area there were no similar strong bearish candles like these ones.
While the price has broken below strong support level $1.17000 the next step is to reach first strong support level. That is $1.15462 which was a strong support in the past.

The pair returned again inside range area that was active from July 27 until September 22.
Bears could not hold the price below $1.17000. The EURUSD has fall down to the first support level at $1.16178 where it found buyers that stopped the price.
You can see I have drawn downtrend lines to watch the price when it will break above. The break started this week on Monday and throughout whole week price needed enough buyers to find its way further up.
The price is now free to move up and first resistance that will hold the price from further move up is at $1.19000.

EURUSD has made a pullback this week after it confirmed breakout from the descending channel.
On Monday, October 12, the pair formed an indecision candle that stopped price moving higher.
Since then the pair was making bearish candles. On Wednesday the pair formed again indecision candle after which the pair made another bearish candle
As it looks like, the strong bearish candles are suggesting that the price has a hard time to move UP so it is good to wait and pay attention on Monday close.
But, as I said, I am still bullish until the price is above $1.17000. If the price manages to close below the price could move down to $1.15462 support which is also a monthly strong support.

EURUSD found strong support at the $1.17000 and for the whole week the pair is moving higher. The rise of a price was stopped at the resistance level of a new uptrend channel.
End of the week formed a bullish engulfing candle suggesting further move up at the beginning of the next week.
The pair is very close to the strong resistance level which is defined by the uptrend channel resistance and horizontal resistance.
I am expecting the pair to stall at the $1.1900 before trying to break above. We could see a pullback to $1.17800 – $1.18000 area where the price could find support for next move up.
