Current month latest:

Current open position:
AUD/JPY closed with 100 pips. Current standing:
Price is below where my trade closed but, I’m expecting it to move up again therefore, I’ve jumped back into the trade. Current open position:
Added another two trades which have now closed, bagging another 235.5 pips in the process. After a poor start to the month it is turning into a good ending to the month:
March is not over yet but, looking to carry this momentum into April 

March is gone and we’re in April. Not much happening, two trades currently open:
Still room for improvements, that trade USD/CHF opened just above the resistance line of 0.95 and look where I am now  . I really should have waited to see if it drops below 0.95 before opening the trade.
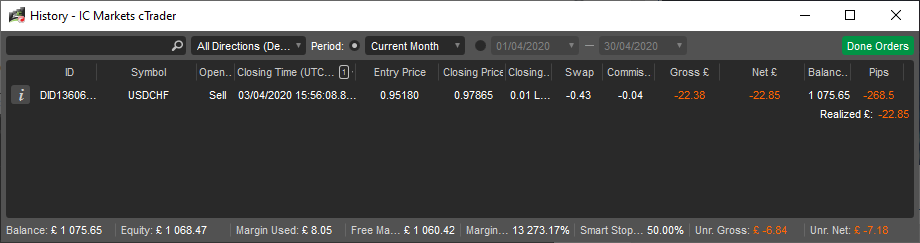
It’s been a disastrous start to April, the USD/CHF closed 268 pips in the red:
Even the huge dissapointing number out for NFP wasn’t enough to weaken the $USD. Hoping this will only get better from here, have a lot to make up already. USD/JPY is still open though, that has also taken quite a swing. Was going really well then a sudden swing has lead to being over 90 pips down
I hope I’ve learnt my lesson, I will be continiously referring back to this post on trade entry. Before I go further into it, below is current standing for month of April:
There is one position still open, it won’t be closed in April that is for sure unless it is stopped out overnight or tomorrow:
Back to my earlier point about trade entry, as you can see from above I took a 268.5 pips hit at the begining of the month, purely down to bad analysis. I took a short position on USD/CHF, see my entry point on the chart below:
With price previously having broken through the 95.00 barrier then jumping straight back up, there was another drop down to 95.00. Rathern than waiting to see if price breaks through 95.00 again I assumed that it will and jumped straight in shorting USD/CHF. Just have to take another look at the chart to see what happened next. Did I learn from that experience? No. That is the reason why I am still stuck in the only open position I have at the moment
Trade entry is my achilles heel. Having taken 268.5 pips loss on USD/CHF and then being stuck in EUR/USD since mid April, I have been working on where to enter trade, that work enabled me to end the month well. I must have done the same thing at the end of March but see to have a memory relapse at the begining of the month! I’m going to stick to this formula that I have been working on. Since I’ve opened the long position on EUR/USD, I’ve gone back to some analysis I had done previously and opened four new trades which all closed with profit, one of those trades was long position on AUD/USD.
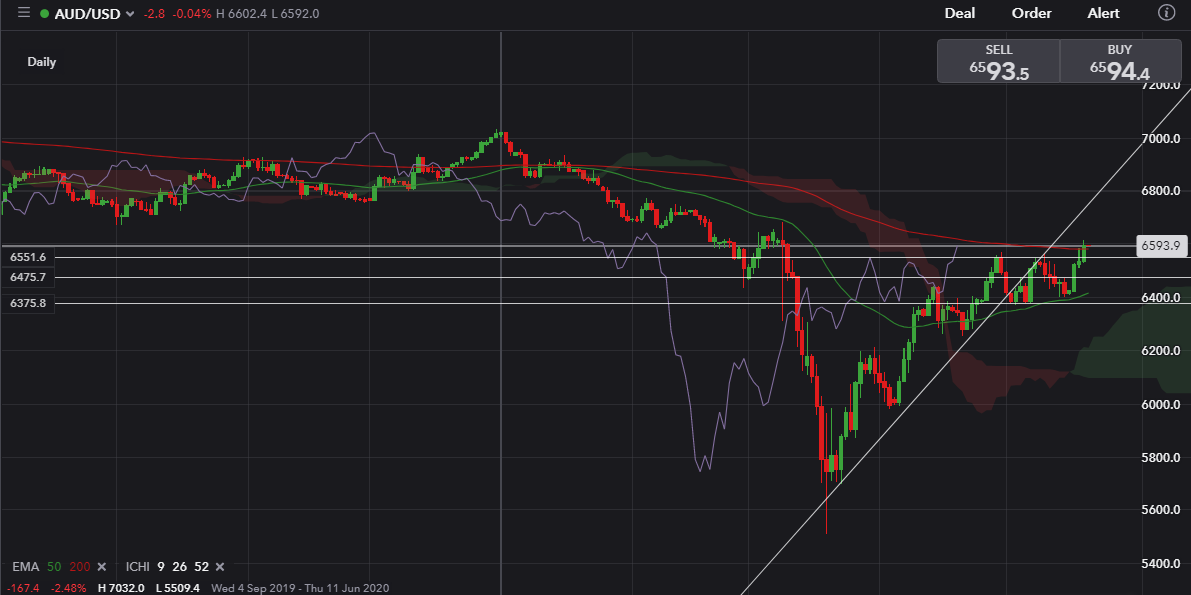
I trade the H4 chart, looking at that chart I can see there was an upward trend, price was above the EMA 50. Before entering the trade I reviewed the daily chart where I can see there is an upward trend with price having just entered the vacuum between EMA 50 (green line at the bottom) and EMA 200 (red line at the top) as per the screen shot below:
With daily chart showing an upward trend as well as the H4 chart, I took a long position as per below screen shot:
As you can see from the chart, price has moved up significantly currently trading at 65.55, I had closed my trade after my trade encountered some resistance at 65.00 but, I believe that price will reach 66.00 where it will touch the EMA 200 line. That is a critical point and my belief is that if price breaks through 66.00 the trend on the daily chart will change course to an upward trend. Failure to break through will lead to price dropping again.
I used the same analysis for AUD/JPY, AUD/CHF and AUD/CAD. Though I have closed my trades, using this analysis all four trades returned 335 pips. Had I stuck to my instict and remained in the trades that number would have been significantly higher. However, I am keeping track of AUD/USD as well as the other three pairs that I traded to see if my analysis is correct. Wait for the next update, to see if AUD/USD does reach 66.00, if it does then what next?
AUD/USD did not quite reach 66.00, just above 65.50 was as high as it got and then there was a huge change in direction which saw price drop to below 64.00. Looking first at the D1 chart, you will notice two things:
Despite the upward trend line being broken price has not droped below the EMA 50 line so there could still be a bounce on this line (63.40) which could spark another surge up. If price drops below this then I’m expecting a drop down to the next level of support which is 62.00.
Looking at the H4 chart, I’m looking to short on this pair if price drops below the EMA 200:
It’s been a while since the last post, almost two weeks. I’ve not been trading this month due to other commitments however, have been keeping track on AUD/USD. In post 88 I said that if the AUD/USD price reached 66.00 then the trend on the daily chart would change, this initially did not happen and you can see that on my last post price dropped down as far as 63.75 which turned into a support zone. I also said on my last post that on the daily chart as long as price stays above the EMA 50 then there could be another surge up and that is exactly what happened:
Above is the daily chart, and you can see that price has reached 66.00 and has hit another set of resistance here which I expected. 66.00 is just above the EMA 200 on the downward trend, if price does break above 66.00 and finds support then there could be a move up to 68.00.
Below is the H4 chart and you can see that price did break through 66.00 but, could not find support. I believe there will be another push above following which 66.00 will form a support zone. Only then will I be going long again on this:
May has been a quiet month, with only four trades placed. Before I start looking at the AUD pairs I just want to go back to April when I opened a long position on EUR/USD at 1.0985. On a numerous occassions I thought about closing the trade however, I let it run with the stop loss set at 300 pips from the opening price. Since then the opening price dropped to as low as 1.0725 and at times I did think about just closing the trade and accepting the loss.
Instead of closing it I decided to let it run and run it did.It never hit the stop loss and and started recovering. It reached 1.1016 on the 1st May at which point I did think about closing it but, left it open. It dropped again to 1.08 before making another push up, breaking through not only the 1.10 resistance but also through 1.11, reaching a high of 1.1143 on the 29th May. I had already moved my stop loss to 1.11 at which point the trade closed with 115 pips profit after price had retraced from high of 1.1143. Must admit I was lucky with that.
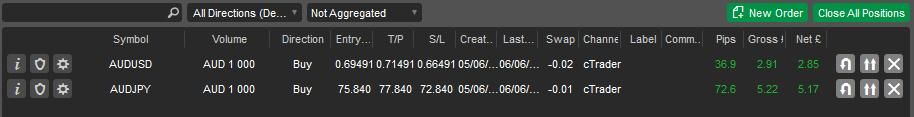
Moving on to the AUD pairs, on my last post I mentioned that AUD/USD needed to break through 0.66 resistance and find support and that is exactly what happened. Below are my current open positions:
As you can see from the H4 chart below, price has found support above 0.66 and has rocketed up:
If the momentum continues then I am expecting price to reach 0.69
The 0.69 barrier got broken, AUD/USD price went through the roof reaching as high as 0.69815 where it encountered resistance. Price re-traced from there, dipping below 0.69 before bouncing back up again. I had already moved mo SL to above 0.69 and got stopped out during the early hours of this morning. Due to the re-tracement I lost out on 60 pips but, given I locked in 280.7 pips there isn’t much of a complaint from me. I also had open position on AUD/JPY on which I locked in 369.8 pips, bagging a total of 650.5 pips from two trades:
Current standing for the month:
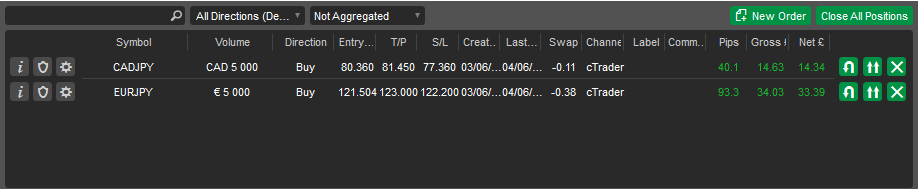
If price does not dip below 0.69 again on AUD/USD I can see it reaching an high of 0.72. My current open positions below:
The two open positions on CAD/JPY and EUR/CAD have been closed. I must admit I panicked as the price moved on the opposite directionI decided to close the trades despite being well within my S/L, below is how it finished:
It was a mistake to close these as price has moved above my T/P on both pairs  . I have opened two new positions as per below:
What started of as a good month is turning into a nightmare. AUD/USD broke through 0.70 twice, each time dropping below 0.70 immediately. The second time it dropped has had a significant impact, anticipating further move up and placed a long position and it back fired. I’m stuck in this trade, currently 156 pips down.
It was a classic error, rather than wait to see if a support zone develops at 0.70 I went straight in assuming it will. Unless a miracle happens I’m looking at being at the receiving end of a loosing trade as the trend appears to be changing with the AUD/USD currently trading at 0.6867/0.6868.
It took a while for that trade to come back round and it did, all the way to the open position and the AUS/USD is currently trading at 0.7150, I managed to close the trade in profit thankfully.
It has been a whils since my last post, I have been doing a lot of testing, still trying to get my entry correct. I have even moved down from H4 to H1 and there is more volatility but, the same principle applies. I have also decided that providing the EMA and trend on D1, H4, H1 and M15 are moving in the same direction, if there is a pull back I will be entering the trade after the next bearish/bullish candle (depending on the direction of the EMA and trend) forms.
I have been using this logic for the last month and so far it has been very successful to date  , I will be posting the details of the months trade next week for the entire month.
Result from last month on screen shot below:
The entry has always been a problem, where to enter the trade. On my previous post I mentioned that I am entering trades only if the trend and EMA on M15, H1, H4 and D1 are all moving in the same direction. I’ve had to make slight adjustment to this, the adjustment being as long as the trend and EMA on three out of the four are in the same direction then I will enter a trade once a complete buy candle has developed following a pull back. For example the EUR/USD, at the time of writing this, had developed a buy candle (see screen shot below):
I entered a long position on this pair whilst the next candle started developing. Next post will have details of the outcome of the trade.
thanks for sharing
Never hope in the market. It’s about the calculation based on evidence. You have to find a reason to hold or exit a trade. We can’t just hope to get the price up or down. You have to understand the price sentiment of a pair. By the way best of luck.
You’re right, should never hope and I should not have used th word hope. The overall trend at the time was up on all the time frame, soon after placing the trade there was a large pull back which meant I was in the red. It was a case of wait for the market to correct itself, as soon as the pull back was complete price continued in the up trend, I closed the trade in profit but had to wait for a while.
This trade is still open, following the entry there was a large pull back where price droppped below 1.17 before staging a recovery yesterday (03.08.2020). It is currently trading above my entry price of 1.17839, having breached above 1.18 there has been another pull back below. If price fails to breach 1.18 then may look to close the trade with what ever profit I can get out of it and wait for further pull back before re-entry. Below is a screen shot of current situation: