TUE28JUL20: AUD/USD Day Chart Short: S/O -67p 
Divergence and 4h bear candles formed at this juncture to enter short
SOLD @ 0.7131
S/L @ 0.7198 (67pips)
TP @ 0.6770 (360pips)*
- TP is Open
TUE28JUL20: AUD/USD Day Chart Short: S/O -67p
Divergence and 4h bear candles formed at this juncture to enter short
SOLD @ 0.7131
S/L @ 0.7198 (67pips)
TP @ 0.6770 (360pips)*
FRI31JUL20: GBP/JPY SHORT 2h/4h Chart: Closed @ 137.42 (-34p)
Anticipating the 4h Divergence in the forming, but using the 1h, 30m RSI divergences already formed, we went Exit and Reverse from our previous long.
We are however still in a Day Chart uptrend, so I am cautious on this trade using only 1/2 unit. Having said that, I will add 1/2 more at the completion of the current 4h candle IF there is a 4h Bear Confirmation by means of Bear Engulfing at this stage.
Nevertheless, we will keep a close eye on this short
Entry price, stop loss and tp in picture
wait and see
Entered a bit premature. We will wait for a proper 4h Chart Divergence in the next few hours to re-enter short if so required
GBP/JPY LESSON LEARNT
In the last three GJ trades I had 2 wins and 1 loss. The latter, came not only at that price but the fact that I missed out on another 200 pips! in just the very next day from my Long Trade.
As I had mentioned earlier, the GJ is in an Uptrend (Day Chart), and as such I must (at least for now) favour the long trades if in doubt or at least to “ride the trend” while is still intact.
The day chart had not shown signs of turning around yet, it only just (after my last short) shown an overbought as it was to be expected. But certainly there is no Trend Line Break or RSI Divergence that tells us this is turning around.
I made the mistake of using the 2h chart and mis-reading the RSI divergence which I had used for my 3rd last trade (short with +90 pips profit above), and use it again as a 1-2-3 point divergence which DIDN’T HAVE a 4h Bear Candle Signal at all to support such analysis.!
This costed me another 200 pips in profits, given that I “Exit & Reverse” on the next trade when the 4h or Day chart signals are there.
The signals I so much refer to are the same I used to show the 30m “super kiss trades” for GU.
Other entries come from Fib Level retracement, Gartley.
This is what I call “KISS” trading. As long as two of the above occur, then I am due to exit/reverse my trade. It is simple.
Based on my live trades and research on GJ, this approach when executed perfectly, has provided the following results:
+5,527 pips since 3/9/19 until a perfect execution of the last buy (which by the way, we should still be long and using 139.00 as an exit), with an average of only 2 trades per month and 9 days per trade.
I am happy with simply trading this way, it requires only to spend 5 min analysing the Day chart once a day and then checking the charts for another 5-15min every 4 hours! What can be much simpler than that! 
So, all in all, I didn’t execute my last long perfectly, only 50% (200 out of 400 pips), at least for now.
But I intend on improving on my performance from here on!
You will notice that I will be only posting trades for the GJ from here on as well.
I am also increasing my investment per trade to 10% of my trade capital, since it is almost the equivalent of trading 10 instruments at 2% and having 5 out of 10 active trades… 2% x 5 = 10%
I also will be using WD Gann’s pyramid approach:
10% on entry
5% on retracement
2.5% on next retracement
Let’s only hope that my execution rating increases from 50% to 90% and I should be happy! 
Happy trading!
TT
TUE04AUG20: GBP/JPY SHORT 4h CHART Closed @+27pips
We have a 78.6% bear engulfing candle at the 4h chart with a 2h candle that has closed at the south side of the recent inner up trend line.
On the Day chart we are in a possible “Positive Divergence” forming. Therefore, rather than waiting til tomorrow, I am using the intraday charts to give me the go ahead as described above.
Now, wait and see
FRI07AUG20: THE RIGHT ENTRY IN 4H CHART
Since I entered this trade, I have been sweating it. I jumped in based on what it appeared to be a “positive divergence forming” on the day chart. There was NOT a divergence in the 4h chart nor bear candles to warrant entering short when I did. LUCKILY, now we have the entry. It happened at 00:30 last night after a RSI Divergence formed and Bear Candle (Evening or Engulfing depending how you see it).
The entry should’ve been 20pips cheaper, but I take it! So now, I can let this one do its thing without staring at the charts all night!
Wait and see…
THU06AUG2020: GBP/USD SHORT 30m Closed @1.3067 +100p
Once again, Divergence and now trying the small time frame and see how we go.
SOLD @ 1.3167
S/L @ 1.3187 (20pips)
*TP @ OPEN
post trade note: this trade has now become a 4h chart trade since we got a 4h bear candle and div confirmation. So our TP is now OPEN. All good news since it only costed us 20pips to begin with…for once I got the trade at a great price. now, it just needs to go our way.
FRI07AUG20: GBP/USD SHORT 30m CHART: Closed @1.3073 +40p
Another short adding to our current b/e short trade above.
SOLD @ 1.3113
S/L @ 1.3171 (58pips)
TP @ OPEN
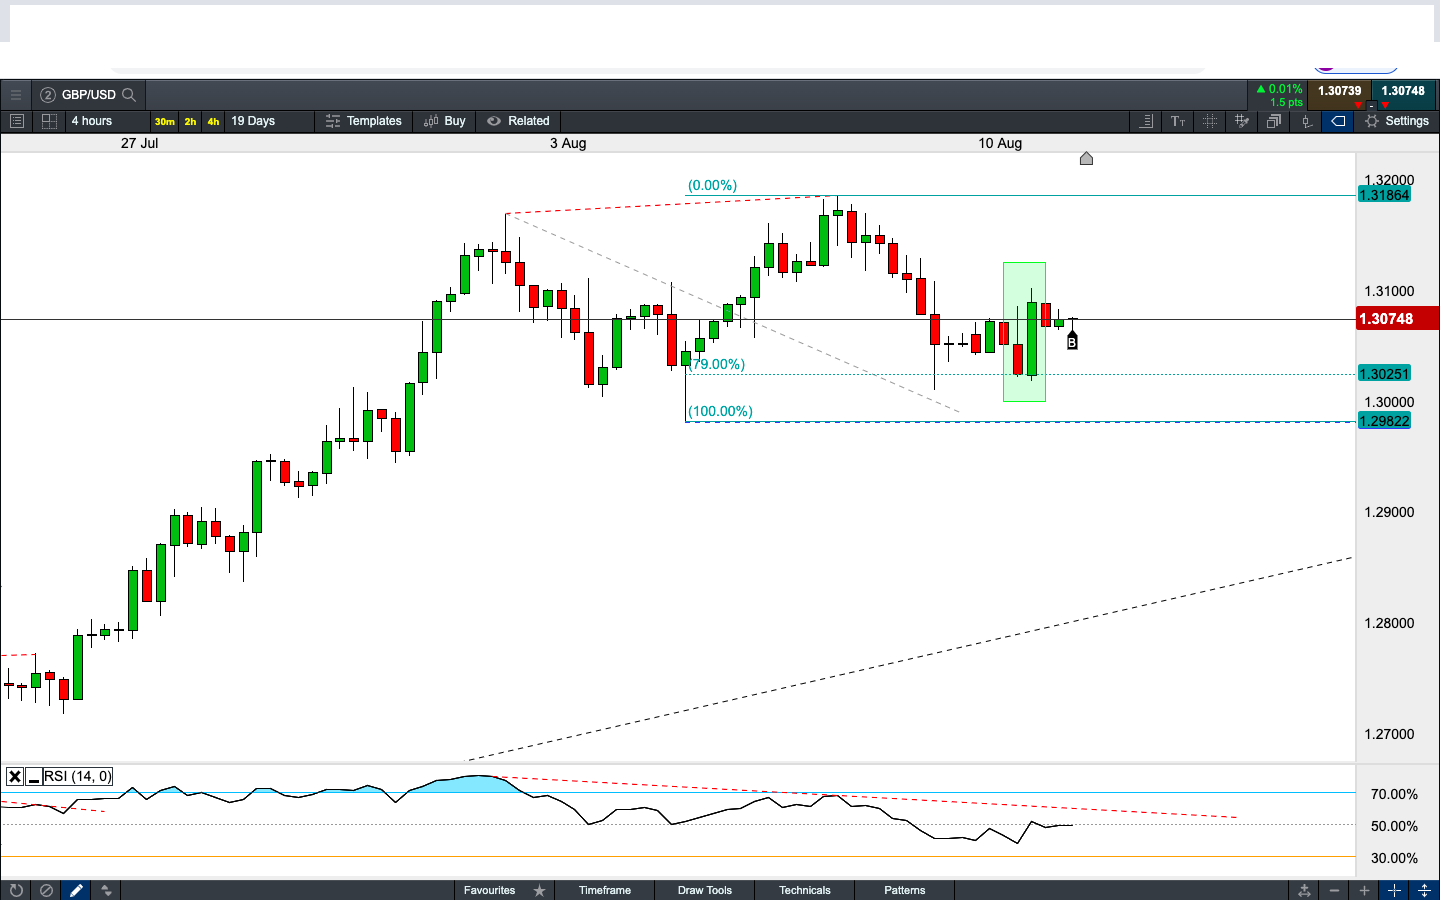
TUE11AUG20: GBP/USD LONG (30m & 4h Trades): S/O @ B/E
I have entered TWO trades on this one. You can see it as such or as two separate lots with two separate targets and S/L prices.
4H CHART: 786 FIB + BULL ENGULFING
BOUGHT @ 130.74
S/L @ 130.09 > S/L NOW @ 1.3125 (SAME AS 30m trade)
TP @ OPEN
30m CHART: FIB 50% + BUY ZONE
BOUGHT @ 1.3075
S/L @ 1.3058 (17pips)
TP @ 1.3125 (50pips or Fib 127)
yes we have to keep trading simple because unnecessary complications lead to losing trades it’s a well-known principle. Most of trading edges are concentrated around simple ideas why something should work or should not work. You have to always make sure that you understand every part of your trading system.
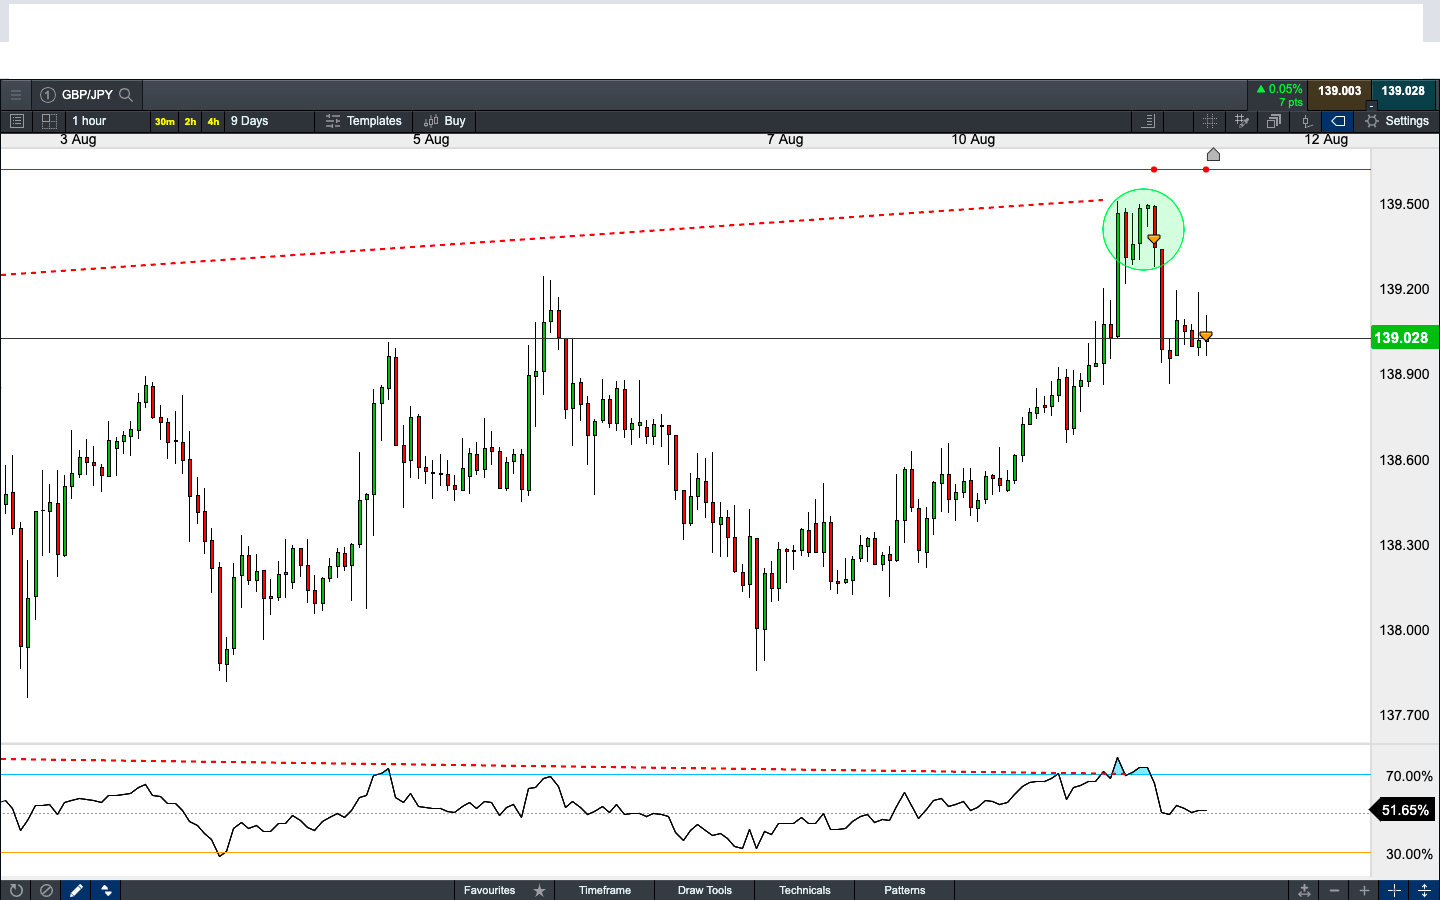
WED12AUG20: SHORT GBP/JPY 1H/2H/4H charts: S/O -50p
I entered 2/3 of my trade size early in the morning (4am oz time) after a 1h bear candle had formed in what it appeared to me were in the way of a nice 4h Chart Divergence.
This is the one. We have made some $$ in the one before, and also in the way back up. We missed paper profits on the last GBP/USD trade that move 1:1 our way, ending up B/E.
I hope this one is the one that will turn the tide for longer than the 40 pips we have been capturing…
To avoid getting stopped out, S/L was moved to 139.71. We got saved by this precautionary measure…
At least for now. So still in the hunt…
THU13AUG20: GBP/USD SHORT 1h Chart: what a rookie mistake! -24p
This cross was in the “Buy Zone”, why did I sold?
Onto the next
LESSON / ANALYSIS:
My KISS principle trading is exactly that: SIMPLE!
There are two types of entries, in my trading:
(1) RSI Divergence and/or Break of Inner Trend Line
(2) Fib Retracement
Both require Japanese Candlesticks confirmation. Both are in the 4h chart (GPB/JPY) or 2h chart (GBP/USD) or 30m chart (GBP/USD).
Simple!
(1) RSI Divergence and/or Break of Inner Trend Line When the market breaks the up trend (inner which is the line that joins the most recent lows) then the market enters the “Sell Zone” and we sell. The target is usually the next low. Once it breaks the low, then we will be looking for the 2nd type of entry, Fib Retracements. Sometimes an even earlier entry, is upon the market forming a divergence coupled with the candle signal.
(2) Fib Retracement: This one is even easier, once in the trend, we sell the rallies or buy the dips, simple. The TP is easier recognisable too, usually the safest is the 127 extension, although in a non choppy market, it will more than not also reach the 1618 and give us entries a long the way.
Like I said, SIMPLE! Yet, I still am making Rookie Mistakes!
FRI14AUG20: GJ SHORT 4h Chart: S/L @140.16 (-50pips)
The GJ up trend has been very strong. It finally reached the last Day High (Resistance) level it wanted to reach. Had I followed my very first instinct at the begining of the month, I would have been reaping off the extra benefits, There is no point in crying over spill milk though, so we have entered short once again.
The downside of trading using RSI Divergence is that one can have a few losses before hitting that big win. Fortunately we only had one loss, so far. In retrospect, I was a bit “worried” with my last short simply because the Candles were “not quite textbook”. But the “gambler” part of me prefered to be wrong than to miss out. Once I miss this entry, I might not have the opportunity to ride the next trend.
Without further talk, here it is.
PS I am also waiting to enter short on the GBP/USD but for the little quick trades using the 30m chart, as I have been. So too, in this cross, I have left many pips on the paper profits table, because the GU is in a range, choppy stage, I needed to adjust my targets to pick those pip up, and I didnt. Another lesson reminder!
tue 18/8/20 18:00 Relocating S/L to -50pips risk to allow the GJ to do its swings. We do not want to be stopped out prematurely…
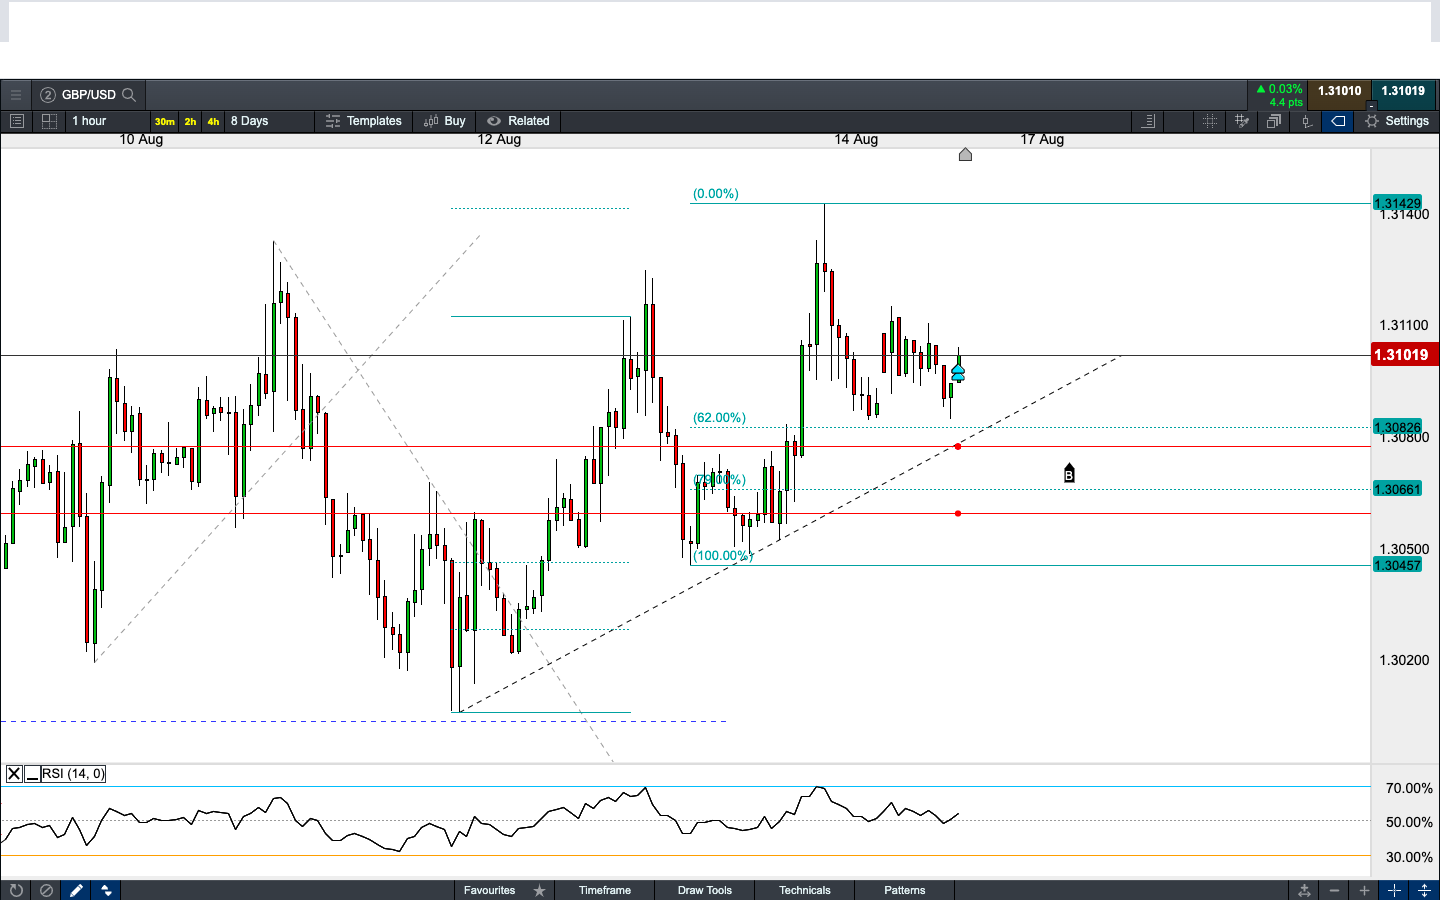
MON17AUG20: GBP/USD LONG 2H-1H-30M Charts: Closed @ 131.68 (+70pips) 43% of Max Swing
We are looking at the 2h chart for entry at the 61.8% Fib. However, we already have a 30m and 1h charts “Hammers”. I have taken this signals with the expectation that it will give me a better price than waiting for the 2h chart.
Having said that, I have divided my trade into 2 set of stops losses levels as shown.
bought @ 1.3098
s/l 1 @ 1.3072 (25 pips)
s/l 2 @ 1.3059 (40pips)
tp 1 @ 1.3197 (100 pips)
tp 2 @ open
Exit and Reverse the above trade
-typo error, wrong cross…
GBP/USD Closed @ +70pips (at the 127 Fib Extension.)
There is no 2hr reason to exit, except that we want to take the 127 extension as TP
However, I will be looking at entering long again on the next retracement
On the daily chart I believe GBP/USD still has potential to go higher to form a Day Chart RSI Divergence before turning around
Wait and see
GBP/JPY still short with s/l @140.16 (b/e or -50pips)
GBP/USD PREPARING FOR A SHORT
The GU appears to be heading to form a Day Divergence. If the current day candle closes as a Bear Doji, we might have a “Bear Harami” in play. This coupled with the current levels of RSI Divergence, MIGHT give us a chance for a Short. However, we will wait to have a clear Intraday RSI Divergence and Bear Candles as well. Of course, a Day Dark Cloud Cover is also another bear candle signal available…Wait and See
EFFICIENCY MEASUREMENT: 90% Target
I have came up with a way of measuring my “profit taking efficiency”. This has been one of my weakness. Point in case the recent GU long trade from which we capture only 73 pips leaving the trade at the 127 and forgetting my exit rule: 127 + RSI Divergence or Break of Inner Trend Line; OR Fib 168 + Candle… I even wrote “there is no other reason by the Fib 127”…
This decision resulted in 73 pips out of the Maximum Swing (so far…) of 175 pips! giving us a 43% efficiency on that trade.
NOTE: THE MAX % EFFICIENCY MIGHT NEVER BE 100% The obvious reason for this is that I am using the “High of the Candle Swing”. Only a claravoyant could achieve 100% and be super rich. But I would like to be sitting in the 90%…
Happy Trading…
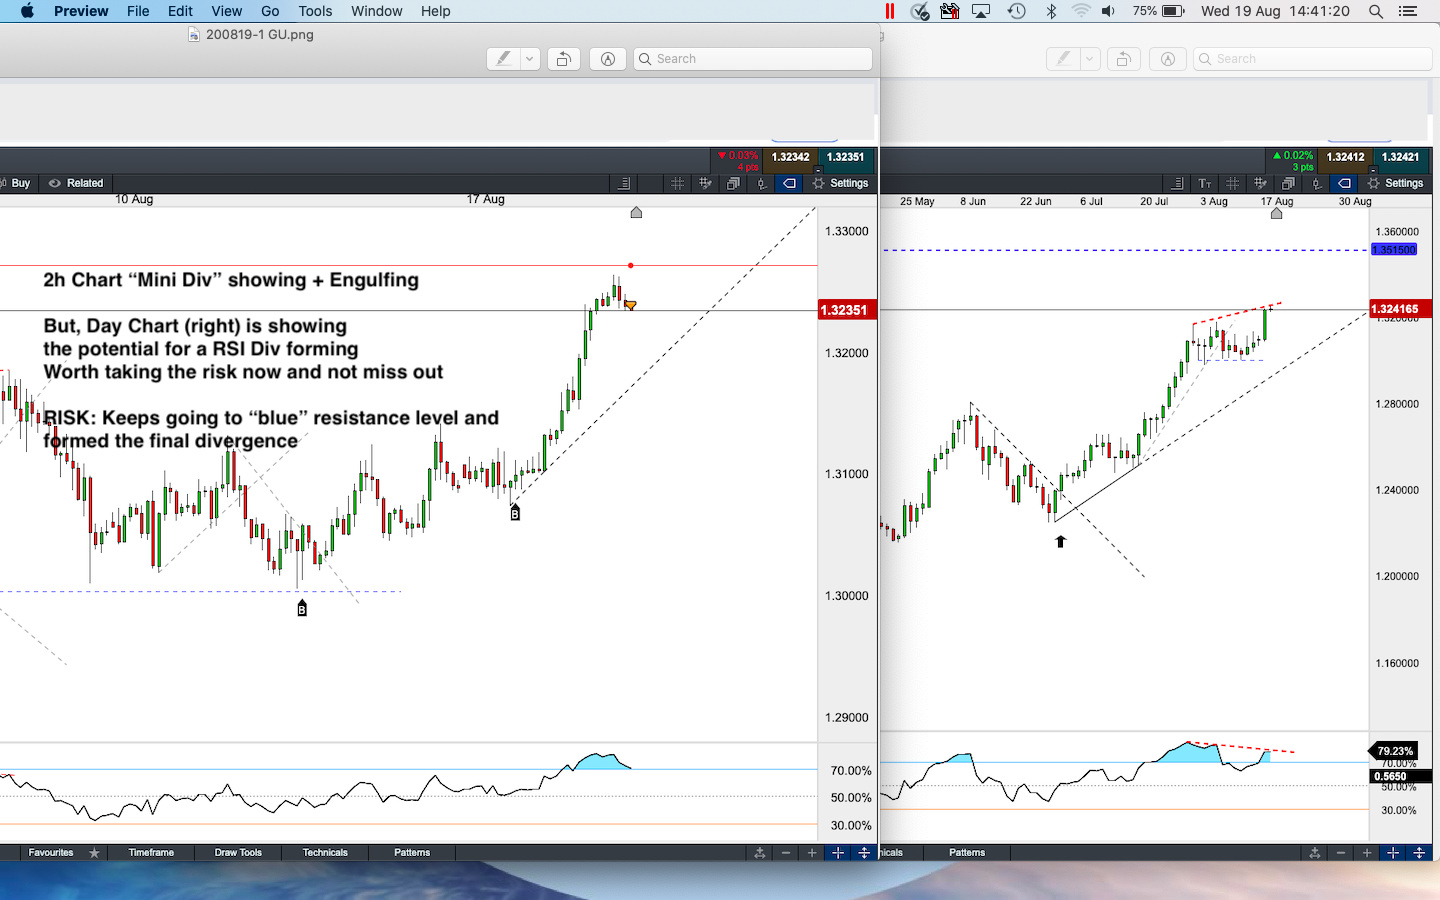
WED19AUG20 14:30: GBP/USD SHORT 2h-Day Chart +130PIPS
As per my analysis two posts above. I feel the GU might have reached the new high it needed to form its RSI Day Divergence. There is also the risk that it might want to retrace temporarily to re-fuel and continue north towards the blue Resistance Level but given the signs so far I am willing to take the risk. It is only costing us 37 pips for a huge potential, so I am in…
SOLD @ 1.3235
S/L @ 1.3272 (-37PIPS)
TP @ OPEN
THU200820: +130 PIPS IN JUST ONE DAY
Isn’t it nice when you can go to bed and wake up with almost 4x your invested money in profits?
Well, this is why I love the GBP, and this is why I usually will take the “punt” ahead of time specially when it comes to the GBP. If I had waited for the Day Chart Bear Engulfing candle, the trade that cost me only 40 pips or so, it wouldve costed 200 pips…of course we wont be trading 200 pips stops, but you get the point.
Although I AM BEARISH on the GBP and pretty much any other cross against the JPY & USD, I use the GBP/USD cross as my “Intraday/Day Trading” whilst I keep any other crosses like GBP/JPY as my Longer Term Trades (see below for the AUD/USD, EUR/JPY Day Position Trades)
So for now I got out of this one, but I am back to ride the possible or due retracement with the view that ANY LONG POSITION ON THE GBP/USD IS ONLY FOR A QUICK PICK UP, 2X OR SO. AND LOOKING TO KEEP SELLING SHORT ALONGSIDE THIS NEW (POSSIBLE) DOWN TREND…
THU20AUG20: EUR/JPY SHORT DAY POSITION TRADE: SL [email protected]
SOLD @ 125.57
S/L @ 126.47 (-90PIPS)
TP @ 121.77 (+380PIPS) OR DAY RSI 30% OR BREAK OF NEW DOWN INNER TL