Kiss principle trading

DISCIPLINE CHALLENGE

I started my KISS post by setting myself a 100-real time trades challenge.

Now I am setting myself (and to you as well) a “discipline challenge”.

This is how it will work:

I will enter a trade following my rules (perfectly) and the goal is to achieve the maximum number of well executed trades consecutively.

This doesn’t mean that the trade has to be a winner, or that I may not have made a wrong analysis. All it matters is that I selected a trade that meets my “technical analysis, trade management and money management rules perfectly”.

The count will reset IF/When I enter a trade that doesn’t follow my rules.

Here are the details:

Trade Selection:

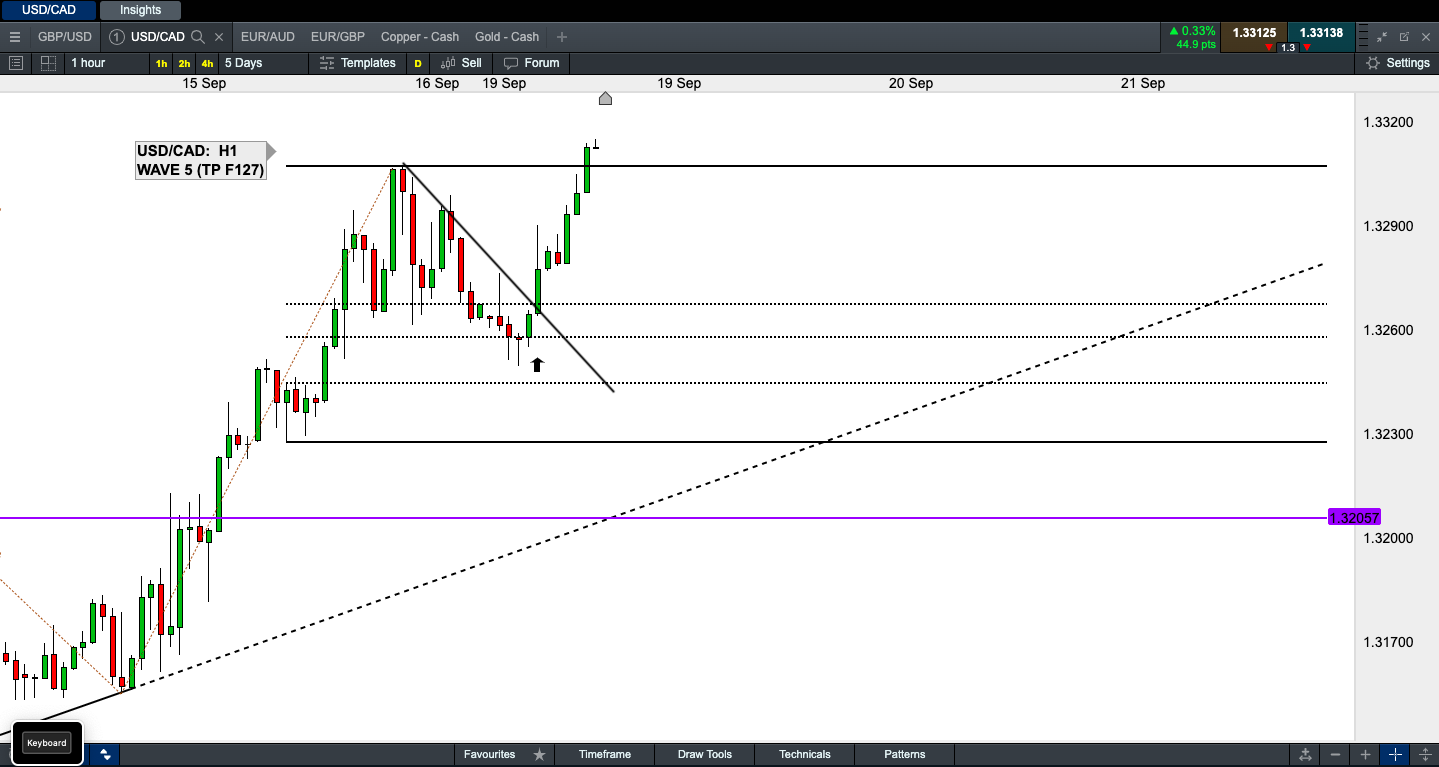
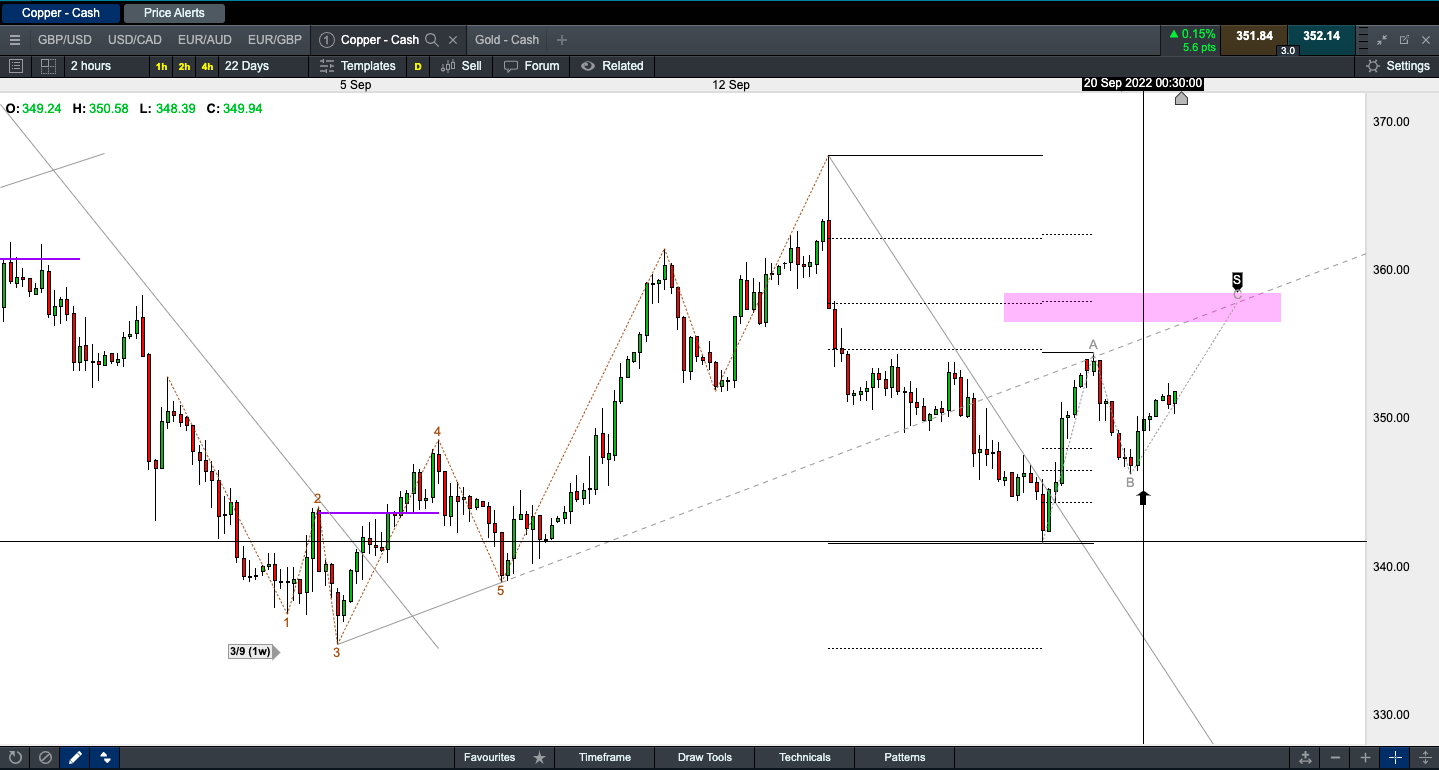
Swing Trade: Wave 3, Wave 5, Wave 7+ (NOTE: This naming convention has no relation to Elliot Wave, I could’ve just called them “Leg 3, Leg 5, etc.

However they will some times match the Elliot Wave rules (ie. Wave 4 doesn’t penetrate the high/low of Wave 1)

Double Top/Bottom: reversal pattern.

S/L: Set +/- 5pts Candle Signal OR Fib 50% . That is if the trade it’s a 38% fib trade, S/L has to be beyond Fib 50% minimum

S/L move to B/E: At the recent Swing H/L or for big swings at 1.5x-2x

TP: Set at Fib 127% +/- 5pts

Wave 3 Rules: This wave 3 set up can only be entered if it is in the direction of the main trend. If we are counter trend trading we Do Not enter such set up.

Exception to this rule is when Wave 3 has formed behind a Trend Line Break of a Higher Time Frame. e.g. H4 TLB and we are trading the H1 chart; or Day TLB and we are trading the H4/H2 Chart

Wave 5 Rules: We enter these set ups with the main trend or with the corrective (temporal counter trend).

The reason being that we never know when the Main Trend will be broken so we certainty want to be in it.

Wave 7+ Rules: This set up usually occurs only on the Main or New Trend so we certainly want to trade it. However, most of the losing trades will come from these types.

Markets:

We will only see for a trade in 3-markets. These can vary but it will always be one of each:

Currency
Index
Commodity

Currently, for this month our chosen instruments are:

GBP/USD: H1 Chart
Japan 225: H2-H4 Chart
Copper: H2-H4 Chart
Crude: H2-H4 Chart
Soybean: H2-H4 Chart

Money Management Rules: 2.5% per trade. Max of 4 open trades at any time (10%).

I have recently completed some “back testing” for the GBP/USD H1 chart and I will be posting some sample charts/trades for this currency and also for my trading method. My focus from here on is in being disciplined and on keep practicing rather than finding lots and lots of trades that really doesn’t match my personality

MY GOAL AS A TRADER IS TO MAKE MONEY, NOT TO TRADE MORE!


WED 14 SEP 2022: JAP 225 TRADE 1
Jap225 has formed what appears to be a Wave 3 set up (as per my own terminology). Breaking a 3-wks Down Trend Line. Also, this set up appears after a Day Hammer at a Day F50% that propelled the last rally. This is what we call a “set up inside a set up” and I was waiting for it since I didn’t see the Day Hammer/F50% trigger, luckily I traded the rally on the Germany 40. :slight_smile:

So this is my first trade of my discipline challenge. IF you want to participate in this challenge, please post your trades here.

SAMPLE GBP/USD H1 TRADES:
Here I am posting sample trades using my method and the GBP/USD H1. I am also including some “not tradeable” set ups like a “Counter Trend Wave 3 Set up” or a trade where the cost in pips exceeded my limit.

**I am using a $10000 (or 1 mini-lot) or an Investment of $50. ** :slight_smile:

Wave Trend Trade Sample 1

Wave 3 Counter Trade: Not an entry

Wave 5 Counter Trade: An entry


This trade is only possible because of the previously large trend swing that has formed.
However, if in doubt we can avoid these type of trades because it can cause us to forget that we are (in this case) in a main Up Trend…

THU 15 SEP 2022: GBP/USD TRADE 2
A better price should be available later on. I entered based on the H4 Engulfing candle and 79% bounce. HOWEVER, I would’ve preferred to had waited for a second set of candles to confirm or for the H1 to give me a second set up.
NEVERTHELESS as per my own Discipline rules, once entered a trade “Set it and Forget it”
Like I said the purpose of all of this is to get back into being 100% disciplined.

I have the bad feeling that because the GBPUSD has been in such a LONG DOWN TREND that it may want to form a Triple Bottom first before (IF) heading north again.

Wait and see.

THU 15 SEP 2022: UK100 TRADE 3 deleted
Not happy w 5% open on correlated trades.

All the Indices (Germany, Euro, Australia, Jap) had formed the same signal and some are already in a new up trend. So I have added as Trade 3 a second trade on the UK100. I missed checking the Aus200 early enough and it has moved away a bit already. Besides, the UK100 has actually hit the Fib 79% plus the R:R was slightly better on this one.

This makes the 3-open trades with a 5% risk on the Indices and a 2.5% risk on the Currencies.

COPPER:
The next trade I am waiting for is a “Crown within a Crown” set up in Copper.
Can you see it? Clue: Use Day and H4 Charts… I will post the chart later on…

Happy trading

FRIDAY 16 SEP 22: CRUDE & SOY
Nothing like a few losing trades to remind us that it is the market that is in control!
I will stop trading Wave 3 since it has more rules. I made a wrong analysis on this set up.
So, back to basics…

CRUDE: S/O

SOY: CLOSED

NOTE ON SOY: The correct entry occurred overnight (black arrow), so I was waiting to get in as soon as I could. Which I did after the bull candle completed giving me almost the correct price.

WEEK 19 SEP:
Possible set ups to watch for:


GOLD SHORT TRADE: S/O @BE
As per my post, Gold came a bit earlier
At 10:30am H2 candle or at 12:30 H4 candle, the former giving higher R:R

Noticed how we draw the Fibs from either (or both) the last Major Swing High or the last High
Which I failed to do with USDCAD below…

USDCAD: MISSED
Unfortunately I drew the Fibs only from the last Swing Low instead of from the last Low (which is part of my rules)… so a missed opportunity here…

USDCAD LONG
It retraced back to the H1 TL & Fib 62%

Note: I am still to adjust the TP to the Fib 127 ext.

POST TRADING NOTE;
After further analysis of the Day Chart and revisiting this trade. i noticed that my analysis was wrong. However, we might still have a chance for a positive result IF the usdcad is forming a Bear Gartley as i expect it.

So I only adjusted my SL to half my risk placing the SL at a low using the M30 chart.

Our next trade here, is to go with the beautiful Day Chart Shooting Start and go SHORT on the Right Tip of the Bear Gartley to be formed in the H1 chart… If this works, then we will also get our TP hit (which I placed just below the Left Tip of the Gartley)

COPPER: GART MISSED
in my post #707 i listed a few set ups we were watching for. copper’s gartley was one…
Unfortunately, unless we trade 24x6 we won’t catch all set ups…
This one happened beautifully at 00:30 last night…I think I was still awake but already meditating in bed ready to sleep…

in any case, it is good to know we are in the right track with our analysis

Below the BEFORE and AFTER

THE NEXT BEAR GARTLEY?
Having said that above, now we are looking forward to a convergence of Fibonaccis 127/618 and Back of up trend line which was broken a few days ago.
This is a beautiful set up to take it short. besides, the overall day chart of copper is in a down trend…
Can’t wait for this one… Even If I have to wake up through the night every 2hours!
:slight_smile:

JAPAN: Watching for a Gart Set Up?
Let’s see if this gartley forms and if we can catch it.

Please remember, we can only plan a possible trade coming up but it is up to the market to form it or not. A lot of times our “predictions” will be wrong, we are not in the business of “predicting” or 'being right" we are in the business of “making money!”

WED 21 SEP 22 TRADES:


FROM SWING TRADING TO DAY TRADING WITH THE KISS PRINCIPLE
After quite a few unsuccessful trades I was able to recoup and profit from Day Trading last week.
For quite some time I have been trying to transit from Swing Trading to Day Trading.
For one simple reason, 'I like quick results". i am used to have quick results due to my pro-punting.
In horse racing you know if you won or lost in just a minute.

Unfortunately I hadn’t been successful…until now!
Last week alone, I made 50 units of betting and I only traded the Asia Market. This week I intend to completely eliminate all Swing trading and only do Day Trading and will attempt to trade as much of the 3-sessions as possible.

Attached is an example of my last trade (out of three) I took on Friday at 16:30.

The unfortunate thing for all of my followers is that because I will be trading the M5 chart by the time you guys get my post it will be too late.
HOWEVER, the good news is that you will be able to learn and follow my method from all these trades.

CROSSES: AUD/USD or EUR/USD
TIME FRAME: 5min chart
EMAs: 21, 50, 100

Rules: The same as my usual principle: Fib Retracement to 38/50/62/79; Candle Signal; Inside the Correct EMAs “zone” (instead of using Trend Lines)

However, there is more. I do not just enter trades based on the above. I use what my wife calls “the babushka doll method”. I use a Higher Time Frame to define how far I can run my profits for. Otherwise, I use Fib 162% or 127% as Target

#Trades: One trade at a time, One Chart at a Time, One Day at a time (from the movie “Creed”)
Money Management: 1% per trade

AUD & EUR M30/M5 TRADES AVAILABLE


Exit And REVERSE;PROFITS TAKEN

AUD, EUR, GBP: LOVE THE M5s. Quick profits taken at M5 F162 (EUR & AUD, Loss on GBP)
BACK ON THE NEXT M5 SWINGS… TPS AT FB 162 M5s

All formed a double M30 Bear Candles Signals at the M30 EMA100 & Fib 786% convergence
So we entered long on all these three crosses with multiple targets
I will keep adding to this leg (if it runs off to its Fib 127/162) using the M5 chart swings

Let’s have a jackpot day…


EUR already at BE and free rolling
:slight_smile:

Oops: correction I meant “entered short”

Wednesday 28/9: Two short trades entered so far
Trade 1: Profits 6x
Trade 2: Freerolling TP at 3x

Both trades where entered in the M5 charts
Trade 1: Waited for a M15 candle, fib and EMA convergence. TP at M15 Fib 127. Stop and TP marked with yellow horizontal line.

The market hit it by the pip :grinning:

Trade 2: as shown, currently sl at b/e so trade is a free roll. Cost 7 pips TP 27 pips at the previous M30 Fib 162 extension.

I AM LOVING IT! NOw I know why day trading is so popular…

By using the M5 to enter a trade, following a M15/M30 candle formation, I can buy or sell as much as 5times the amount of units compered to Swing Trading using the H4/H2 charts alone.

Of course this is quite obvious, but it was always easier said than done.

On the other hand, trading purely on the M5 chart swings is costly! Because of all the noise, so the trick is to

MULTI-TIME FRAME DAY TRADING STRATEGY
SHORT TRADES:
STEP 1: M30 EMA 21 <50 <100
STEP 2: Draw Fibonacci from the recent M30 swing high to the M30 swing low
STEP 3: Wait for the market to form a M15/M30 Bear Candle Signal at Fib Level 62/79. Or at Fib 38/50 + hit M30 EMA
STEP 4: Switch to M5 chart (but keep the M30 EMAs on the chart)
STEP 5: Wait for the first swing rally with a M5 Bear Candle Signal (this will happen right after the M30/M15 bear candle that formed in Step3).
STEP 6: Enter short with stop at M5 Bear Candle high +1.5-2.5 pips (use the latter when Market has hit between two fib levels)
STEP 7: Set the TP at one of the following:
TP 1: M30 Swing Fib Ext 127%
OR
TP 2: M5 Swing Fib Ext 162%
OR
TP 3: M30 Swing Low
OR
TP 4: Fib Extensions Convergence (this will usually happen on the next set of trades when going from M30 FE 127 to M30 FE 162 for example

Usually this will mean anything from 4x to 10x :grinning:

Happy trading :sunglasses:

The SINGLE TIME FRAME DAY TRADING STRATEGY is a lot simpler but one must be careful bot to lose sight of the bigger picture. I experienced a little bit of that last night, luckily I still made profits but the volatility was high specially between 16:30-00:30 due to the fundies. I almost lost sight when I went long in the M5 luckily made a quick profit, but trading against the M30 trend is NOT the way I want to trade!

By the time I finished writing this post my TP just got missed by a pip so I closed the second trade at 2x.


SHORT AUD M15 CHART WTH M5 ENTRY: @ B/E
currently SL at B/E (freerolling) but if we get stopped out prematurely or it moves to a higher Fib then we re-enter short later on


THURSDAY 29 SEP 2022: AUD/USD: SHORT DAY: turned at 6436 (so +60p net or 10 bugger!) :slight_smile:
The H2 has formed a nice Harami at the Convergence of DTL & Fib 50% of the larger main Down Swing, which is also a Past Resistance Level.

The picture show the following (sorry hard to explain my thoughts, but it is much easier than this!)
First False M30 Signal at 00:30 (red vertical line) at H2 Fib 38.2%: Notice however that we had to wait for Step 5, which didn’t happen, so no entry!

Second False M30 Signal at 2:00AM (second red vertical line) between H2 F38/50: Notice once again that Step 5 is critical here, since the market doesn’t go down then rally back up and form a new high "below the last M30 candle high’, once again since Step 5 didn’t happen, then ‘no entry’… and we save some $$$

If we ignore STEP 5, and just enter on the first M30 signal at the Fib 382 we lost, then we enter again at 2:00am at the next M30 candle, we lost again!

First Real M30 Signal at 3:30AM (1st green dash line) at H2 F50% & DTL: Now we are talking!.
Once this M30 Bear Dark Cloud Cover closes at 3:30, we wait for Step 5 to occur. The market had gone down (when forming the M30 DCC), hits the M5 EMA 25 (not that we care), rallies once more and forms a M5 little engulfing candle at the M5 79% (I hadn’t drawn this Fib coz it will cloud the other charts!) But to explain you draw it from the last M5 high (which formed before the Green Dash line), to the last M5 low (the one hitting the M5 EMA25). Anyway, this entry (“S” arrow) costs only 5 pips!!!. And the market doesn’t go near our SL (0.65313) and with a 5pip entry cost for a M30 (at this stage) Trade this means a huge R:R potential!

Second Real M30 Signal at 5:00am (2nd Green Dash Line): We already entered the trade, so this is just a confirmation that the M30 Signal has a good chance plus that the H2 may form a Bear Candle to boot as well!

First Real H2 Signal at 6:30am (Solid Green Line): Now we are talking!. If we missed the first or even second M30 signals, or are trading using the H2, now we can look for entry (after the Solid Green Line) in the M30, and this happened just one hour later at 7:30 when we have a Bear Engulfing M30 candle! This trade only costs 7pips! Still pretty good for a M30 trade!

KEY POINTS TO REMEMBER:

(1) If we have a H2 signal trigger, then we look at the M30 for entry
(2) If we have a M30 signal trigger, then we look at the M5 for entry
BABUSHKA DOLL METHOD…:slight_smile: LOL
(3) ignore the EMAs 25 & 50 when looking at the M5 for entry. All we are looking for here is the Swing + Fib + Candle combo. The EMAs as IRRELEVANT.

When we start with our first entry from a H2 Trigger, then the H2 EMAs are the only one that matters
When we start with our first entry from a M30 Trigger, then the M30 EMAs are the only one that matters
The M5 EMAs are completely IRRELEVANT.

Unfortunately my software doesn’t allow me to overlay the H2 EMAs on the M30 & M5 charts. I believe MT4 or other softwares out there allows for this.

I have to create multiple charts to do this, to clear up my chart, but we play with what we got!

Now, all this mambo jumbo leads us to today. I entered my trade on one of the swings at 8:49am, I was meditating! The perfect entry was a bit earlier. Anyway, my trade is at 6 pips risk.
ATM the market is past the H2 EMA 50 which could’ve created a temp rally and stop us out, but it seems we might be clear.

TODAY’S PLAY:
For those of you that are on the sidelines, we have a plan!. We will be looking for a 618% or 786% retracements of any M5 Down Swings throughout the day.

How far down we can go, you ask?
We have a few key areas to watch out for but since this is a H2 TRIGGERED TRADE, then only a H2 Bull Candle at any of these points can mean a full profit take or at least a Stop Protection using the M30 Last Swing High… (mouth full!)

Risk: 6 pips
H2 Fib 61.8% Support at 0.6426 (80 pips from my entry lucky those in USA! that caught earlier)
H2 Fib 78.6% Support at 0.6398 (111 pips or 18:1 :slight_smile: )
H2 Low Support at 0.6363 (145 pips or 24:1 :slight_smile: )

IF we pass the above then we are up for a nice jackpot day! since the next actual Take Profit Target would be the H2 Fib 127% Extension at 0.62718 (237 pips or 40:1) and beyond this the H2 Fib 161.8% at 0.61537…but let’s not get carried huh?

CAVEAT: No matter how much we think we know, the market will always do its own thing. We could have a bunch of H2 Swings, a retest to the entry level, etc, so any M5 Swing Trade I enter from here on, will target its own M5 Fib 162% (as per the options listed on Step 7)

GOOD LUCK AND LET THE FOREX GODS GUIDE US TODAY! :slight_smile: