Don’t limit yourself. What if the “euro crosses” behave in a way that is not conducive to a strategy you choose to employ? You’ll think you’re doing something wrong, when in reality the instrument(s) just weren’t behaving.
Good luck
Don’t limit yourself. What if the “euro crosses” behave in a way that is not conducive to a strategy you choose to employ? You’ll think you’re doing something wrong, when in reality the instrument(s) just weren’t behaving.
Good luck
That is a good point.
Thanks
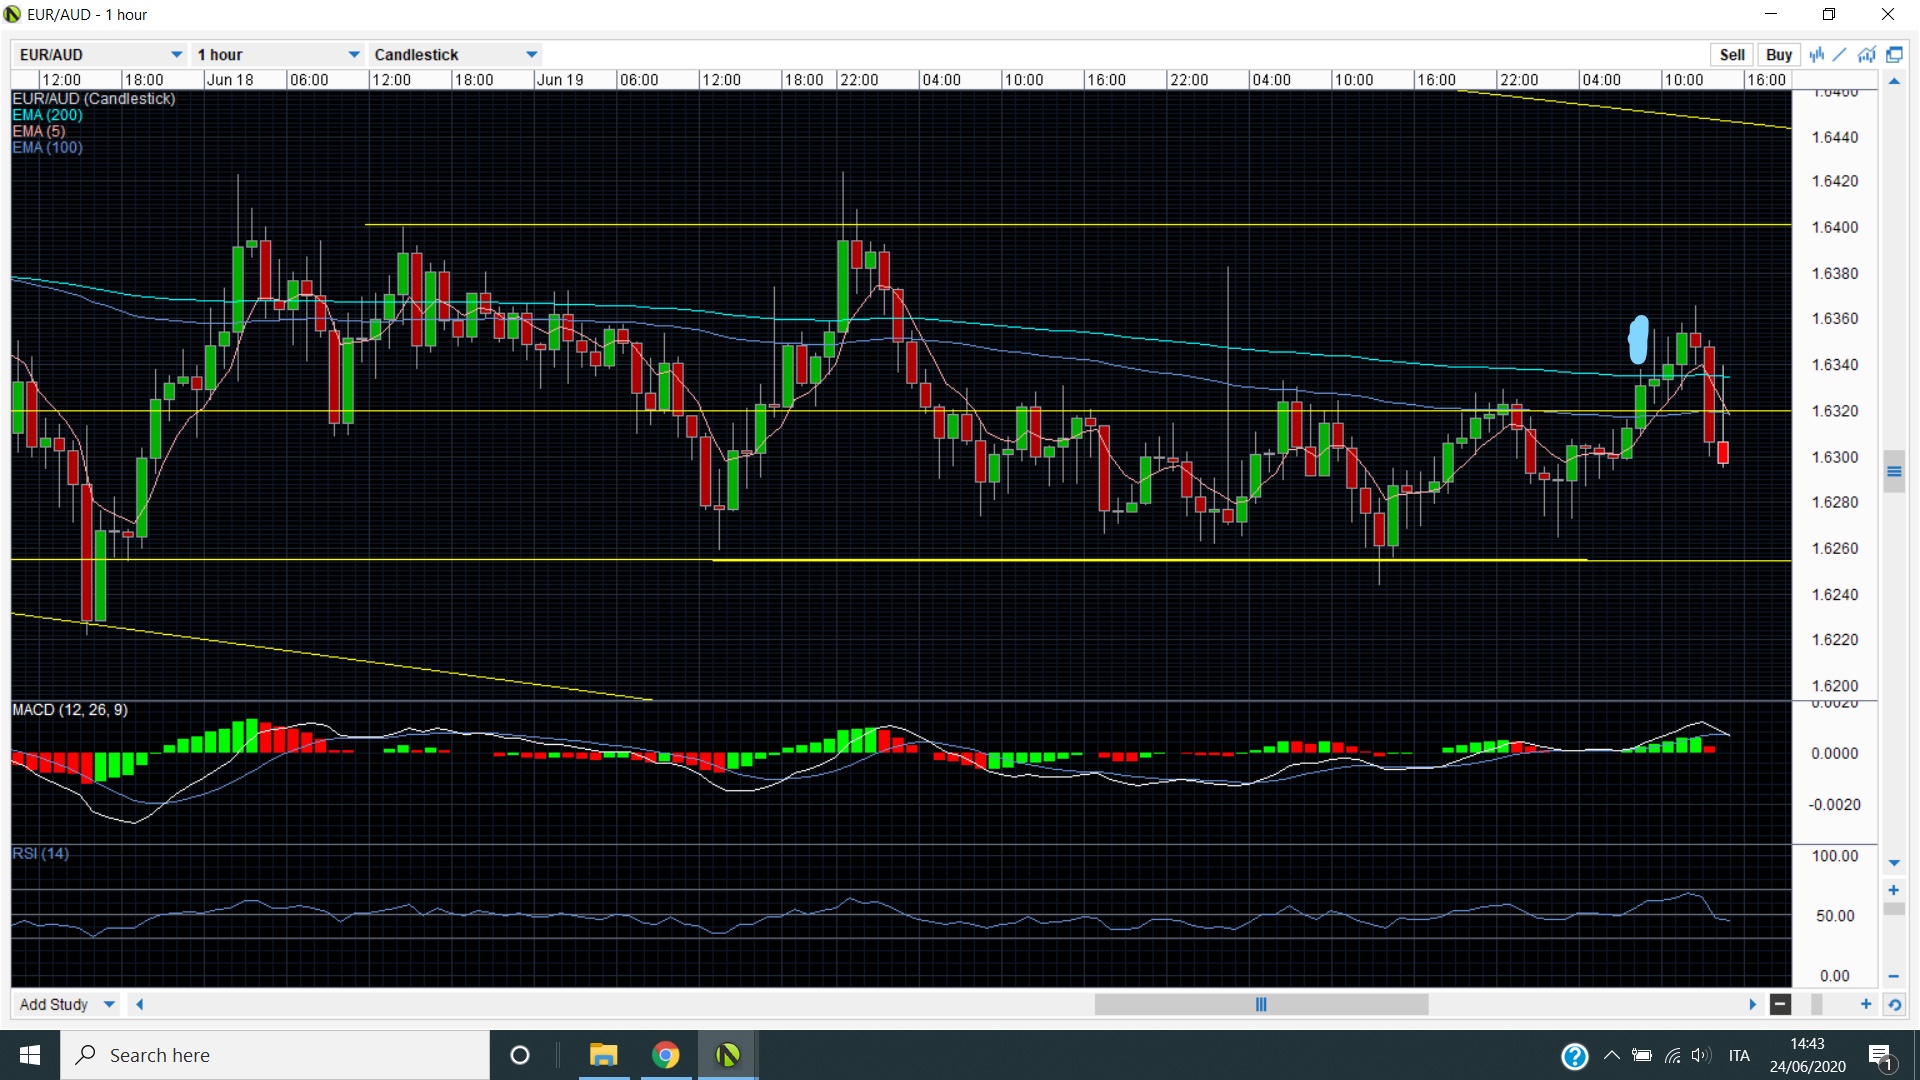
The entry point was the closing of the green candle and the stop the opening. Looking to get at least the top of this rectangle.
Any suggestion about?
Thanks
I honestly don’t know if there is a way to casually trade. It’s a business and treating it any other way will only result in losses
Were you buying or selling?
What’s your risk to reward?
Your SL: is at at open or bottom of wick?
Both charts that you show are 1H charts. You need to conduct your analysis on higher timeframes, such as 4H or 1D. You can execute your trades on the 1H once you’ve analyzed the market on higher timeframes.
Also, I suggest that you stop drawing channels and geometric shapes on your charts. Learn and understand market structure instead. Here are two useful YouTube channels that you may wish to visit.
Trade was long. Sorry i did`t metion that. SL was the bottom of the candle. Now i realize was a mistake i should use the bottom of the rectangular. Actually the price stop me out and push up again to the top of the rectangle.
What i`m trying to do is stuck the trade by opening 3 positions with 1:1 and 1:2 risk/reward and the last just keeping open and moving the SL.
The youtube channel they seems very nice and interesting, definitely i will look at them.
I`m always trying to look from the daily, 4H and 1 hour but sometimes it get very confusing.
I will try to keep more clear the charts, maybe it may help.
Thanks
But it looks like you got 1:1. So did you close one position?
Also why did you buy? The 100 ema is below the 200.
No I didnt. Stop me out before and then hit my target. I didnt consider the MA just because i just wanted to try to get a small profit.
But the very next candle left a wick which would have been 1:1. Can you please re check this because what you’re saying doesnt make sense. What do you mean it hit your target? The chart shows price going down, your target was at the top of the rectangle.
If you dont use the moving averages to trade then you should remove them off your chart. They will just confuse you.
Why did you buy there?
I`m very sorry for not been very clear.
The entrance is the green candle with the blue line on top (the 7th candle if you go back) , the top of the candle was the entry point the bottom of the candle the SL.
It almost reached my 1:1 target, it didn`t cause of the spread, then went down again, stop me out and then it went back up where my 1:1 was and even more up to my 1:2 target was.
Btw thanks for your time replying to me.
I definitely need to keep just want im using on the chart. As a beginner i thing we always looking to keep many indicator to get more confirmation and then they just confused us more or we dont even use them.
Thanks
I think your going too deep, try simple moving averages and crossovers, for instance 21 day and 6 day,
Here is new trade this time positive.
I need to say thanks to the Scruffy Trader for this one. I kind of followed his way.
I clean my charts and try really to work from higher time frame down and just try to understand the movement on the price without looking any indicators and just using support and resistance area.
I pick the pair with a forex power indicator so i open to something different then just EUR.
I reached 1:1 and 1:1.5 and i still have one open position risk free.
I really appreciate your previous comments, how you can see i took them on board.
Let me know what do you think of this one.
Thanks All
You try different strategies and see which works for you the best. Some of them are : Bollinger bands, RSI and moving averages.
I really start to believe the simplicity is the key.Just a clean chart and good eyes!
I think for me indicators don`t work well. They really confuse me instead of helping me.
I really need to say thanks to @QuadPip for the videos he recommends me. In only a week I improve so much and i gain a lot of confident, i just need to find the consistency.
Can I just ask you people what is your % of winning trade in yours strategies?
Thanks
Glad to be of help.
You will find consistency in time. Learning to read market structure takes a little more work and practice than merely plotting and following indicators. Once you begin to get comfortable with it you will be able to spot key information at a glance and trading will become much easier. You will also be able to improve your win rate to 80% and higher in time. Just don’t give up the effort even when you feel like you’re not progressing. At intervals, you will see a jump in your level of understanding as you keep at it and practice diligently. These intervals vary from person to person.
May I ask anyone here how to make the right calculation of winning rate of a strategy?
@FOREXunlimited is always ask that to people
Avg winner
Avg loser
Max drawdown
Sharpe ratio
Risk of ruin
How can I calculate that?
Just getting ready when I will put my strategy here and he will ask that. 
A simple google search and a bit of effort will get you your answers