[B]EUR/USD: Ascending correction will shift into the decline in the pair[/B]
[B]1. Current trend of EUR/USD[/B]
The beginning of this week was favourable for the pair. EUR/USD went up to the level of 1.3120. The rise was driven by the positive Italian news that President of the country reached compromise and managed to create coalition government with several parties, including Democrats, the party of Silvio Berlusconi and the party led by Mario Monti.
However, good political situation in Italy was not able to cause the rise in the pair up to the key resistance level of 1.3120, although the pair made several unsuccessful attempts to break down this level. After that the pair started to decline slowly amid negative German data on retail sales. The decline was stopped due to the news about consumer confidence index as per GfK, which grew up to the level of 6.2 basis points, which is above expectations.
Attention today should be focused on the data on unemployment rate and consumer price index in Europe. The U.S. data on consumer confidence index Conference Board and index of labour costs will be of interest as well.
[B]2. Important levels (support and resistance)[/B]
At the moment the pair traded at the level of 1.3080. According to experts unemployment rate in Europe will go up to 12.1%, which is 1/10th more than the previous level. This news caused the decline in the pair to the level of 1.3000. Rumours about coming changes in the monetary policy of Eurozone continue to put pressure on the pair. Investors do not rush to invest into Euro because of unstable economic and political situation. In future the European currency is likely to continue to decline against the USD. Expected level is 1.2950 (1.2850).
[B]3. Best entry/exit points[/B]
In the current situation it is recommended to place short positions with profit taking at the level of 1.2950 (1.2850).
[B]4. Supporting facts[/B]
On the four-hour chart MACD histogram is in the positive zone above the signal line and is directed upward, indicating ascending correction, which will be followed by further decline.

Dmitry Likhachev
LiteForex
[B]USD/JPY: Technical analysis of 30.04[/B]
[B]1. Current trend[/B]
At yesterday’s trading the pair returned to the level of 98.2 and after that fell to the local lows of 97.3. However the “bulls” could not maintain at this level and after the release of the data on U.S. consumer sentiment index, the pair fell below the level of 97.6. It is difficult for the “bulls” to go up. If the pair USD/JPY falls below the level of 97, further movement down can reach 96-94. Until the end of this week the pair will trade in the narrow range. The U.S. data on a number of jobs excluding agricultural sector, which will be released on Friday, can cause weakening in the USD and the rise in the pair.

[B]2. Levels of support and resistance[/B]
At the moment the pair is testing support level of 97.75, next support levels will be 97.50 and 97.00. The latter one is the key level for the “bears” and in case of breakdown of this level, “bears” will get a chance to go further down. Support levels are 98.0, 98.20 and 98.50. However, the “bulls” are unlikely to go above the level of 98.20 in the near future.
[B]
3. Trading tips[/B]
It is advisable to trade starting from the boundaries of the channel at the level of 98.20-97.50. Sell orders are recommended after consolidation of the price below the level of 97.00. Buy orders are recommended at the level of 98.30.
[I]Ilya Lashenko
Analyst of LiteForex Group of Companies[/I]
1. Current trend
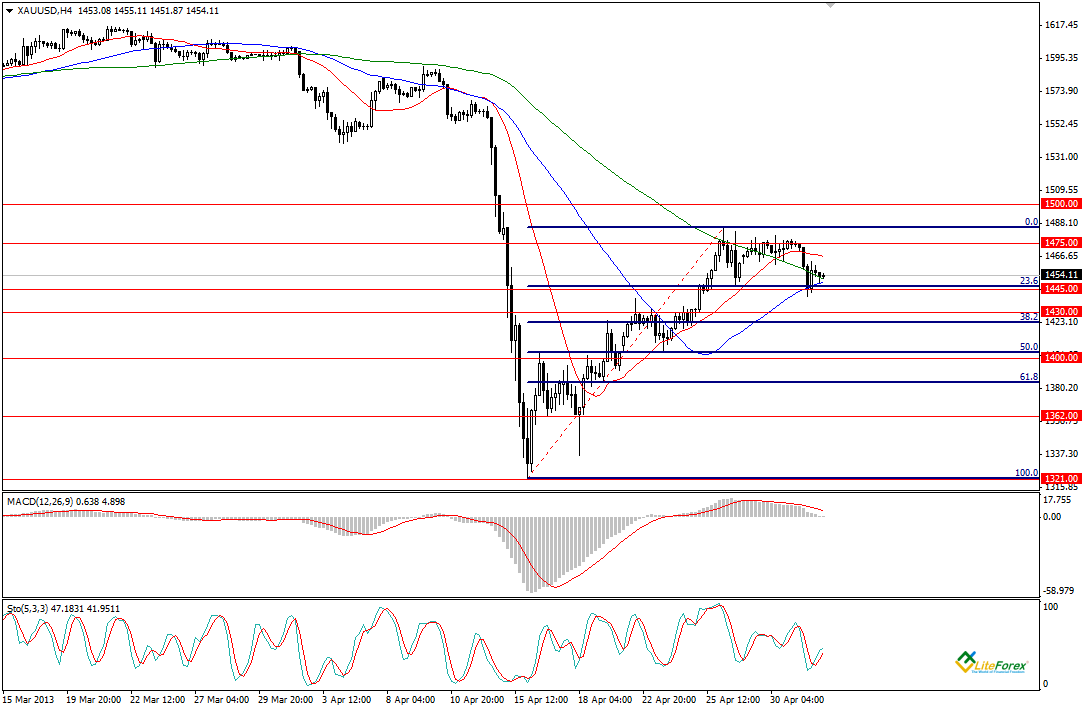
After sharp decline in the gold price in the middle April, gold is gradually regaining from losses. After reaching the level of 1584 USD per troy ounce, gold suspended growth and is presently in the consolidation phase. It is likely that today’s meeting of the Central Bank will have an impact of the price movement, as the interest rate will to be probably reduced by 25 basis points at the meeting. Tomorrow the data on the U.S. labour force excluding agricultural sector is scheduled for the release.
Technical indicators give mixed signals. MACD indicator shows the decline: the signal line is directed downward, volumes are decreasing. Stochastic is on the contrary shows the rise: both lines are directed upward.
2. Levels of support and resistance
The nearest support level is 1445.00, which coincides with the level 23.6 Fibonacci. Next support levels are 1430.00 and 1400.00. Resistance levels are 1475.00 and 1500.00.
3. Trading tips
If consolidation continues, trading can start from the channel boundaries of 1445.00-1480.00. Buy orders can be placed if the price consolidates above the level of 1500.00.
Ilya Lashenko
Analyst of LiteForex Group of Companies
GOLD: Analysis and Forecast
1. Current trend of XAU/USD
Reviewing changes in gold quotes at the hourly timeframe chart, we can observe formation of the ascending channel with the height of the channel of 1800 points. Intersection of the moving average line of Bollinger with the price chart from top to bottom also indicate ascending trend.
2. Important levels (support and resistance)
At the moment the nearest resistance level is 1481.30.
If this level is broken down, the price will continue to grow up to the top boundary of the channel. If gold fails to consolidate and rolls back from 1481.30, the price will continue to decline to support level of 1462.80. Breakdown of this level will confirm development of the downtrend to the level of 1451.80.
3. Best entry/exit points
The most feasible scenario is further growth of gold. It is recommended to place long positions with profit taking at 1481.30. In case of reversal and if the price crosses the moving average line of Bollinger from top to bottom, and if histogram of MACD indicator goes to the negative zone, it is recommended to sell with profit taking at the level of 1462.80.
Kamil Avad,
Analyst of LiteForex Group of Companies
AUD/USD: Analysis and forecast
1. Current trend
The pair AUD/USD has been declining for a month. At today’s meeting the Reserve Bank of Australia has lowered interest rate by 0.25%, from 3% to 2.75%. Therefore, although many analysts predicted that interest rate would be left unchanged, the Bank of Australia decided to make the change. Before that the pair traded near the level of 1.0240, but after the news was announced, the rate fell to the level of 1.018. Later, the rate corrected to the level of 1.02 and trading is likely to take place below this level.
Technical indicators do not show significant decline. On the most timeframes Stochastic is in the oversold zone. The signal line and histogram of MACD indicator are in the negative zone, indicating sideways movement. All three moving average lines are directed downward.
2. Levels of support and resistance
The nearest resistance level is 1.02, which is being actively tested by the “bulls” at the moment; however, it is unlikely that the “bulls” will break this level down. Nevertheless, if this level is successfully broken down, next resistance levels will be 1.0220 and 1.0260. The nearest support level is 1.0175, after that the “bears” will target at 1.0130.
3. Trading tips
The most feasible scenario is further decline in rate. Short positions are recommended starting from the level of 1.020, but do not forget about protective orders.
Ilya Lashenko
Analyst of LiteForex Group of Companies
[B]EUR/GBP: Economic performance of Europe can give new momentum to the further decline in the pair
- Current trend[/B]
The daily chart shows that the pair has traded in the narrow range of 0.8400 - 0.8490 since the begging of month, at the same time repeatedly testing the level 0.8400.
Economic data from Europe can trigger further decline in the pair. The data on orders in German industry will become known today. According to experts this index will show decline by half of percent against the growth of 2.3% for the previous period. On the contrary, the data from Great Britain can give investors confidence boost, as it is expected that housing price index will go up by half percent compared with the previous value, which will have a positive impact on the national currency.
2. Levels of support and resistance
The nearest resistance level is 0.8400, which the pair has been trying to break down since the beginning of May. Support level is 0.8495
3. Trading tips
In case of breakdown of the level of 0.8400, it is advisable to place short positions with profit taking of 0.8360. If the pair pushes off from resistance line, it is recommended to place buy orders with profit taking at the level of 0.8490.
Kamil Avad,
Amalysts of LiteForex Group of Compamies
USD/CAD: The data from Canadian labour market can trigger decline in the pair
1. Current trend of the currency pair USD/CAD
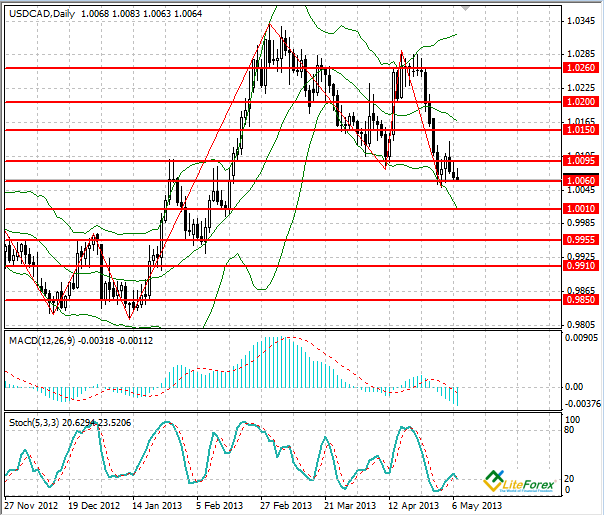
The currency pair USD/CAD has traded in the range of 1.0095-1.0060 since the beginning of the week. Last Friday the pair went down due to positive statistics on the American labour market and the number of jobs, excluding agricultural sector that increased by 165 thousand in April. Unemployment rate fell to 7.5%. The Canadian dollar is also supported by the data on Canadian construction sector: number of permit to construct in Canada increased up to 8.6%, giving hope that business activity in construction sector will increase, which will trigger downward movement in the pair.
2. Important levels (support and resistance)
Despite positive news, the pair USD/CAD still traded in the range of 1.0095-1.0060 and this trend will continue in the near future. Market is consolidating, preparing for Friday, when fundamental data on employment and unemployment rate in Canada for April will be known. If the data will be positive, as has been predicted, the price may go down to the levels of 1.0010, 0.9955 and 0.9910. Otherwise, reversal will be possible and the price may go up to the levels of 1.0150, 1.0200 and 1.0260. It is likely that short-term trading in the channel will take place. If the price consolidates below the level of 1.0060-1.0050, short positions can be opened with profit taking at the level of 0.9910.
3. Technical indicators
On the daily chart “Bollinger bands” indicator demonstrates divergence of the lines, indicating downtrend. The price chart is in the bottom band. MACD histogram is in the oversold zone, volumes continue to increase. The lines of Stochastic are directed downward and will form a sell signal in the near future.
Dmitriy Zolotov
Analyst of LiteForex Group of Companies
EUR/USD: Analysis and Forecast
1. Current trend
Eurozone does not demonstrate a lot of positive data, although the bulls tried to pull the pair up last week. However, after facing strong resistance at the level of 1.3250, the price has reversed. On the chart we can see that the pair was not able to overcome this level and started to go down amid positive U.S. data.
At the opening of European session yesterday the price went up; however the American session set the record straight, and quotes rolled back to the opening price of European session.
At the moment the price is likely to go down to the level of 1.3030 and test this resistance level.
2. Levels of support and resistance
The pair will face the nearest resistance at the level of 1.3030. It is likely that the pair will overcome this resistance level due to negative data on German industrial output, and will go to the level of 1.2990.
3. Supporting facts (technical indicators)
On the daily timeframe we see rebound from the upper boundary of Ichimoku indicator: the pair is moving to the bottom boundary of the cloud at 1.2950. The point of price rebound from the upper boundary of the cloud coincides with corrective level of “bearish” trend on Fibonacci lines-50%. Therefore, all corrections are over and there is a chance that the price will continue to decline to resistance level of 1.2950 – the level of 23% of Fibonacci lines.
4 Trading tips
In case of breakdown of the level of 1.3030, it will be sensible to place short positions with profit taking at the level of 1.2990. It is also possible that the second wave of correction of the April “bullish” trend will go to the level of 50% Fibonacci, which will confirm a chance of decline in price. In case of breakdown of the level of 1.2990, it is recommended to place short positions with profit taking near 1.2950.
Kamil Avad,
Analysts of LiteForex Group of Companies
AUD/USD:Rreview
1. Current trend of AUD/USD
Yesterday the Reserve Bank of Australia suddenly reduce the key interest rate up to the record low level of 2.75%, while analysts expected that the rate would be left unchanged at the level of 3%. Interest rate has been lowered for the seventh time over the past 19 months. Due to this fact, AUD/USD rate fell by almost 100 points. Easing of the monetary policy of Australia was caused by the positive data on inflation in the country. In addition, China, which is one of the main trading partners of Australia, demonstrates slowdown of economic development. During today’s trading session the AUD grew up slightly against the USD due to positive data from China. Foreign trade balance increased by +18.16 billion USD against expected 15.05 billion USD. Chinese exports rose by 14.7% against the forecast of 10.3%.
2. Important levels (support and resistance)
Resistance levels: 1.0210, 1.0230 and 1.0255.
Support levels: 1.0170, 1.0154 and 1.0117.

Alexander Fries
Analyst of LiteForex Group of Companies
[B]XAU/USD: Gold continues to consolidate
- Current trend[/B]
Gold still traded in the narrow range of 1475.00-1445.00 USD per troy ounce. Yesterday the metal was under pressure and the price fell to the bottom limit of the channel. Investors put a stop to gold trade, focusing on the American stock market, where stocks have demonstrated growth lately. It is likely that the price will rebound from the level 23.6 Fibonacci and go up to the top limit of the channel. Stochastic indicator is in the overbought zone, indicating growth. MACD shows sideways movement: the signal line and histogram are near the zero line.

[B]2. Levels of support and resistance[/B]
Yesterday, the pair tested support level of 1445.00, which was strong and prevented further decline in price. Next support level is 1430.00. The nearest resistance level is 1465.00. If this level is broken down the price will go up to 1475.00 and 1490.00.
[B]
3. Trading tips[/B]
The most feasible scenario is the rise in gold; therefore it makes sense to open long positions with the target to take profit near 1475.00.
[I]Ilya Lashenko
Analyst of LiteForex Group of Companies[/I]
EUR/USD: The pair will test new local highs and go down
1. Current trend of EUR/USD
Yesterday European currency went up against the USD. Growth in the pair was provoked by strong economic data on German industrial output, which amounted to 1.2% against the forecast of 0.1%. The pair went up, breaking down resistance level of 1.3120, which triggered the increased in demand of Euro.
The pair almost reached the level of 1.3200, after that it fell and continued trading in the sideways correction near the level of 1.3155. European news is not expected today, and sharp movement in the pair is not expected either. Minor movement can be driven by British news. Tomorrow attention should be paid to German data on imports and exports. Experts believe that these indices will grow.
2. Important levels (support and resistance)
Due to unexpectedly strong economic data from Germany, the pair strengthened and at the moment traded at the level of 1.3160. The pair may continue to grow due to positive German data at the end of this week and will probably reach key resistance level of 1.3250. However, the growth will be only temporarily and in future the pair will decline. Expected levels in the medium-term are 1.3200 (1.3250), 1.3120 and 1.3000.
3. Best entry/exit points
It is advisable to place short positions with profit taking at the level of 1.3000 (1.2950). it is also recommended to place short pending orders at the level of 1.3200 (1.3250) with profit taking at the level of 1.3000.
4. Supporting facts
On the daily chart Ichimoku indicator confirms the forecast, it is highly probable that the pair will go down to the bottom limit of the cloud, which coincides with important resistance level of 1.2950 (1.2900), after that the pair will push off from the upper limit of 1.3250.
Dmitriy Likhachev
Analyst of LiteForex Group of Companies
AUD/USD: The pair is weakening in advance of the speech of the U.S. Fed chairman
1.Current trend of the currency pair AUD/USD
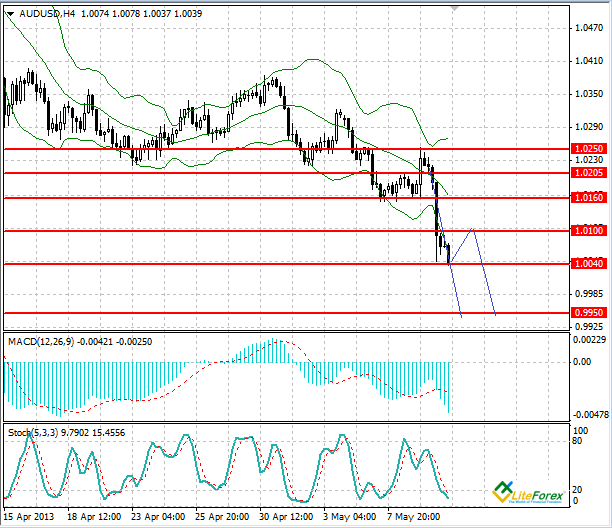
The currency pair AUD/USD has traded in the narrow range of 1.0205-1.0160 since Tuesday; however on Thursday, after the release of positive data from Australian labour market, the price tried to reach resistance level of 1.0250, as part of ascending correction, but failed to break it down. After that the pair rapidly declined and within 24 hours it lost about 200 points, reaching the lows since June last year. The rise in demand for the USD among investors was triggered by assumption that improvement of American economy and decline in unemployment rate up to 7.5% in April, will lead to curtailing of quantitative measures by the U.S. Fed.
2.Important levels (support and resistance)
At the moment the pair is actively testing support level of 1.0050-1.0040, and if this level is exceeded, the price can fall to 0.9950 and 0.9800. During the day ascending correction to the level of 1.100 may take place, however it will not affect general downward movement. In the current situation it is advisable to place short positions from the level of 1.0030 with profit taking at the level of 0.9800.
3.Technical indicators
On the four-hour chart “Bollinger bands” indicator does not demonstrate divergence of the lines, confirming continuation of the downtrend. The price chart has recently broken down the lower line, giving a chance of temporary ascending correction. Histogram of MACD indicator is in the oversold zone and volumes are increasing. The lines of Stochastic have crossed oversold line (20), suggesting that price will continue to decline.
Dmitriy Zolotov
Analyst of LiteForex Group of Companies
AUD/USD. Пара слабеет в ожидании выступления главы ФРС (10.05.2013)
1.Текущая динамика валютной пары AUD/USD
Валютная пара AUD/USD со вторника торговалась в узком диапазоне 1.0205-1.0160, однако в четверг, после публикации позитивных данных с австралийского рынка труда, цена предприняла попытку восходящей коррекции, но протестировав уровень сопротивлений 1.0250, не смогла его преодолеть. После этого началось резкое падение пары, и в течение суток она потеряла около 200 пунктов, достигнув минимальных значений с июня прошедшего года. Спрос на доллар со стороны инвесторов был вызван предположениями о том, что улучшение состояния американской экономики и снижение уровня безработицы в апреле до 7,5% приведут к свертыванию части мер количественного смягчения Федеральной Резервной системой США.
2.Важные уровни (поддержка и сопротивление)
В настоящее время пара активно тестирует уровень поддержки 1.0050-1.0040, и в случае его преодоления, что наиболее вероятно, цена может опуститься к уровням 0.9950 и 0.9800. В течение дня возможна небольшая восходящая коррекция к уровню 1.100, но общая картина нисходящего движения не изменится. В сложившихся условиях наиболее актуально открывать короткие позиции от уровня 1.0030, с фиксацией прибыли на уровне 0.9800.
3.Показания технических индикаторов
На четырехчасовом графике индикатор «Полосы Боллинджера» демонстрирует расхождение линий, подтверждая продолжение нисходящего тренда. График цены пробил нижнюю линию, что дает некоторую вероятность временной восходящей коррекции. Гистограмма индикатора MACD находится в зоне перепроданности и объемы ее увеличиваются. Линии Стохастика также пересекли линию перепроданности (20), что говорит о продолжении падения цены.
Дмитрий Золотов
Аналитик группы компаний LiteForex
1. Current trend
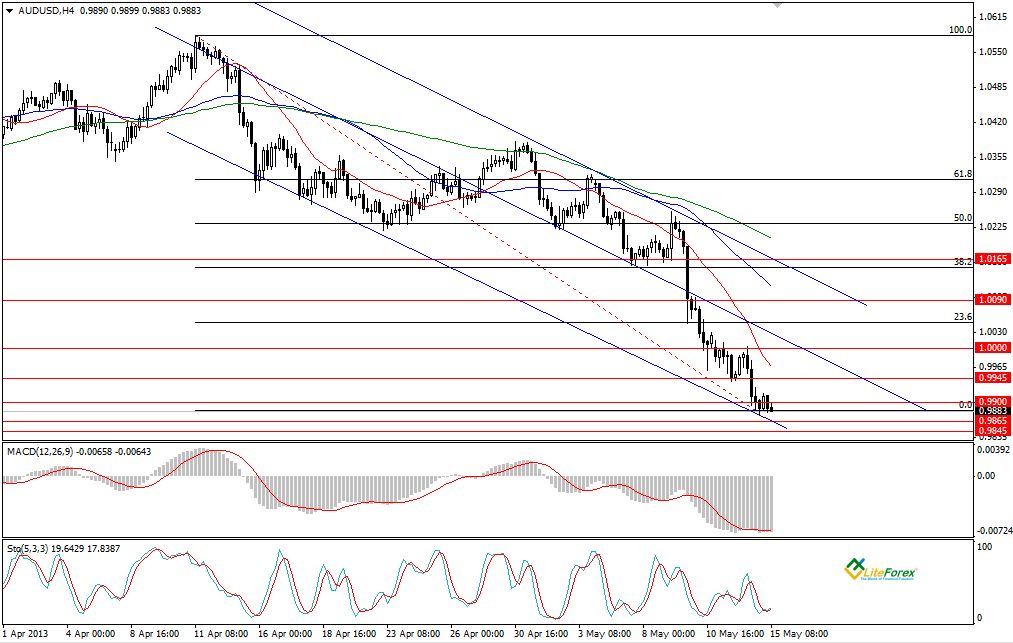
The pair has been in the downward channel for the whole month and is unlikely to change direction. Last week AUD/USD sharply went down to the level of 1.0000, which was successfully exceeded. This decline was 11-month lows for the pair.
At the moment the pair traded near the level of 0.9900 and it seems that the pair is going to test this level for some time.
Technical indicators do not give clear directions. Stochastic is in the oversold zone, indicating sideways movement. Histogram and signal line of MACD indicator are in the overbought zone, demonstrating sideways direction. All three moving average lines are directed downward.
2. Levels of support and resistance
The nearest resistance level is 0.9900, which is being tested at the moment; next resistance levels are 0.9945 and 1.0000. The nearest support levels are 0.9865 and 0.9845.
3. Trading tips
It is most likely that the rate will continue to decline; however correction to the level of 0.9945 is also possible. In case of correction it is advisable to place pending orders to buy. The main target of the “bears” is the level of 0.9845, which is the best level for taking profit.
Ilya Lashenko
Analyst of LiteForex Group of Companies
1. Current trend
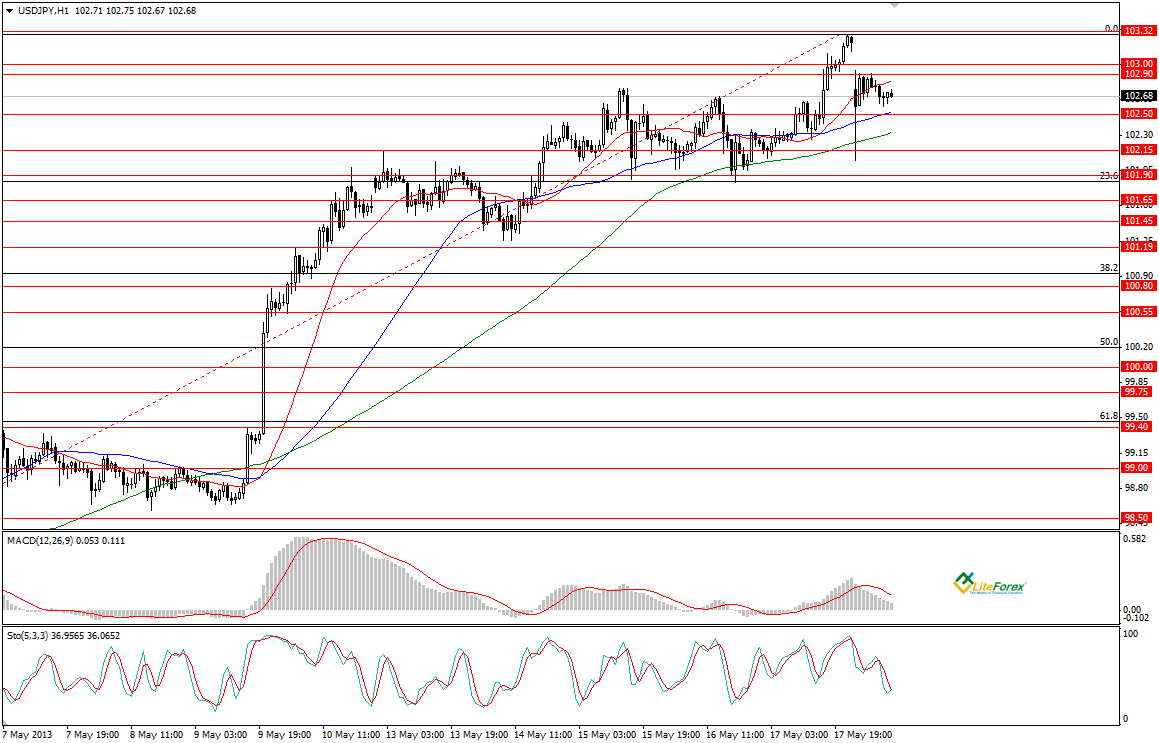
Last week the pair reached new highs at the level of 103.30 and completed trading session at the level of 103.10. Opening session started with the gap and the price almost immediately fell to 102 yen per USD; however later the price went up to the level of 102.7, and is still trading at this level.
Technical indicators give mixed signals. MACD shows the decline: the signal line is directed down, volumes continue to decrease. Stochastic is near the moving average line and is giving a buy signal.
2. Levels of support and resistance
The nearest support level is 102.5, if this level is broken down, the price will go down to 102.15 and 101.9. Resistance is the level of 102.9. This level has been tested today and prevented the rise in price. The main target of the bulls is the level of 103.30.
3. Trading tips
It is likely that the price will move in the channel 103.00-101.90. It makes sense to place pending orders and trade from the boundaries of the channel.
Ilya Lashenko
Analyst of LiteForex Group of Companies
USD/CAD: Two-week growth may shift into the decline
1. Current trend of the currency pair USD/CAD
This week the currency pair USD/CAD has traded in the range of 100 points. The pair went up and reached three-month highs at the level of 1.0340 due to expectations that the U.S. Federal Reserve would curtail some of the incentive measures. However, after the statements of several American senior officials that bond purchase program should be continued, the price has corrected and at the moment traded at the level of 1.0270.
2. Important levels (support and resistance)
It is likely that the price will continue go up to 1.0300, as the Canadian currency is under pressure from the decline in commodity prices and expectations of the decrease of retail sales volume in Canada. The level of 1.0300 seems as the key one, and the price may push off from this level and start long-term downward movement to the levels of 1.0170, 1.0110, 1.0060 and 1.0000.
Note, that chairman of the U.S. Federal Reserve Ben Bernanke will give a speech today and minutes of the last meeting of the Federal Reserve will be released. The minutes can shed the light on the further actions of the American monetary authorities. It is expected that quantitative easing program will not be curtailed so far, which can trigger downward movement in the pair.
In the current situation it is advisable to open short-term buy positions from the level of 1.0280, sell positions are recommended starting from the level of 1.0300 with profit taking near 1.0170.
3. Technical indicators
On the daily chart “Bollinger bands” indicator does not show significant divergence of the line; the price chart has reached the top line, giving a chance of reversal movement to the moving average. MACD histogram is in the overbought zone, its volumes are increasing. Stochastic lines are directed downward and are forming a signal of downward movement in price.
Dmitriy Zolotov
Analyst of LiteForex Group of Companies
Forex: Ichimoku Clouds: Review of XAU/USD
XAU/USD, H4
Look at the four-hour chart. The line Tenkan-Sen has crossed Kijun-Sen from bottom to top under the cloud, forming the pattern “Golden cross”. The line Chinkou Span is approaching the price chart from below; current cloud is descending. The price has gone above the line Tenkan-Sen, which becomes the nearest support level (1380.42). Next obstacle on the upward way of price is the bottom boundary of the cloud (1416.45-1407.86).

XAU/USD, D1
On the chart with the timeframe D1 the line Tenkan-Sen is below Kijun-Sen, and is directed sharply downward. The line Chinkou Span is above the price chart; current cloud remains downward. The nearest resistance level is the line Tenkan-Sen (1406.89). Estimated level of support is one of the previous extremums of the line Chinkou Span (1385.46).

Key levels
Resistance levels: 1416.45-1407.86 and 1406.89.
Support levels: 1380.42 and 1385.46.
Trading tips
On the four-hour chart the price went up above the levels of Tenkan-Sen and Kijun-Sen because of pressure from the “Golden cross,” however, failed it to reach the lower boundary of the cloud. It is the best moment for opening long positions with the targets of 1416.45-1407.86. The chart of the higher timeframe has not yet confirmed trend reversal, as the price was not able to consolidate above the level of Kijun-Sen.
Anastasiya Glushkova
Analyst of LiteForex Group of Companies
1. Current trend
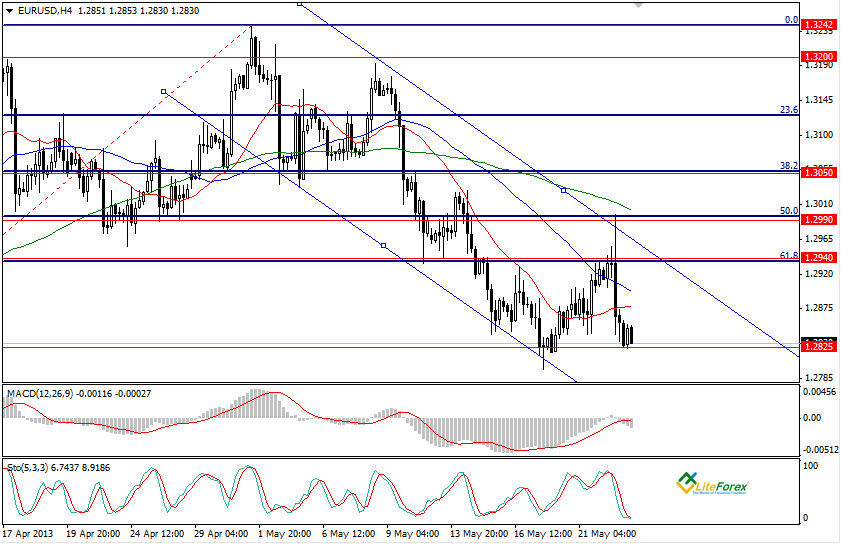
Look at the four-hour chart of the pair EUR/USD. Since the beginning of the month the pair has moved in the downward channel. Yesterday the “bulls” tried to leave the channel and change the trend; however they failed, as resistance levels, which coincided with Fibonacci 50.1 and 61.8 blocked the way. Most indicators show further decline in rate. All three moving average lines are lined up in the downward order. The signal line and histogram are in the negative zone. Stochastic is in the oversold zone; both lines of the indicator are directed downward, indicating the decline.
2. Levels of support and resistance
The nearest support level is 1.2825. Next after it will be 1.2760 – it is the key level and if it is broken down, the price will go further down. Resistance levels are 1.2940 and 1.2990, which have recently prevented the rise in price.
3. Trading tips
The most feasible scenario is the decline of rate up to the level of 1.2760. It is also possible that the price will move in the channel of 1.2940 -1.2825; therefore it makes sense to set sell limits at the upper boundary.
Ilya Lashenko
Analyst of LiteForex Group of Companies
High level of analysis, as you learn
1. Current trend
The week before last gold was in the downtrend, reaching the lows of 1340 USD per troy ounce. Investors actively sold gold amid recovery of the US economy and rumours that government might curtail asset purchase program.
Last week gold was trading in the range of 1360-1400.
This Monday trades were quiet, as markets in the US were closed due to Memorial Day and some banks in the UK and EU had a day off.
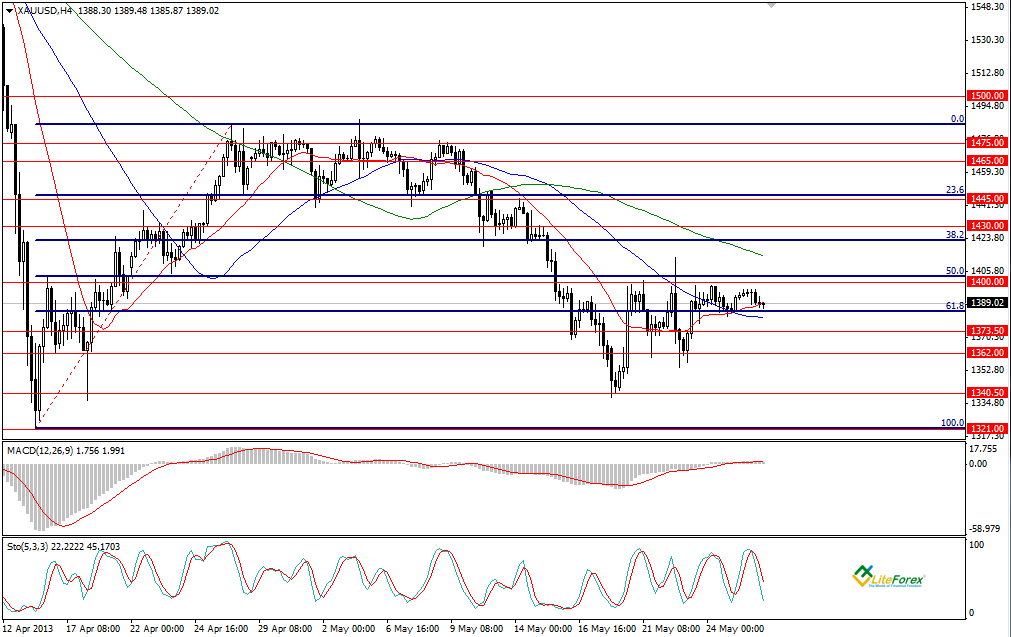
Technical indicators do not give clear signals. Stochastic shows further decline: both of its lines are directed downward. Histogram and the signal line of MACD indicator are near the zero line, indicating sideways movement.
2. Levels of support and resistance
At the moment the pair is near 61.8 Fibonacci line - this is a support level, which is being tested. Next support levels are 1373.50 and 1362; main target for the “bears” is the level of 1321.00.
The nearest resistance level is 1400, which coincides with the level of 50.0 Fibonacci.
Next levels for the “bulls” will be 1430.00 and 1445.00.
3. Trading tips
It is recommended to place short positions below the level of 1375.00. Buy positions are recommended above the level of 1410. It also makes sense to place pending buy orders near the figure 1340.
Ilya Lashenko
Analyst of LiteForex Group of Companies


