1. Current trend
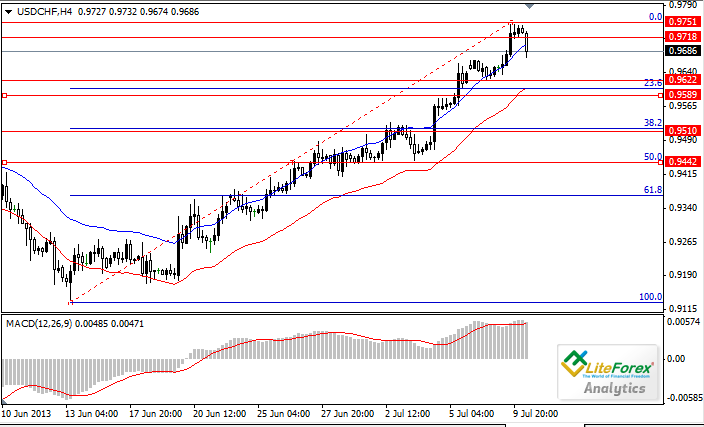
From the beginning of the June the pair USDCHF has been rising and has reached 0.9751. Now we can see a small correction. Today the pair will be testing new levels at 0.9622 and 0.9589. The vector ot the future movement will be decided today after the speech of chairman of the Federal Reserve, Ben Bernanke. We anticipate some economic statistics from USA: reduction of general sales and increase of inventory holdings by 0.3%. It can be a sign of overstock and stagnation in this field of economy. But we doubt the date will affect the pair’s movement.
2. Support and resistance
The resistance levels for the correction are 0.9622 and 09589; support levels are 0.9751 and 0.9718.
3. Technical indicators
The price chart crosses the upper line of Envelopes indicator, producing a signal to sell. Signal line of MACD indicator is in positive zone and is going to leave histogram area.
4. Trading tips
We recommend to sell as soon as MACD gives a confirming signal (signal line is out of histogram zone). From the other hand it is possible to open long trades when the price overcomes the levels 0.9718, 0.9751.
Kamil Avad
Analyst of LiteForex Group of Companies
Forex: Ichimoku Clouds. Review of USDCAD
USDCAD, H4
Let’s look at the four-hour chart. Tenkan-Sen line is below Kijun-Sen line and they are both horizontal. Chinkou Span line is below the price chart, current Kumo-cloud is descending. Since yesterday the pair has been falling, but this morning we can see a small rebound. The closest resistance level is Tenkan-Sen line (1.0433). One of the previous extremums of Chinkou Span line is expected to be a support level at 1.0195.

USDCAD, D1
On the daily chart Tenkan-sen line is above Kijun-sen, but the blue one is directed downwards. Chinkou Span line approaches the price chart from above; current Kumo-cloud is ascending. After long rise the pair has collapsed and broken down Tenkan-Sen and Kijun-Sen levels. The next obstacle for the price on its way down will be the upper border of the cloud at 1.0279-1.0263. The closest resistance level is Kijun-Sen line (1.0372).

Key levels
Support levels: 1.0195, 1.0279-1.0263.
Resistance levels: 1.0433, 1.0372.
Trading tips
On the four-hour chart the price has slowed down, but we expect a new “bearish” impetus. On the chart with higher timeframe a confirming signal to sell will appear as soon as Tenkan-Sen and Kijun-Sen lines are crossed or Chinkou Span line crosses the price chart.
Anastasiya Glushkova
Analyst of LiteForex Group of Companies
Forex: Ichimoku Clouds. Review of AUDUSD
AUDUSD, H4
On the four-hour chart Tenkan-sen line is above Kijun-sen, the red line is directed upwards, but the blue one stays horizontal. Chinkou Span line is above the price chart, current Kumo is ascending. Since yesterday the price has been fluctuating within a channel corresponding to the cloud. A strong resistance level is flat Kumo top at 0.9191. The resistance level is Senkou Span A line (0.9127).

AUDUSD, D1
Let’s look at the daily chart. Tenkan-sen line is below Kijun-sen, and the price is squeezed between them. Chinkou Span line is below the price chart, current Kumo is descending. Kijun -sen line remains the closest resistance level at 0.9351. One of the previous minimums of Chinkou Span line is expected to be a resistance level at 0.8816.

Key levels
Support levels: 0.8816, 0.9127.
Resistance levels: 0.9191, 0.9351.
Trading tips
On the four-hour chart the price is still within the cloud borders, it is not advisable to open new trades. The further movement of the price will be determined by the breakdown of one of the cloud borders. The chart of the higher timeframe confirms the descending trend.
Anastasiya Glushkova
Analyst of LiteForexGroup of Companies
GBPUSD: Reversal of the trend
1. Current trend
This Thursday British currency was strengthening. Startled by the Bernanke’s speech investors were buying pound. Demand of dollar has decreased. Negative statistics on labor market has affected American currency. Unemployment claims haven’t confirmed the forecast and had risen up to 360 000. Under the pressure of these facts the pair GBPUSD hit 1.5200. Today we anticipate European news — an industrial production index. Among the macroeconomic statistics from US we highlight Producer Price Index, Consumer Sentiment Index and we’re waiting for the speech of FOMC member Bullard.
2. Important levels: support and resistance
The pair has consolidated around resistance level at 1.5200; we expect further descending correction towards support levels 1.5100-1.5050. A strong rise is highly unlikely. Despite the prolongation of QE program dollar is supported by positive economic statistics and won’t probably fall. The reversal of the trend seems to be the most obvious scenario. After slight decline the pair will go all the way up to 1.5310.
3. Best exit/entry points
We suggest to open long trades with Take Profits at 1.5310. Pending orders can be placed at 1.5100-1.5050 with Take Profits at 1.5300.
4. Supporting facts
MACD histogram on the four-hour chart has moved to positive zone, it is above signal line and is directed upwards. This is a sign of trend reversal.

Dmitry Likhachev
Analyst of LiteForex Group of Companies
1. Current trend
The pair is trading between 38.2% and 50.0% of Fibonacci lines near bottom border of the uprising channel. As we can see on the chart, the price is within a triangle pattern. The breakthrough of its upper bound will indicate end of the correction. American dollar has pulled the pair USDCHF up. It can destabilize the “European safety bay”, which attracts investors in the time of troubles in global economy. Positive statistics from USA will encourage further rise of dollar. Today TIC long-term purchases volumes will be published. Experts anticipate the increase of the volumes, which makes the American economy more attractive for foreign investors. Industrial production rate is expected to increase 0.3%, as well as consumer price index. The index is an early indicator of consumer inflation, the increase of its rate makes consumption more profitable than saving. This process can provoke an economic growth.
2. Support and resistance
Support levels are 0.9441 and 0.9410 levels, resistance levels — local maximums at 0.9515 and 0.9537.
3. Trading tips
Regarding positive statistics from the New World it is obvious to open long trades with Stop Loss orders at 0.9410 and Take Profit orders at 0.9605.
Kamil Avad
Analyst of LiteForex Group of Companies
[B]1. Current trend[/B]
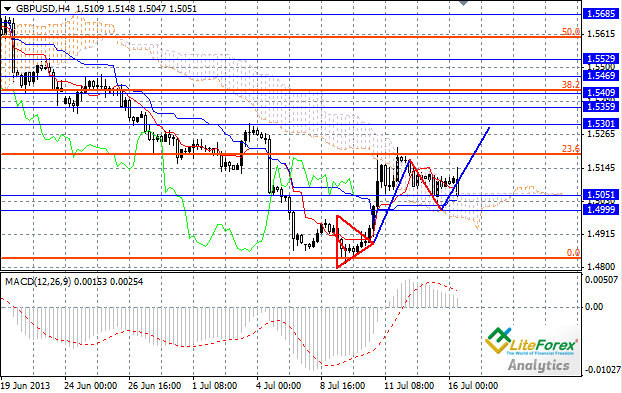
This Monday pound against dollar was trading humbly around 1.5100 level. Low volatility can be a sign of the calm before storm. This morning GBPUSD was trying to go up to the local maximum, but the effort was in vain. Many analysts and investors anticipate the release of macroeconomic news from UK, which is going to be controversial. Besides, important US statistics are going to be released today and can affect the movement of the price.
[B]2. Important levels: support and resistance[/B]
If the data from UK is positive, the price will probably rise towards resistance level 1.5200-1.5310. After that an uprising movement will turn into fall down to support level 1.5000, as a result of forcible statistics from US. The decline of demand for the pound will also bring pressure on the pair. The main news this week is still Ben Bernanke’s speech, which can surprise traders and investors. Two last speeches were controversial and investors are trying to figure out the perspectives of monetary police of USA.
[B]3. Best entry/exit points[/B]
We would suggest to place sell limit orders at 1.5200-1.5310 level with Take Profit orders at 1.5000. After that we expect the development of ascending trend.
[B]4. Supporting facts[/B]
MACD histogram on the four-hour chart moves to the positive zone. It is above signal line and is directed upwards indicating the reversal of the trend and further ascending movement.
Dmitry Lihachev
Analyst of LiteForex Group of Companies
1. Current trend
The pair AUDUSD has started this week with a 200 points rise hitting 1.9260 on Tuesday. The momentum for the uprising movement has been created by the publication of Monetary Policy Meeting Minutes. RBA doubts that liberalization of monetary policy is needed. The price has bounced off 1.9260 level, which correspond to the upper border of the descending channel, and has returned to fall.
2. Important levels: support and resistance
In the near future we expect the price to fall down to 0.9140 and 0.9060 levels. Don’t forget Bernanke’s speech in US Congress on the economic conditions this Thursday. If the situation is announced positive, the pair may decline and hit new lows. For now we would suggest to open short positions at 0.9200 with Take Profit orders at 0.9660.
3. Technical indicators
On the four-hour chart Bollinger Bands don’t show any important divergence. The price chart has bounced off the upper line and is directed towards the MA. It can be seen as a promise of decrease towards 0.9140 and even 0.9060. MACD histogram is in overbought zone. Stochastic lines is leaving overbought zone (80) and a signal to buy is developing.
Dmitriy Zolotov
Analyst of LiteForex Group of Companies
1. Current trend
The pair has corrected to 38.2% Fibonacci line and is trading in downward channel now. There are two possible scenarios: decline within downward channel or reversal to the low pitched upward channel. Today’s economic releases will decide the destiny of the pair. According to experts Foreign Securities Purchases rate will be 10.23 milliards comparing to the previous 14.91 milliards. Building Permits and Housing Starts are also going to rise. The main triggers will be BOC and FRS statements. Investors anticipate the clearness of QE program question. If Bernanke confirms the reduction of money infusions this September, we will witness strengthening of American dollar. Otherwise, short decline is possible.
2. Support and resistance
Support levels for the “bullish” trend are 1.0377 and 1.0360. The pair is now trading around them. Resistance levels are 1.0432 and 1.0442.
3. Trading tips
We would suggest to buy at current price with target at 1.0466. Though further descending movement is probable.
Kamil Avad
Analyst of LiteForex Group of Companies
[B]1. Current trend [/B]
This week started with the ascending movement in European currency against the USD; the pair is supported by the increasing demand for Euro and strong European macroeconomic statistics. The pair has hardly reacted to the decline in the business sentiments of Germany, the same index in Europe rose up to the level of 32.8. Today’s indices in the construction sector of Europe have not yet affected the price movement: the pair continues trading near the level of 1.3150. Reputable analysts and investors are waiting for the speech by Ben Bernanke, scheduled for 17-18 July. Changes in the US oil inventories are also worth of attention.
[B]2. Important levels: support and resistance[/B]
At the moment the pair consolidates near the key resistance level of 1.3150. It is likely that starting from this level downward correction to support levels of 1.3100 and 1.3050 will take place. After that uptrend will resume, key resistance level of 1.3150 will be broken down and the pair will continue to go to the new local highs of 1.3250 and 1.3415. However we should not forget about important catalyst, that is the change in the US monetary policy. The news of this week is the speech of the US Fed chairman Ben Bernanke, which, as usual, can spring surprises to traders and investors. His last two speeches were contradictory and now investors have to understand what Bernanke had in mind and what will happen to the US monetary policy.
[B]3. Best entry/exit points[/B]
In the current situation it is advisable to place buy orders from the levels of 1.3100 and 1.3050, keeping in view the rollback and continuation of the ascending trend. It is recommended to take profit at the level of 1.3250, for the long-term strategies- at 1.3400.
[B]4. Supporting facts[/B]
On the four-hour chart MACD histogram is in the positive zone above the signal line and is directed upward, indicating continuation of the ascending trend.

Dmitriy Lihachev
Analyst of LiteForex Group of Companies
[B]1. Current trend [/B]
On Wednesday the British currency received tremendous support from the members of the UK Monetary Policy Committee, who unanimously decided not to make changes in the monetary policy due to positive statistics in for the last quarter and general economic stability. With the help of support provided by macroeconomic indices, the pair GBPUSD soared up by more than 150 points.
Before the speech of the US Fed chairman Ben Bernanke the pair was volatile, first reaching the local highs of 1.5265 and then going below the level of 1.5200. The speech by Ben Bernanke was positive. He highlighted that program of assets purchase will be minimized by mid-2014, if unemployment rate will amount to 7% by this time.
However the program can be suspended later or earlier than planned depending on the forecast of the labor market. Investors assessed Bernanke’s speech as positive and the USD started to grow, while the pair GBPUSD fell to the level of 1.5160. Attention today should be paid to the next speech of the US Fed chairman and on the publication of the retail sale index in UK.
[B]2. Important levels: support and resistance[/B]
In the current situation it is likely that the pair will decline due to USD strengthening and weak data on the British retail sales. Later ascending trend will resume. The decline will reach support level of 1.5100-1.5050 and after that the pair will grow to the new local highs of 1.5300-1.5410.
[B]3. Best entry/exit points[/B]
We would recommend to place long pending positions from the level of 1.5050-1.5100 with profit taking at the level of 1.5300.
[B]4. Supporting facts[/B]
On the four-hour chart MACD histogram is in the positive zone above the signal line and is directed upward, indicating that ascending trend will continue.

Dmitry Likhachev
Analysts of LiteForex Group of Companies
1. Current trend
The pair has been moving in the wide ascending channel throughout a month. European currency is gradually regaining positions against the Yen, periodically experiencing correction. At the moment the pair is not far from the local highs, which was reached this May.
On Monday election to the upper House of the Japanese Parliament will take place. It is assumed that the ruling party will win the majority of seats. Thus, the government will receive support for the required reforms.
Technical indicators demonstrate growth in the pair. Stochastic is in the neutral zone; however both lines of the indicator are directed upward. Histogram and the signal line of MACD indicator are in the positive zone, volumes continue to increase slowly. All three moving average lines are directed upward, indicating growth.
2. Levels of support and resistance
The main resistance, which keeps down further rise in the pair is the level of 131.50. Next resistance levels will be 132.00 and 132.50. Support levels: 131.00, 131. 20 and 131.00.
3. Trading tips
If the price consolidates above the level of 131.50, it is advisable to open long positions However if resistance will be strong, preventing the rise in the pair, it is advisable to open short positions with the target at the level of 130.30.
Ilya Lashenko
Analyst of LiteForex Group of Companies
[B]1. Current trend[/B]
Yesterday macroeconomic news from USA didn’t meet the investors’ expectations. The released data were negative comparing to the forecasts. However dollar has strengthened its positions thanks to the speech of FRS chairman. He announced that inspite of economic recovery FRS is not going to curtail QE program until 2014. Indicators of the Bernanke’s success will be reports on Unemployment claims. Experts predict decrease of the index down to 344000 rate. If the actual rate is lower than that of the forecast, American currency will have an extra support.
[B]2. Levels of support and resistance[/B]
Support levels are 0.9377 and 0.9407; resistance level will be at the local maximum (0.9454).
[B]3. Technical indicators[/B]
Moving Average of MACD indicator has left the histogram zone. The histogram itself is in negative zone. There is a signal to buy. The other signal to buy has been formed by the crossing of bottom Envelopes line and the price chart.
[B]4. Trading tips[/B]
I would recommend to buy at the current price with Take Profit orders at 38.2% Fibonacci line (0.9515). Stop Loss orders should be placed at 0.9377.

Kamil Avad
Analyst of LiteForex Group of Companies
1. Current trend
The pair is trading with a decrease around lower border of the uprising channel. On the four-hour chart we can see that the course has corrected twice to the level of 38.2% Fibonacci line. It is highly probable that we will witness further fall down to the point of 1.0323 and even lower. Though Bernanke has assured the investors that US economy is stable, American dollar takes its time to strengthen. The currency can be affected by FRS intentions not to curtail the QE program until 2014. It may cause short-term decline of the course of the instrument.
2. Support and resistance
Support levels are 1.0354 and 1.0324; the resistance will be at 1.0408 and 10432 levels.
3. Trading tips
Long trades with targets at 1.0324 can be opened after the breakdown of the lower border of the channel. As an alternative I would expect the price to rise up to 1.0432 or even higher to the level of 61.8% Fibonacci lines (1.0499).
Kamil Avad
Analyst of LiteForex Group of Companies
[B]EURGBP, H4[/B]
Let’s look at the four-hour chart. Tenkan-Sen line is below Kijun-Sen, and they are both directed downwards. Chinkou Span line is below the price chart, current cloud has reversed from ascending to descending. The price is within the cloud and is trying to break down its flat bottom, which becomes a strong support level at 0.8588. The nearest resistance level is Tenkan-Sen line at 0.8618.

[B]EURGBP, D1[/B]
On the daily chart Tenkan-Sen line is above Kijun-Sen and the price is enclosed between them. Chinkou Span line is above the price chart, current Kumo-cloud is ascending. Kijun-Sen (0.8589) and Tenkan-Sen (0.8643) lines have become support and resistance levels respectively.

[B]Key levels[/B]
Support levels: 0.8588-0.8589.
Resistance levels: 0.8618, 0.8643.
[B]Trading tips[/B]
On the four-hour chart the price is stuck within the cloud. The breakdown of its flat bottom will be a signal to sell. The chart of the higher timeframe confirms the strong support level at 0.8588-0.8589. It is highly probable that the price will bounce off this level and go up.
Anastasiya Glushkova
Analyst of LiteForex Group of Companies
Forex: Ichimoku Clouds. Review of GBPUSD
GBPUSD, H4
On the four-hour chart Tenkan-sen line is above Kijun-sen, and they are both horizontal. Chinkou Span line is above the price chart, current Kumo is ascending. Since last week the pair has been rising strongly. Tenkan-sen (1.5320) and Kijun-sen (1.5231) lines are support levels. One of the previous maximums of Chinkou Span line is expected to be a resistance level at 1.5433.

GBPUSD, D1
Let’s look at the daily chart. Last week Tenkan-sen line is below Kijun-sen line and they are directed towards each other. Chinkou Span is approaching the price chart from below. After considerable fall the pair reversed, broke through Tenkan-sen and Kijun-sen lines and hit flat bottom of the cloud. Senkou Span B line becomes a strong resistance level at 1.5379. Kijun-sen line is the closest support level at 1.5268.

Key levels
Support levels: 1.5320, 1.5231, 1.5268.
Resistance levels: 1.5433, 1.5379.
Trading tips
On the four-hour chart we can see a development of upwards movement. Long trades can be opened with Take Profit orders at 1.5433. On the daily chart the price has slowed down before flat bottom of the cloud. The breakthrough of this level will produce a signal to buy. However if the price bounce off this line, the pair will go down to 1.5268.
Anastasiya Glushkova
Analyst of LiteForexGroup of Companies
XAUUSD: gold regains lost positions
1. Current trend
Gold has grown since the beginning of this trading week, steadily consolidating above the level of 1300.00 USD per troy ounce. Gold is a traditional safe haven against risks of inflation and weakening in the national currencies. Precious metal will in the advantageous position if governments continue to pursue monetary easing policy. Amid victory of the ruling party in Japanese election and due to comments by Ben Bernanke, gold has strengthened positions and is likely to continue growth.
Technical indicators show that gold has all chances for further rise. All three moving average lines are directed upward. The signal line and histogram of MACD indicator are in the positive zone. Stochastic is in the oversold zone, both of its lines are directed downward, suggesting a chance of correction.
2. Levels of support and resistance
Pushing off from resistance level of 1340.00, the price is moving down to the level of 1321.00. Next support level is 61.6% of Fibonacci. The main target of the “bulls” is the level of 1370.00, which coincides with the level of 38.2% Fibonacci.
3. Trading tips
At the moment, the pair may experience downward correction to 1321.00 or lower up to 1300.00. It makes sense to place limit buy order at these levels. Buy orders can be placed if gold exceeds the level of 1340.00.
Ilya Lashenko
Analyst of LiteForex Group of Companies
NZDUSD: pair will continue to rise
1. Current trend
The pair NZDUSD has started this week with a growth and hit two-month maximum at 0.8010 on Tuesday. This level corresponding to the upper border of the ascending channel hasn’t been broken through. The price is being corrected now due to the unfavorable date on China manufacturing index. Its rate in July is 47,7 points, but the experts expected it to be 48,6 points.
2. Support and resistance; entry/exit points
Regardless sudden downward correction “bullish” movement is most probable today. The price may rise up to 0.8010, 0.8050 and even 0.8100 levels. We recommend to open long trades at 0.7990 with Take profits at 0.8100.
3. Technical indicators
On the four-hour chart Bollinger Bands do not show any important divergence and are directed upwards. Upper line of the indicator corresponds to the border of an uprising channel. Price chart can’t break through MA which is also a support level. MACD histogram is in overbought zone and has crossed the signal line from above. It can be a sigh of temporary fall but not the reverse of the trend. Stocahstic lines have crossed giving a signal to short-term sell.

Dmitriy Zolotov
Analyst of LiteForex Group of Companies
EURUSD: data from China has weaken the pair
1. Current trend
This Tuesday pair EURUSD has risen and reached resistance level at 1.3240, but the level hasn’t been overcome. The pair has started downward correction due to the negative statistics on China manufacturing index. Its rate in July is 47,7, which are the worst figures since three years ago. Unfavorable news from Heavenly Empire confirms the fears of investors. Economic recession of one of the world powers can affect USA as well as European countries. Today we anticipate flash manufacturing index of Eurozone and new home sales in USA.
2. Support and resistance;
The pair is trading around 1.3200 level. Today we expect the price to go up to 1.3240 and 1.3320. However temporary slide-down to Bollinger Bands MA at 1.3170 is also possible. Then the price can reverse and start to rise. We would recommend to open long positions with Take Profit orders at 1.3320. Short-term sell trades can be opened at 1.3200.
3. Technical indicators
On the four-hour chart Bollinger Bands do not show any important divergence and are directed upwards. Price chart is directed towards MA; it can be a sign of decrease to 1.3170 level. MACD histogram is in overbought zone, its volumes are increasing. Stochastic lines have crossed giving a signal of temporary fall.
Dmitriy Zolotov
Analyst of LiteForex Group of Companies
EUR/USD: general analysis
1. Current trend
At the opening of European session the pair fell to support level at 1.3175, and after that was trading near the level of 1.3200. The data on Eurozone released today was above experts’ expectations: index of business climate and current assessment index in Germany have overshoot projections.
Index of inflation and money supply M3 are at the level of 2.3%. These facts have triggered short-term rise up to 30-35 points. Another driver of the rise of the pair will be US statistics. Mr. Bernanke’s optimism in terms of recovery of the US economy might have been slightly exaggerated and it will not be able to provide appropriate support to the USD.
The data which is scheduled for the release today is as follows: number of initial claims for unemployment benefits, volume of orders for durable goods, business activity index in manufacturing sector. Experts believe that all indices will show negative performance.
2. Levels of support and resistance
The pair is once again testing resistance level of 1.3255; however it has failed to consolidate above this level. If this level is broken down the price will go up to the local highs of 1.3306.
3. Trading tips
We would recommend to open long positions with the short-term target of 1.3306. In the long-term the movement may reach the level of 1.3360, following the rollback to the line 1.3255.
Kamil Avad
Analyst of LiteForex Group of Companies
USD/CAD: technical analysis
1. Current trend
At the beginning of the month the pair hit again the local maximum of the autumn 2011, then USD/CAD started to decrease. After that the pair was trading within 1.037-1.043 range. Bears tried to break down the level 1.0370, which corresponds to 50.0% of Fibonacci lines and they have finally succeeded. The next support levels won’t stop the fall either.
Stochastic lines are in overbought zone, giving a signal to sell. Signal line and histogram of MACD indicator are in negative zone. Volumes of the histogram are decreasing, signal line is directed upwards. All three MA are directed downwards.
2. Support and resistance
The pair is testing support level at 1.0300. The next support lines will be 1.0270 and 1.0230. Resistance levels are 1.0325, 1.0350 and 1.0375.
3. Trading tips
Further decrease of the course is most probable. The pair will go down to 1.0200, however the correction towards levels 1.0325 and 1.0375 is also possible. Sell limit orders can be placed at these levels.

Ilya Lashenko
Analyst of LiteForex Group of Companies.